
Published: November 12th, 2025
After Hayden Adams, the founder and CEO of Uniswap Labs, revealed a significant governance initiative throughout the Uniswap ecosystem, Uniswap is once again generating news in the DeFi industry.
Due to regulatory demands, which Adams claimed cost "thousands of weeks and millions of dollars in legal fees," the company has been mostly unable to engage in governance since UNI's founding in 2020. These restrictions seem to be loosening now that the regulatory landscape is changing.
Adams presented a comprehensive strategy to restructure the protocol's operations, value distribution, and incentive alignment throughout its ecosystem in his new administration proposal. According to Adams, "at a high level, the proposal aims to turn on protocol payments and move them to UNI burns, establishing an economically viable system for value accrual."
In addition, the proposal calls for destroying 100 million UNI from the vault, which represents the fees that might have been destroyed if the mechanism had been in operation since launch. Protocol Fee Discount Auctions, an innovation intended to enhance liquidity supplier (LP) outcomes and directly collect MEV (miner extractable value) for the protocol, is another significant component.
Let's see the complete price insight from the UNI/USDT technical analysis:
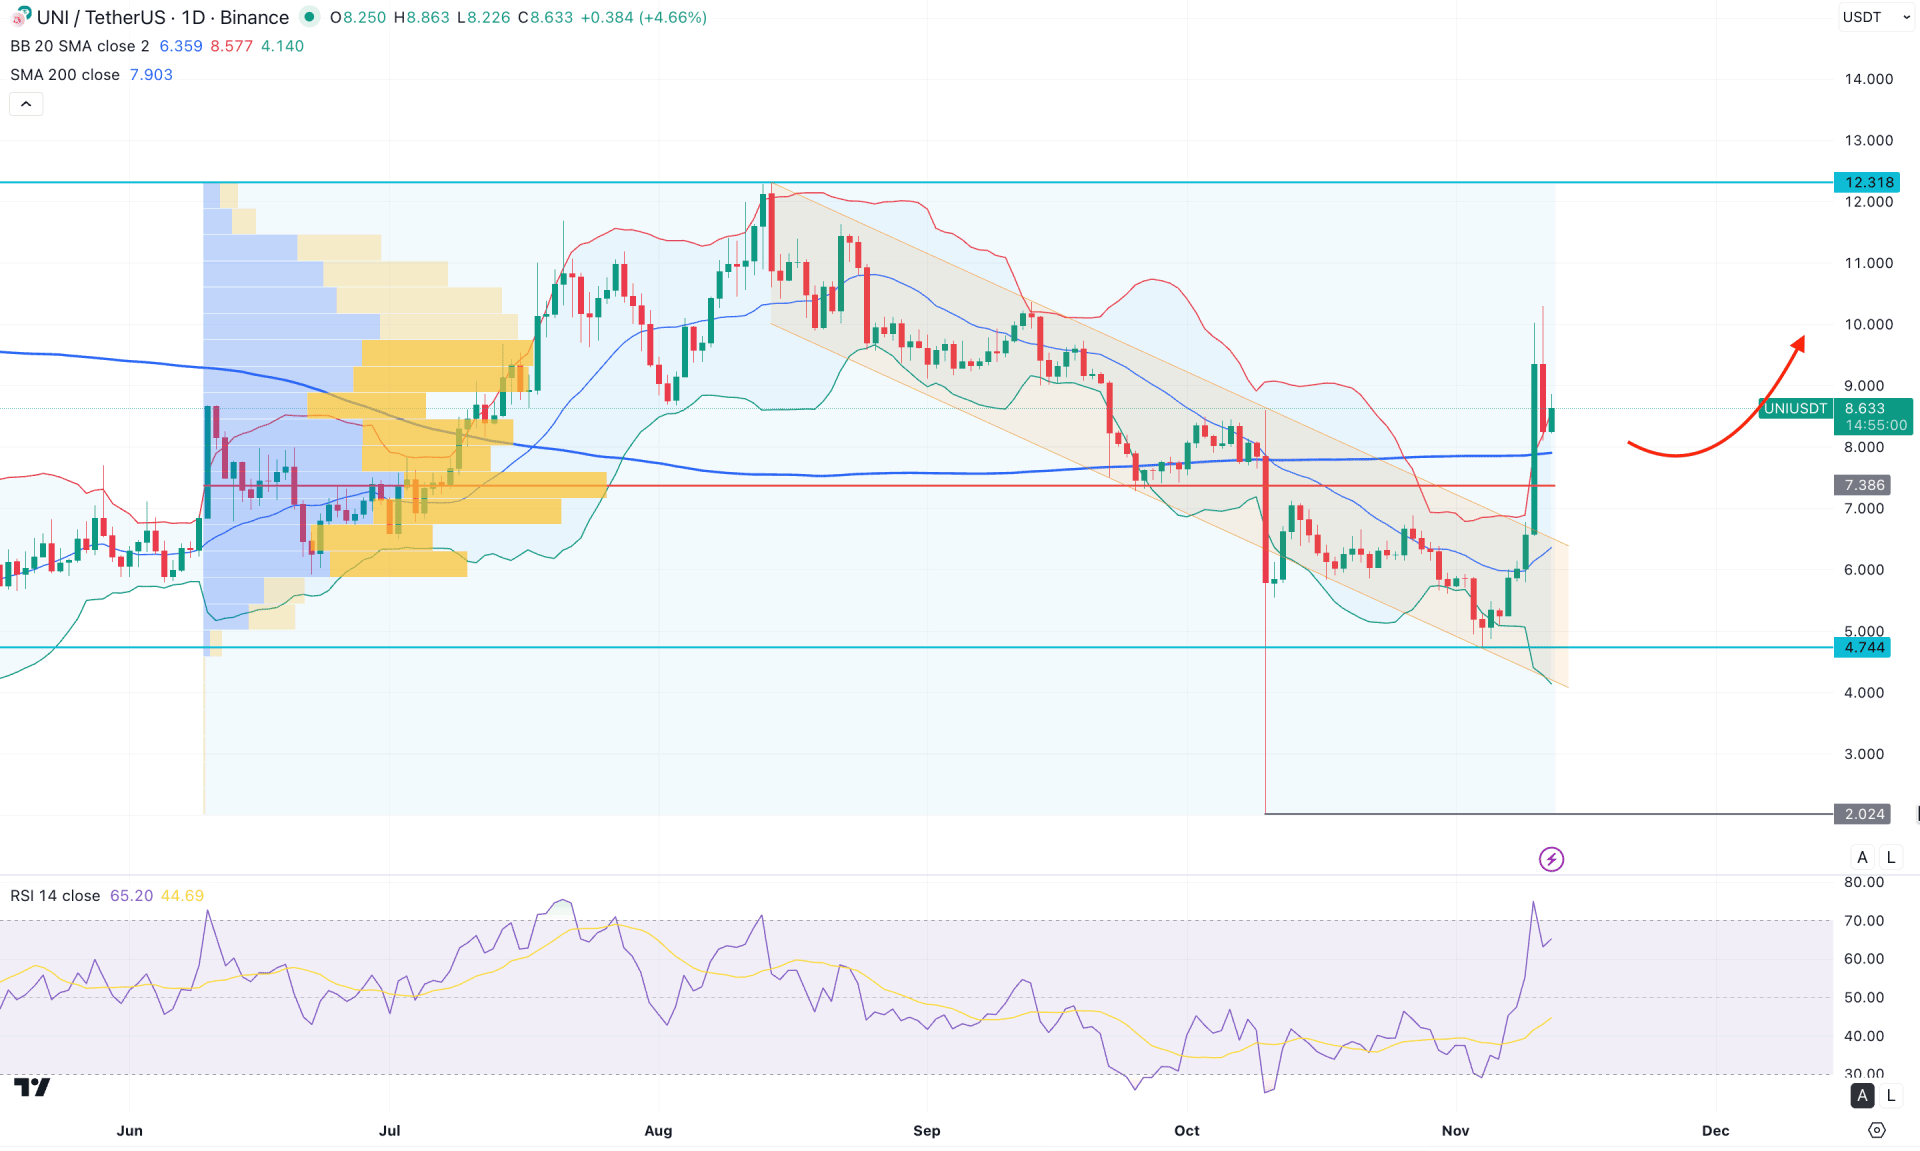
In the daily chart of UNI/USDT, the recent price showed a massive buying pressure after wiping out investors from the yearly low. The strong liquidity sweep with a massive bullish pressure from the channel breakout indicates a potential bullish continuation opportunity.
In the higher timeframe, a strong range-bound market is visible where the latest monthly candle closed above the range support after sweeping the liquidity from the multi-year low. Although no clear trend is present in the monthly timeframe, the recent buying pressure from the October 2025 high signals a potential range extension opportunity at the 12.31 high.
Moreover, the volume is positive to bulls as the recent candle has formed a bullish breakout with a close above the high volume line. As per the volume indicator, the largest activity level since June 205 is spotted at the 7.38 level, which is below the current price.
In the daily chart, a strong bullish breakout is present above the 200-day Simple Moving Average line. As a result, the price peaked higher and moved beyond the upper Bollinger Bands Resistance level. Primarily, the bullish overextension might find relief with a corrective bearish pressure, from where a bullish opportunity might come.
In the secondary indicator window, the Relative Strength Index (RSI) has reached the overbought zone, signalling an active bullish pressure.
Based on the overall market structure, the UNI/USDT price is more likely to continue higher as the price is supported by a valid channel breakout. Primarily, a downside correction towards the 200-day SMA might come from where a bullish reversal might create a long opportunity.
On the bullish side, the immediate resistance is located at the 12.00 psychological line before reaching the 19.39 resistance level.
On the other hand, the current downside correction might reach up to the mid Bollinger Bands line. However, breaking below the 6.00 psychological line might make the entire bullish structure invalid. In that case, a potential bearish momentum might arise, targeting the 4.74 key support level.
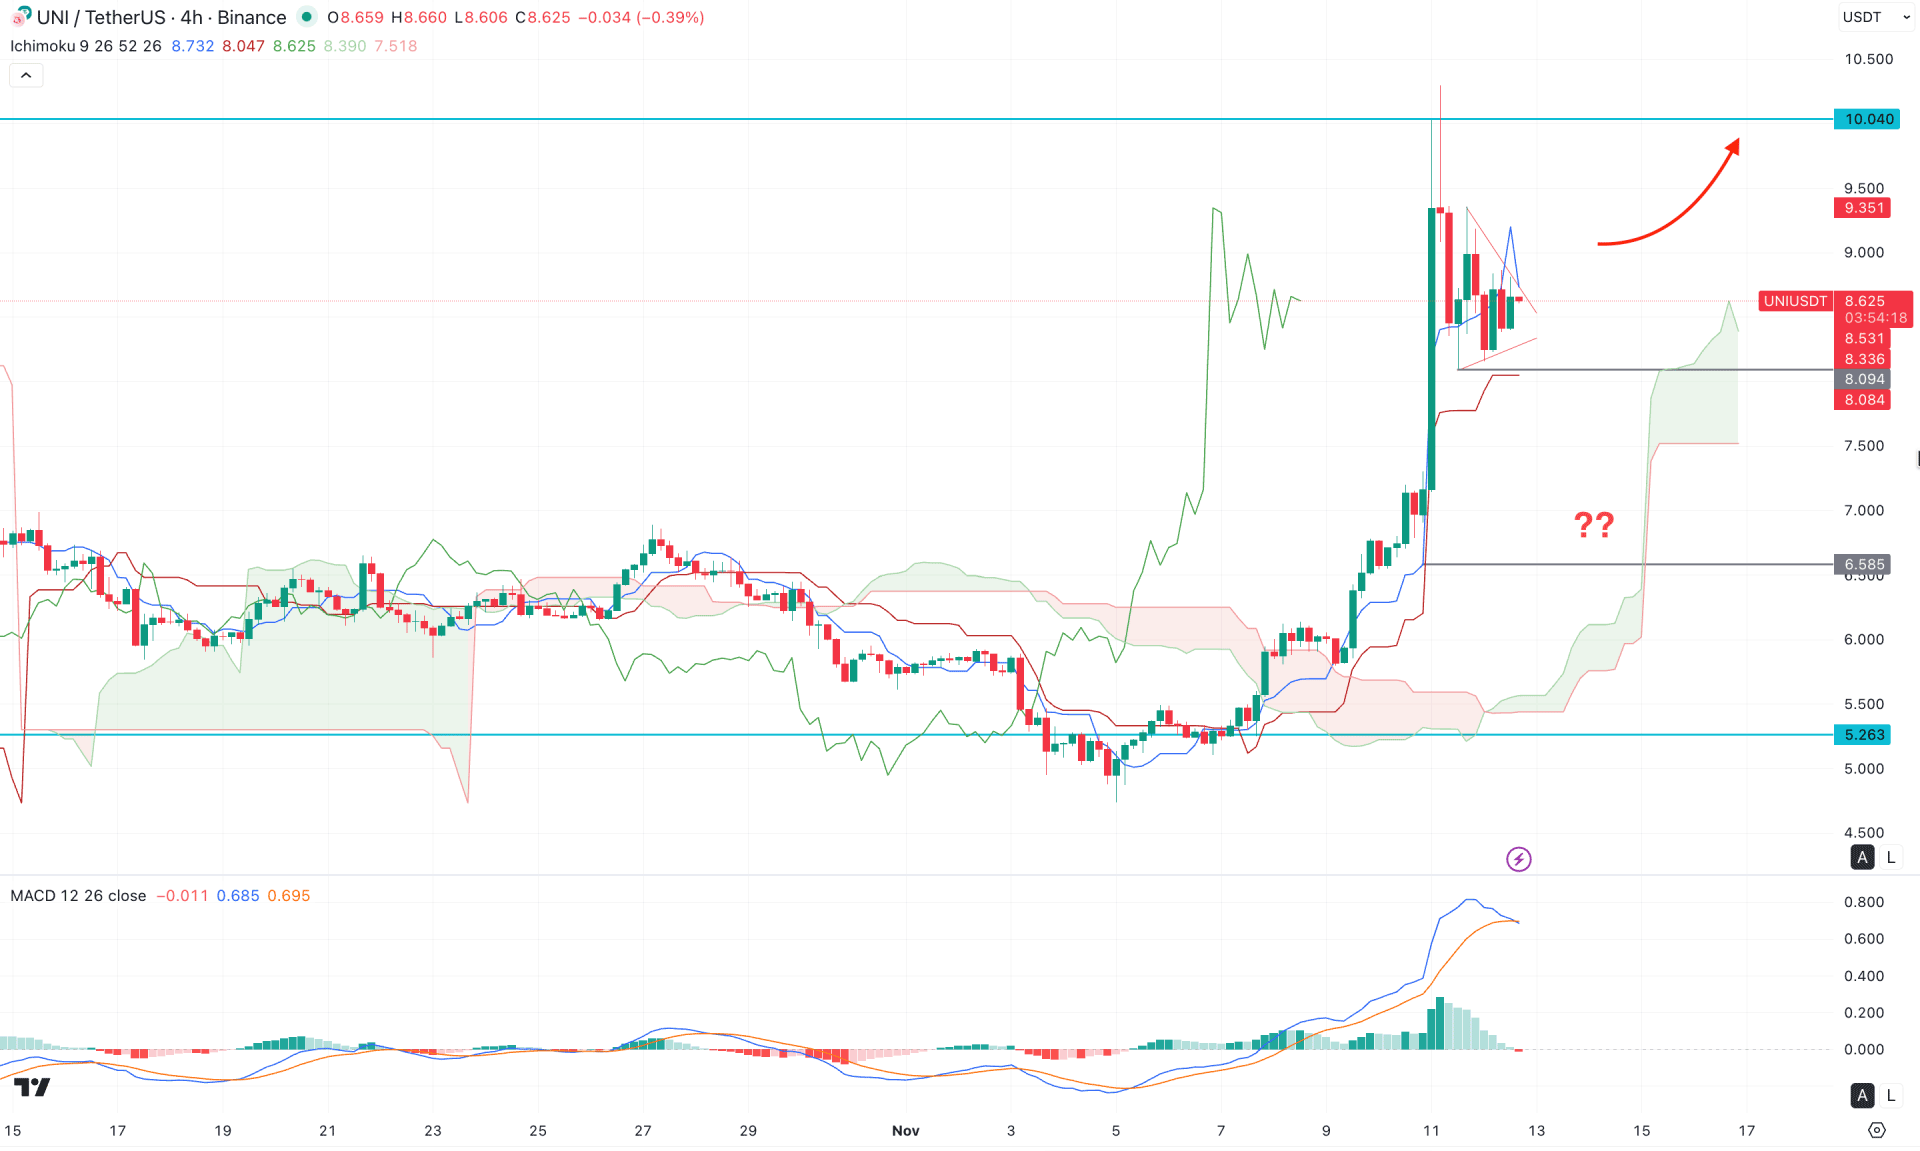
In the H4 timeframe, UNI/USDT price is trading above the Ichimoku Kumo Cloud, suggesting a potential bullish momentum. However, the massive bullish breakout found a peak at the 10.32 level before moving sideways within the symmetrical triangle pattern.
In the future cloud, Senkou Span A remains steady above the Senkou Span B, while the thickness of the cloud area is not solid. As the futures cloud's structure shows a mixed sentiment, investors might need additional clues before going long in this pair.
In the secondary indicator window, the MACD Histogram lost the buying pressure and reached the neutral level. On the other hand, the MACD Signal line has reached the bullish peak from where a bearish crossover is visible.
Based on this market structure, a potential bearish correction is pending where sufficient liquidity is present below the 8.00 support level. In that case, breaking below the 8.00 line with a bullish recovery above the Kijun Sen level might open a long opportunity, targeting the 10.04 level.
The alternative trading approach is to find a strong bearish recovery below the 8.00 line with a failure to hold the price above the Kijun Sen line. An extended selling pressure below the Cloud area might offer a potential short opportunity, targeting the 5.26 support level.
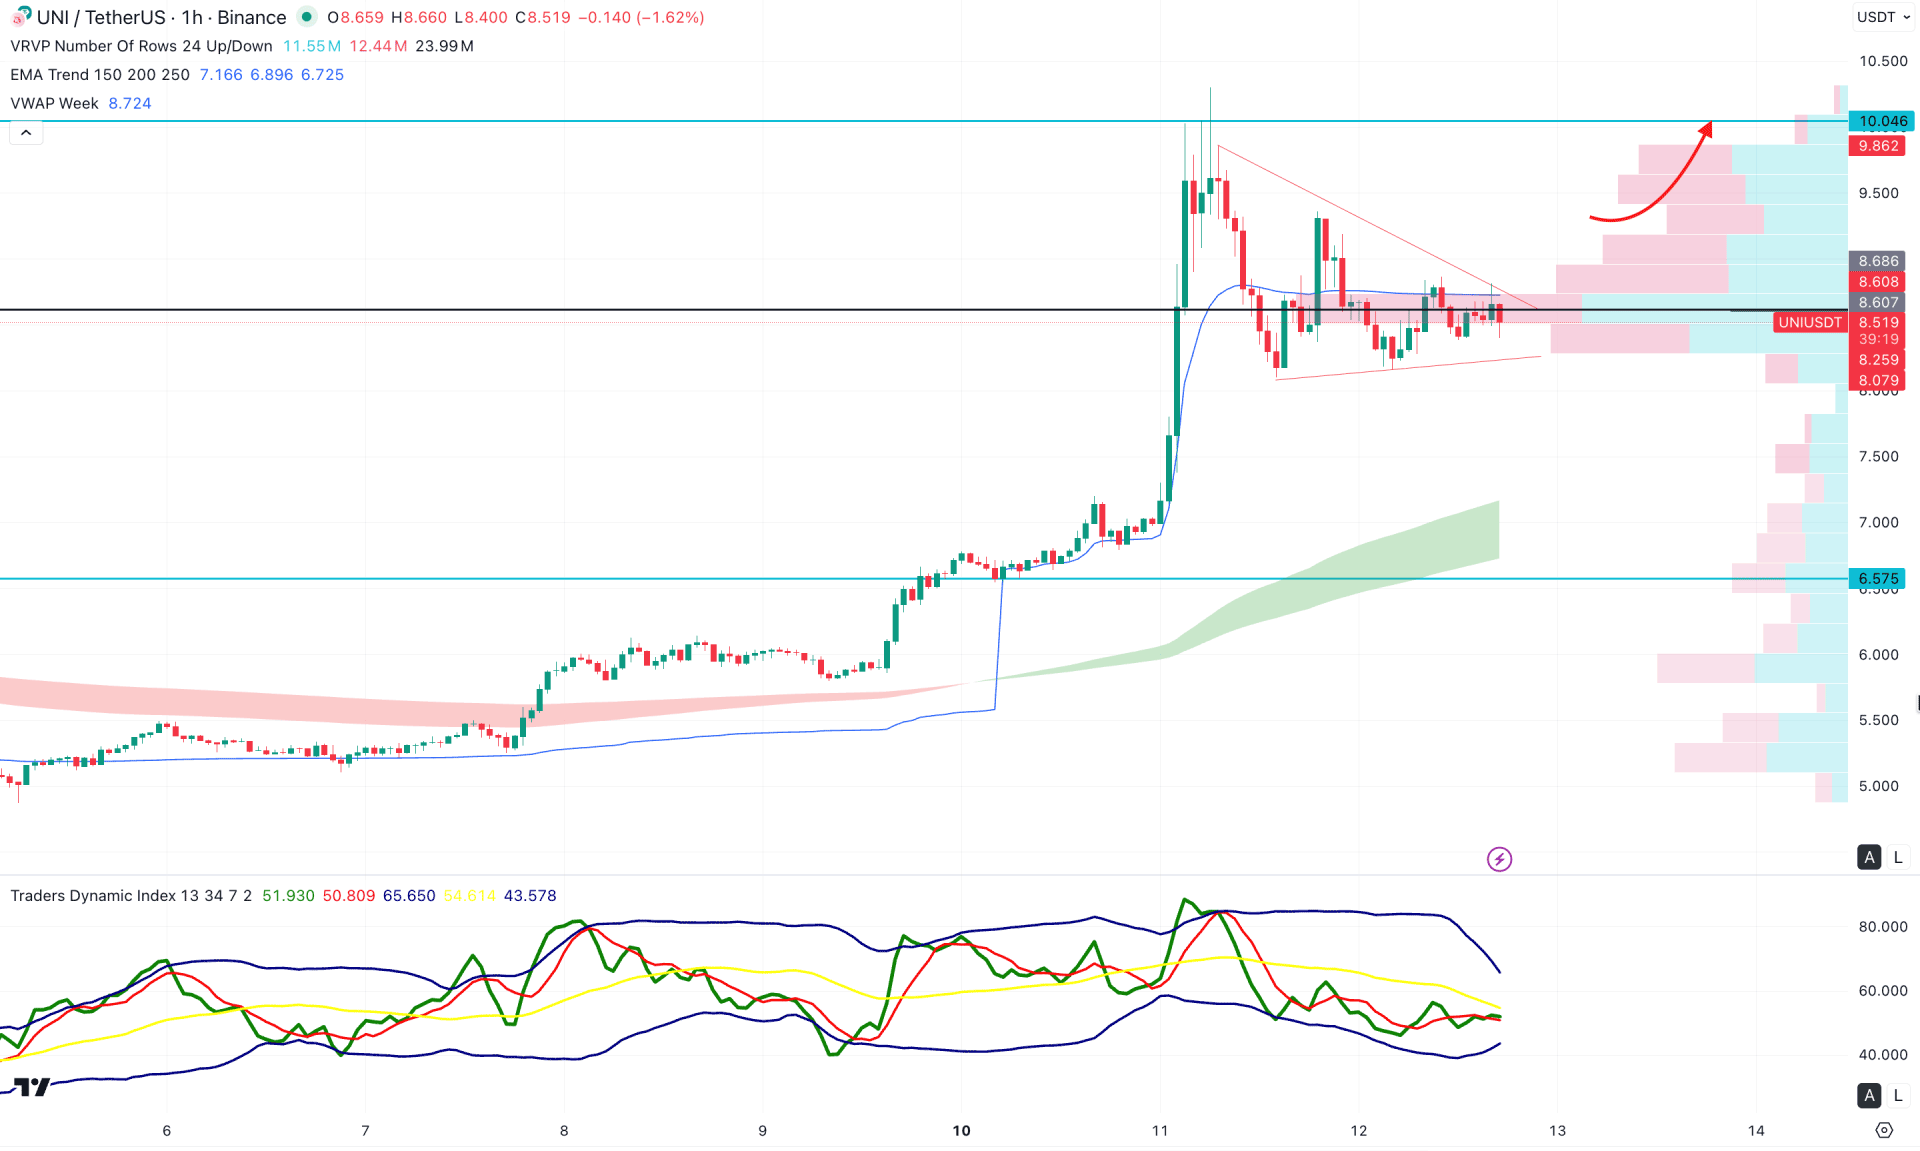
In the early timeframe, a clearer picture shows the formation of a symmetrical triangle, which indicates no significant selling pressure at the top. Primarily, a bullish breakout from the triangle, followed by consolidation above the resistance, could offer a high-probability long opportunity.
On the other hand, the price is aligned with the high-volume line, signaling accumulation at the current price area. Additionally, the weekly VWAP level is close to the current price, suggesting potential range formation.
In the secondary indicator window, the Traders Dynamic Index (TDI) is moving sideways below the 50.00 neutral line, indicating weakness among buyers.
Based on this structure, a failure to hold above the triangle support, with a bearish candle closing below the 8.16 level, might extend losses and push the price toward the exponential moving average before any long opportunity emerges. However, an immediate bullish breakout with strong price action above the triangle resistance could create another potential long entry at any time.
Based on the overall market structure, UNI/USDT is more likely to extend the buying pressure. Investors should closely monitor how the price trades in the intraday chart, as a valid sell-side liquidity sweep is pending from the Triangle low.


