Published: June 15th, 2022
Unifi Protocol DAO has become a revolutionary approach to the decentralized finance sector. The main aim of this project is to bring modern technologies to the financial world, like implementing blockchain, utilizing smart contracts, and ensuring top-notch security. Implementing this technology will allow enterprises to develop the DeFi solution by ensuring higher security.
The massive users’ attention and adoption of the Unifi Protocol DAO allowed the UNFI/USD price to have a massive 1542% spike this month. However, the price rebounded lower immediately from the 42.00 high following the broader crypto crash.
The bullish possibility of UNFI is still potent as it combines the power of blockchain technology on Ethereum DApp and DeFi solutions. Moreover, the introduction of interoperability in the DeFi world would allow the UNFI token to be considered a solid buy. Let’s see the future price direction from the UNFI/USDT technical analysis.

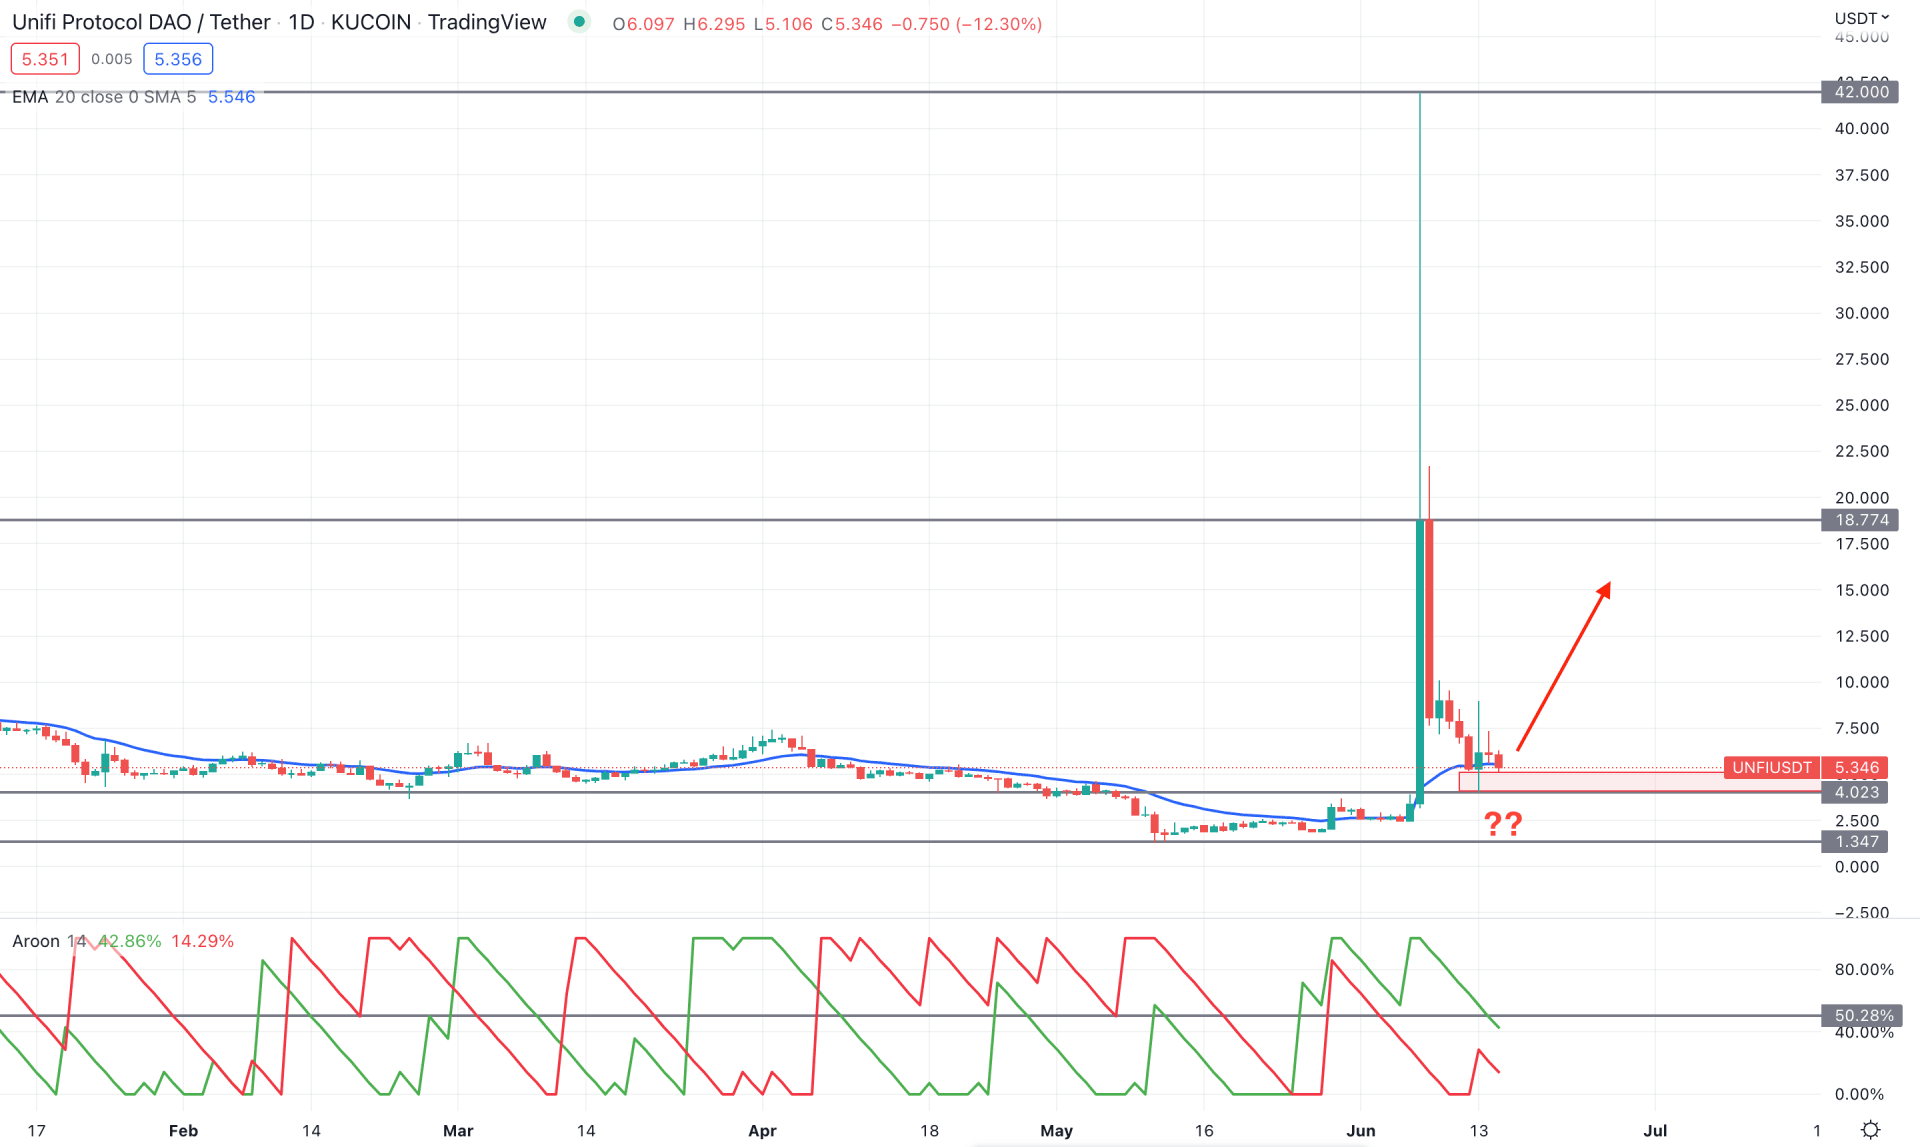
According to the UNFI/USDT daily chart, the broader market context is bullish, although the pump and dump scheme is active. After the massive buying pressure, the price rebounded lower, whereas the daily flip zone is at the 18.77 level. The selling pressure became more substantial from the flip zone but failed to move below the 4.02 daily support level.
The above image shows how the price moved down and formed indecision at the daily support level while the dynamic 20 EMA remained closer to the price. In the indicator window, the Aroon Up (green line) and Aroon down (red line) show the early trend of the market, which is still bullish. As the Aroon Up is above the Aroon Down, investors should monitor how a bullish daily candle comes with the Aroon Up above the 50% level. It will indicate another attempt of bulls to recover the early loss initiated from the daily flip zone.
Based on the daily price structure, investors should wait for a daily bullish candle above the dynamic 20 EMA, which will increase the possibility of testing the 18.77 level in the coming days. On the other hand, the break below the 4.02 level with a daily close would lower the price towards the 1.34 level.

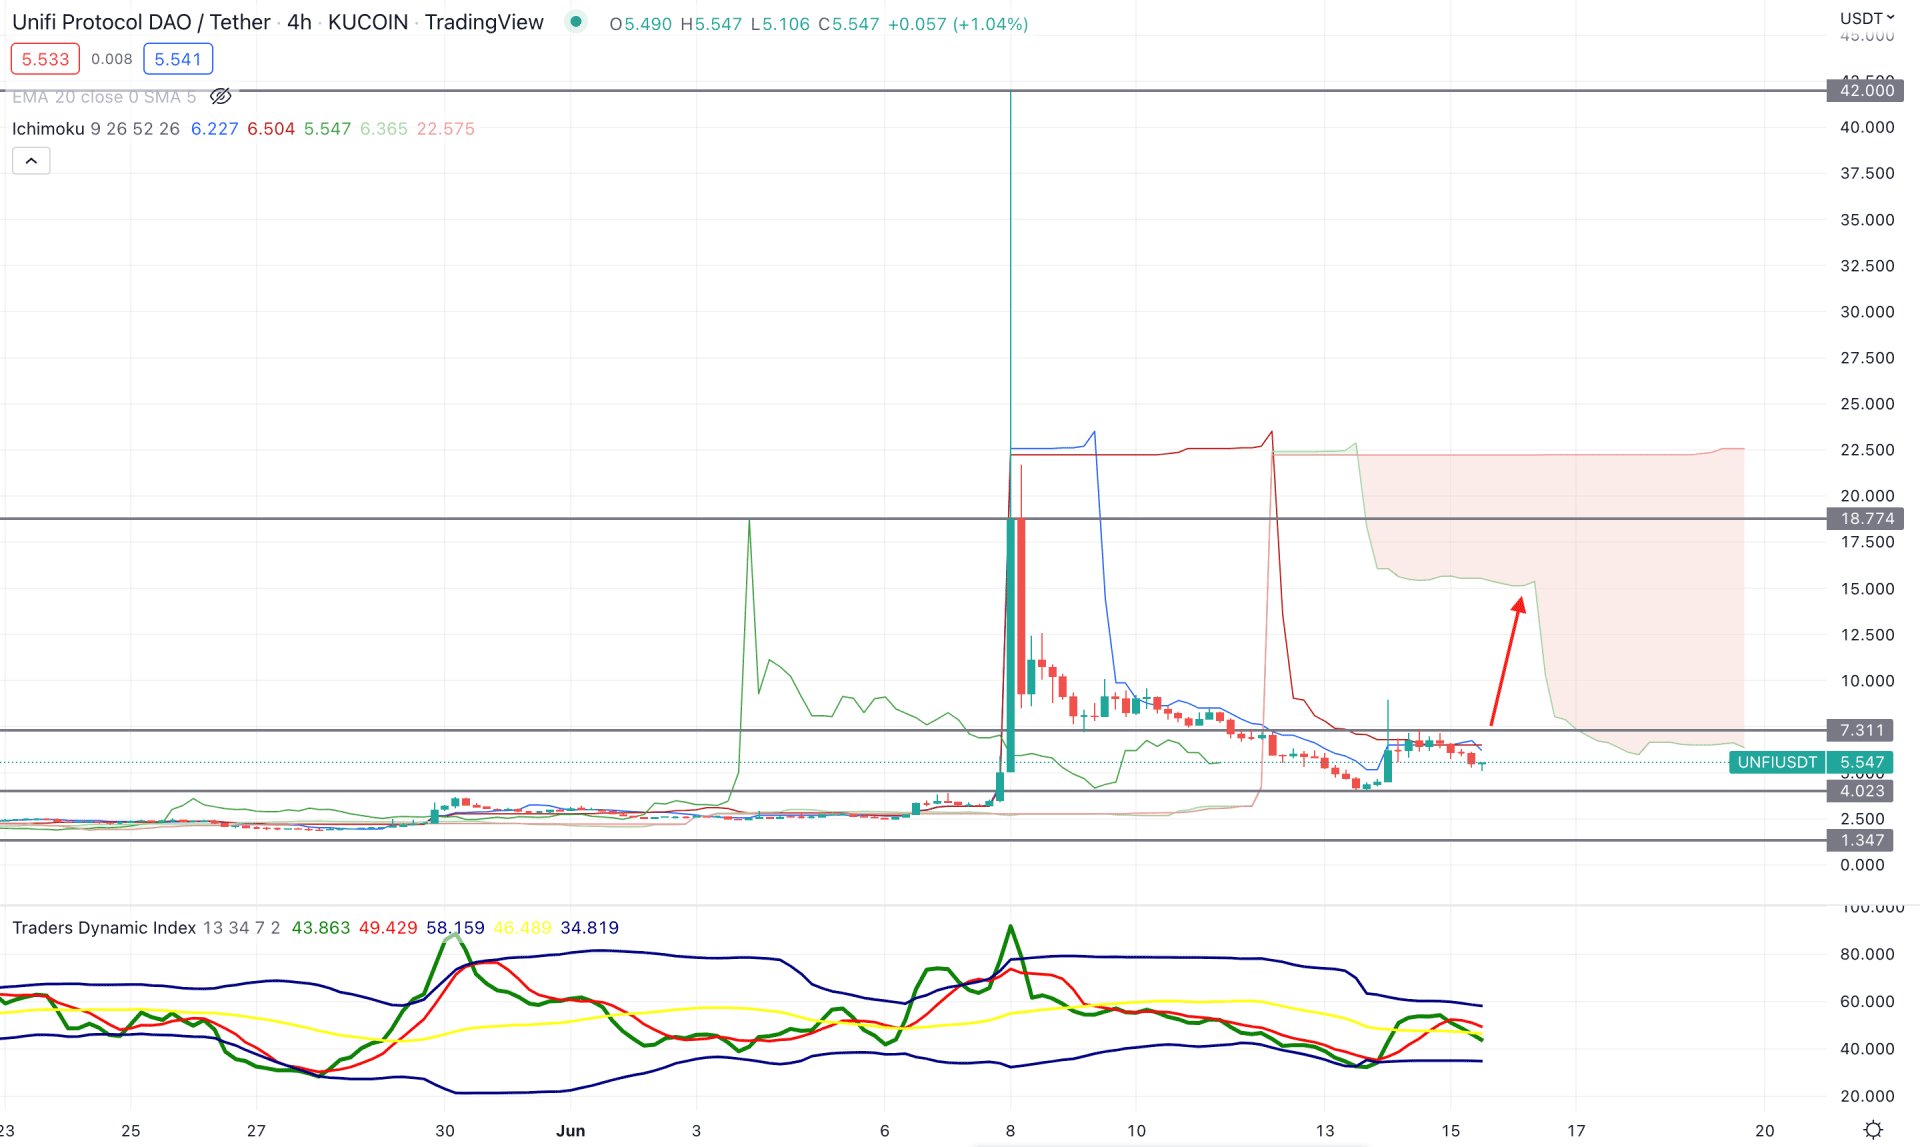
According to the Ichimoku Cloud, the market context for UNFI/USDT is bearish as the future cloud has a substantial gap between Senkou Span A and Senkou Span B. However, the Senkou Span B remained flat for a considerable time, indicating less medium-term traders' involvement in the market.
The above image shows the Trader's Dynamic Index on the indicator window where the TDI line is above the 50.00 level. Therefore, it indicates a corrective momentum for the price where any rebound in the TDI line towards the upper band will be a bullish signal. On the other hand, the dynamic Tenkan Sen and Kijun Sen are still above the current price, where any selling pressure from these levels would open a bearish opportunity.
Based on the H4 structure, investors should monitor how the price trades within the 7.31 to 4.02 zone. Any bullish H4 candle above the 7.31 resistance level would be the primary sign of a possible buying pressure towards the 18.00 area. On the other hand, the current price is still bearish below the Kijun Sen line, where any bearish H4 candle below the 4.02 level would boost the selling pressure towards the 1.34 area.

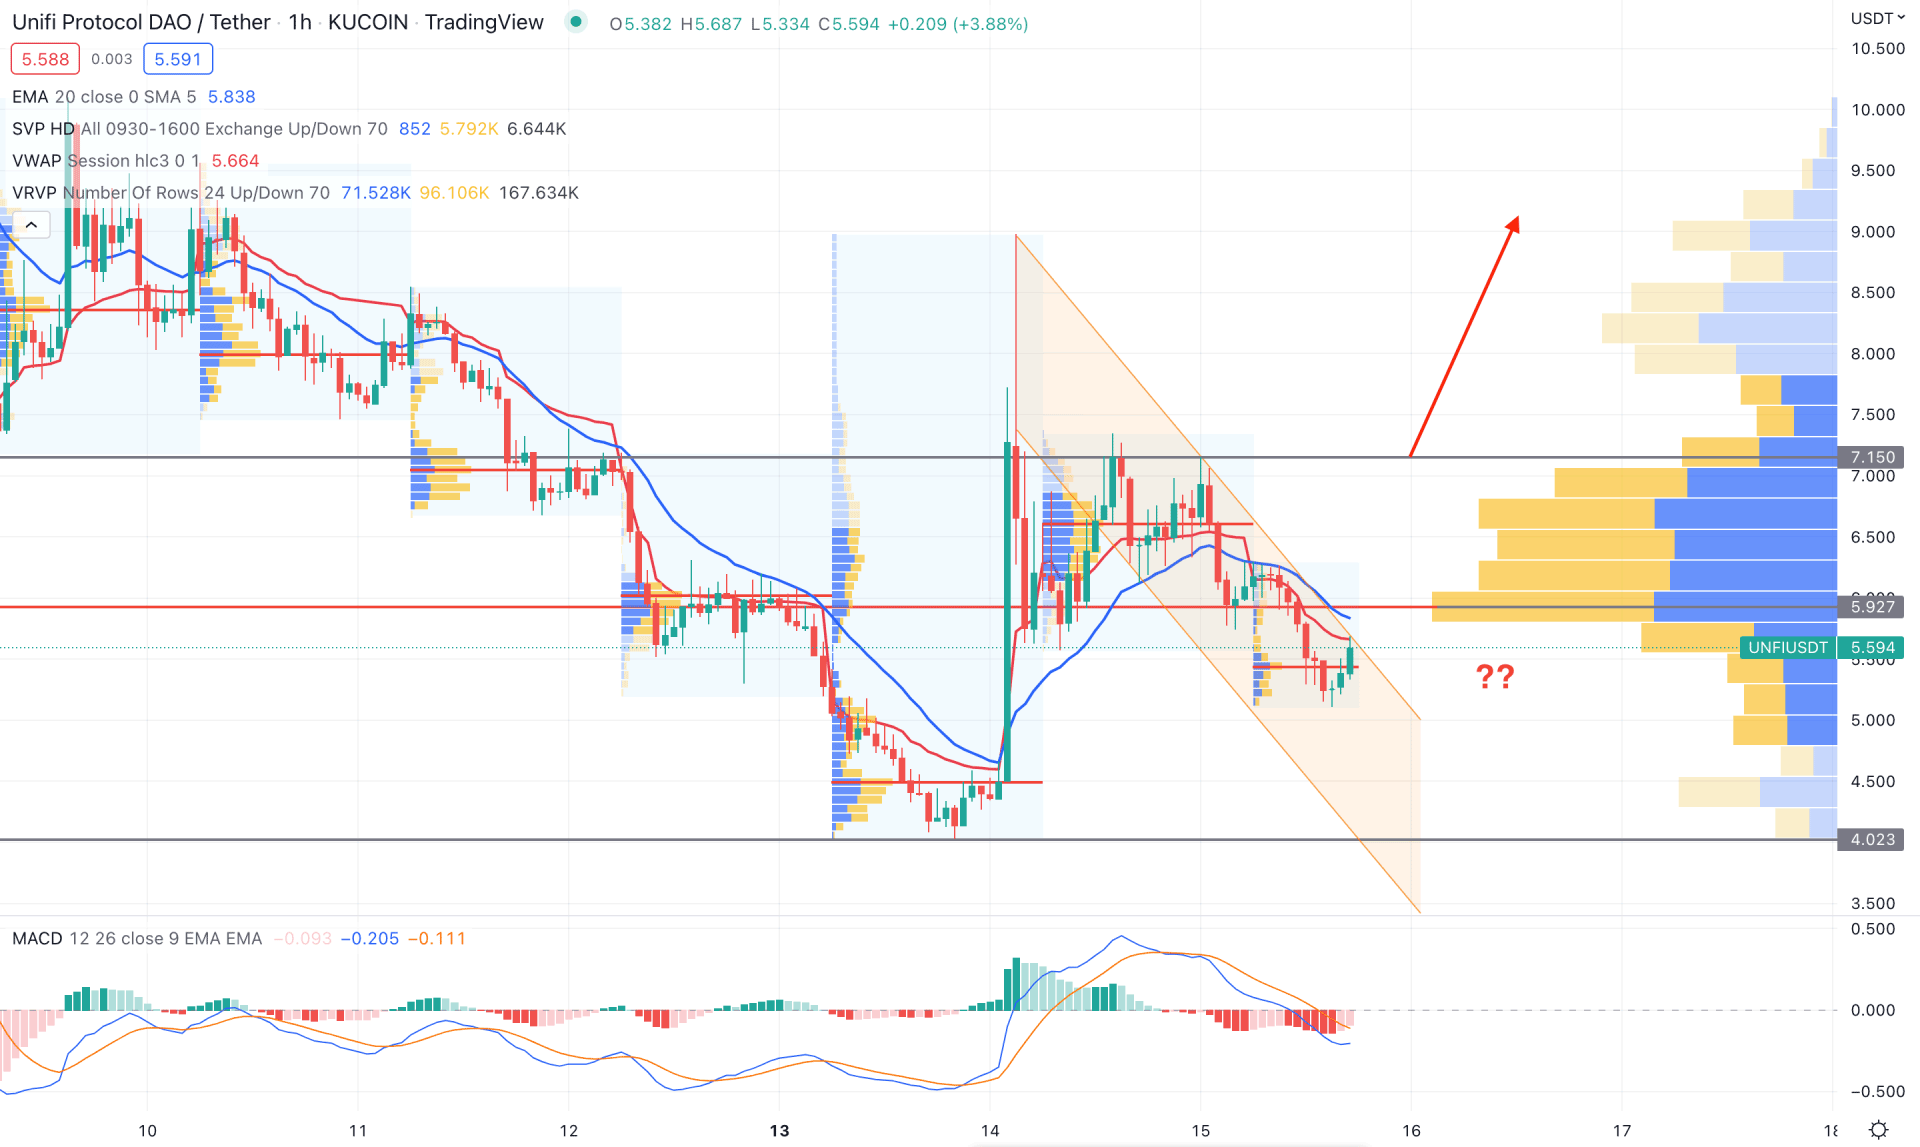
According to the intraday price chart, UNFI/USDT trades within a bearish channel, followed by a bullish impulsive H1 candle that made a 71% price change. According to the volume structure, the current high volume level from the visible range is at 5.92 level. Therefore, investors should closely monitor how the price reacts after getting closer to the 5.92 level. On the other hand, the latest intraday high volume level is below the current price, pushing it higher.
The above image shows how the MACD Histogram loses its bearish momentum in the Histogram where the dynamic 20 EMA and weekly VWAP are above the current price. Therefore, based on the current structure, bulls should find the price above the 7.15 level before going long towards the 10.00 level. On the other hand, the broader market trend is still bearish, where any selling pressure from the dynamic 20 EMA would extend the current channel towards the 4.02 level.
As per the current market context, the excessive volatility in the crypto market may come from the FOMC, where the Fed will discuss the impact of higher inflation on the US economy. Although the broader market sentiment in the crypto market is bearish, a buying pressure in the daily UNFI/USDT price from the 4.02 support level would make a temporary recovery for buyers.