Published: August 7th, 2024
The announcement on Tuesday that Uber Technologies had earned a profit stemmed from the company's strong growth in its food delivery and ride-sharing divisions during the previous quarter.
The business reported a $1.02 billion profit for the three months ended in June, which was more than anticipated and included income from operations as well as a $333 million benefit from its equity investments. Analysts had anticipated a $654 million profit.
As the tech-heavy Nasdaq Composite Index increased 1%, Uber shares surged 11% higher.
Uber announced its first annual profit as a publicly traded firm last year, ushering in a period when businesses often overspend and report significant losses in an effort to gain market share. However, despite its fundamental activities continuing to turn a profit, the company lost money in the initial three months of the year due to losses from its stock investments and settlements with the law.
Uber said it anticipates revenues to rise and its core operations to remain lucrative in the current quarter, but a significant selloff in shares might weigh heavily on its equity investments and push Uber into another loss in the months ahead.
Uber stated that it anticipates net bookings, or the total worth of transactions made on its app, to be between $40.25 billion and $41.75 billion this quarter. FactSet surveyed analysts, and they predicted $41.18 billion.
Uber's second-quarter revenue bookings increased to $39.95 billion, 19% higher than experts had predicted.
Revenue, or Uber's share of those reservations, increased by 16% to $10.7 billion, which was also somewhat more than anticipated.
Uber's food delivery business is about to face some regulatory obstacles. Recent legislation aiming at increasing driver compensation was passed in Seattle and New York City, which forced Uber Eats to impose higher fees on customers to cover the extra expenses.
Let's see the further aspect of this stock from the UBER technical analysis:

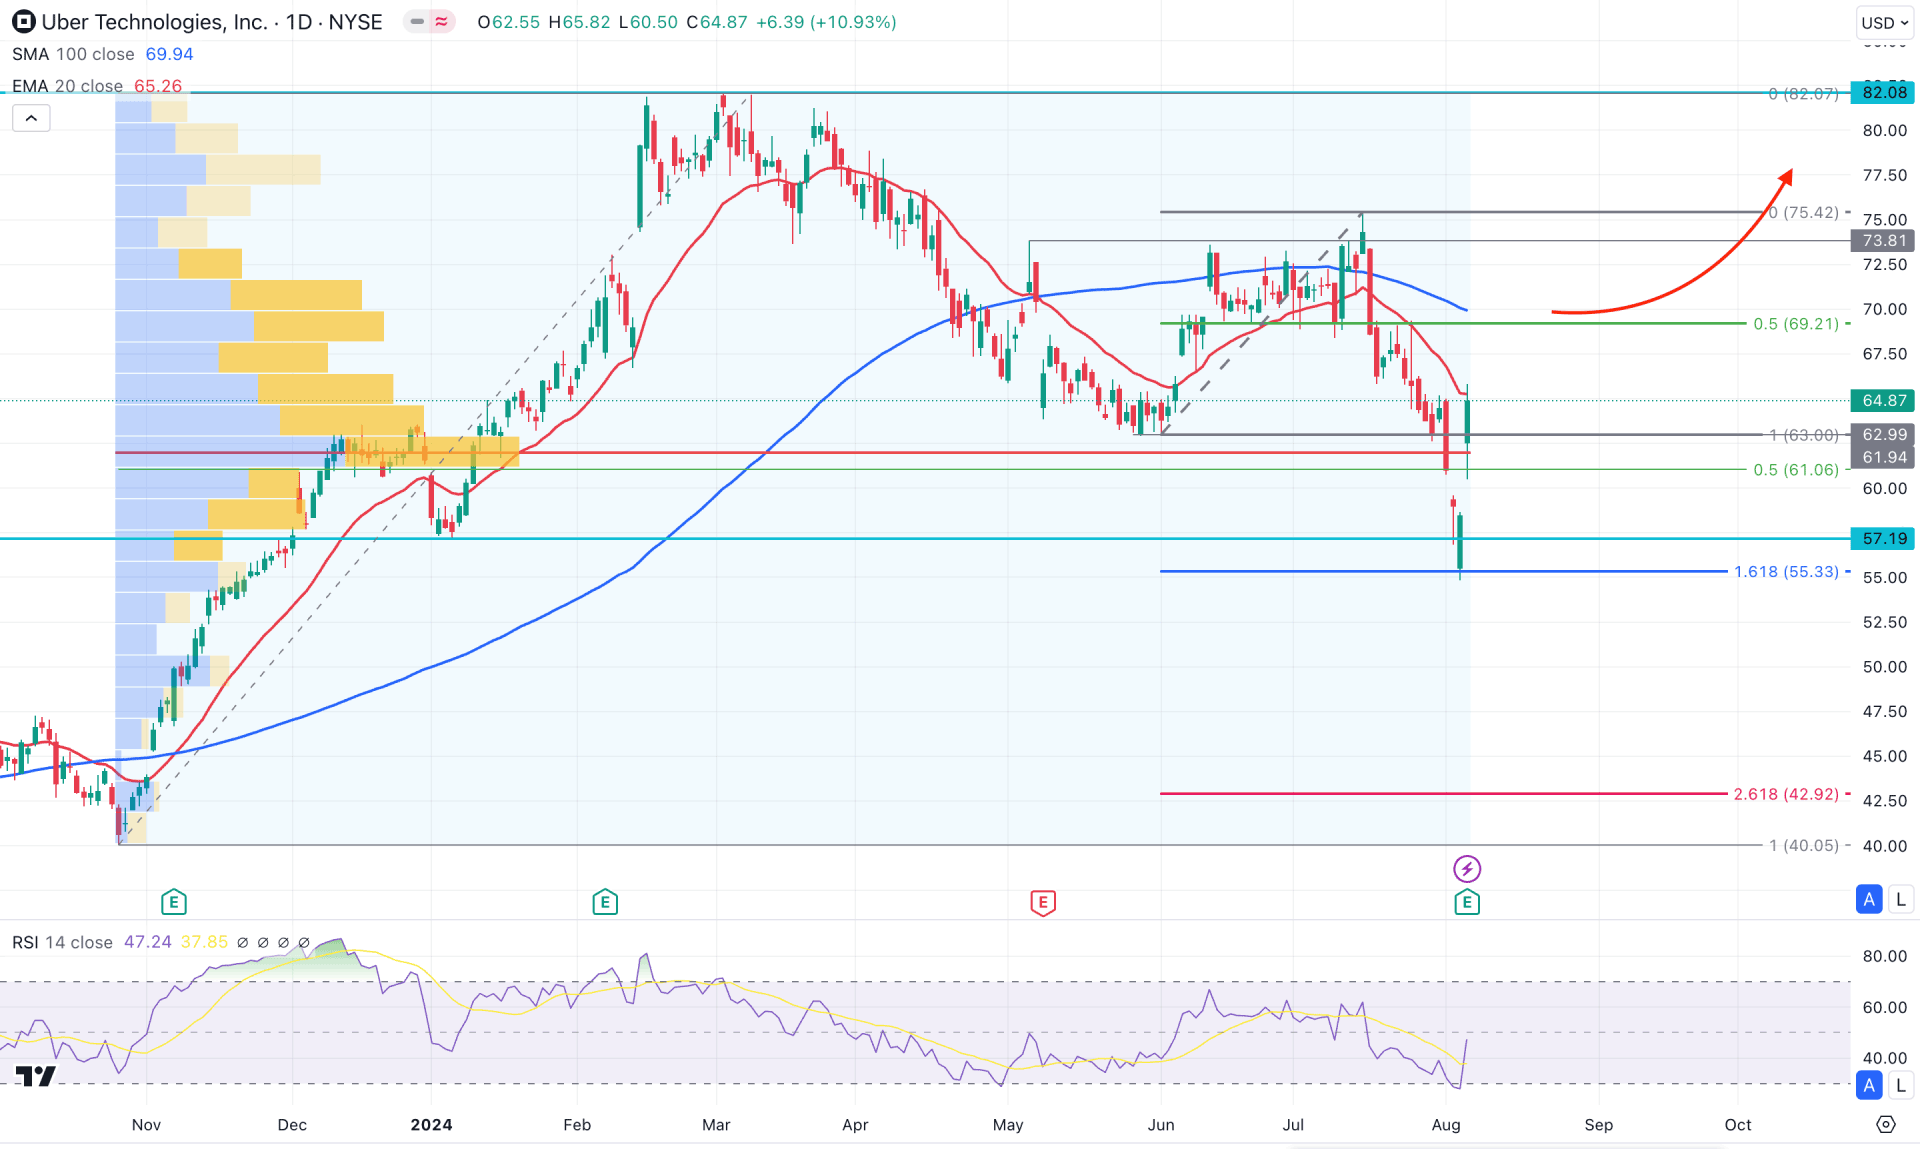
Uber stock (UBER) has maintained the buying pressure since November 2023, at the bottom, as no significant low formation has been seen. Moreover, the recent price rebounded from the 50% Fibonacci Retracement level from the 40.05 low to the 82.08 high, which could signal a bullish continuation opportunity.
In the broader context, the price made a significant sell-side liquidity sweep from the July 2024 low, suggesting a potential rebound. However, the existing candle remains bearish, as the strong upward pressure in June was eliminated immediately in the next month. As the current price moved above the July low, investors might expect an upward continuation after having a consolidation above this line.
The volume structure looks positive for bulls, where the current high volume level is below the current price. Also, the most recent daily candle rebounded higher and closed above the high volume line, suggesting a potential breakout.
In the daily chart, the 100-day Simple Moving Average is still above the current price, which might limit the gain at any time. Also, the 20-day Exponential Moving Average is acting as an immediate resistance, which needs to be overcome before extending higher.
Based on the daily outlook of UBER, an extended upward pressure with a daily candle above the 69.21 could signal a conservative bullish approach aiming for the 82.08 key resistance level. Moreover, a stable market above the 73.81 resistance level could extend the momentum and take the price to the 100.00 psychological level.
On the other hand, a bearish pressure from the 100-day SMA could signal a bearish pressure, aiming for the 50.00 psychological level.

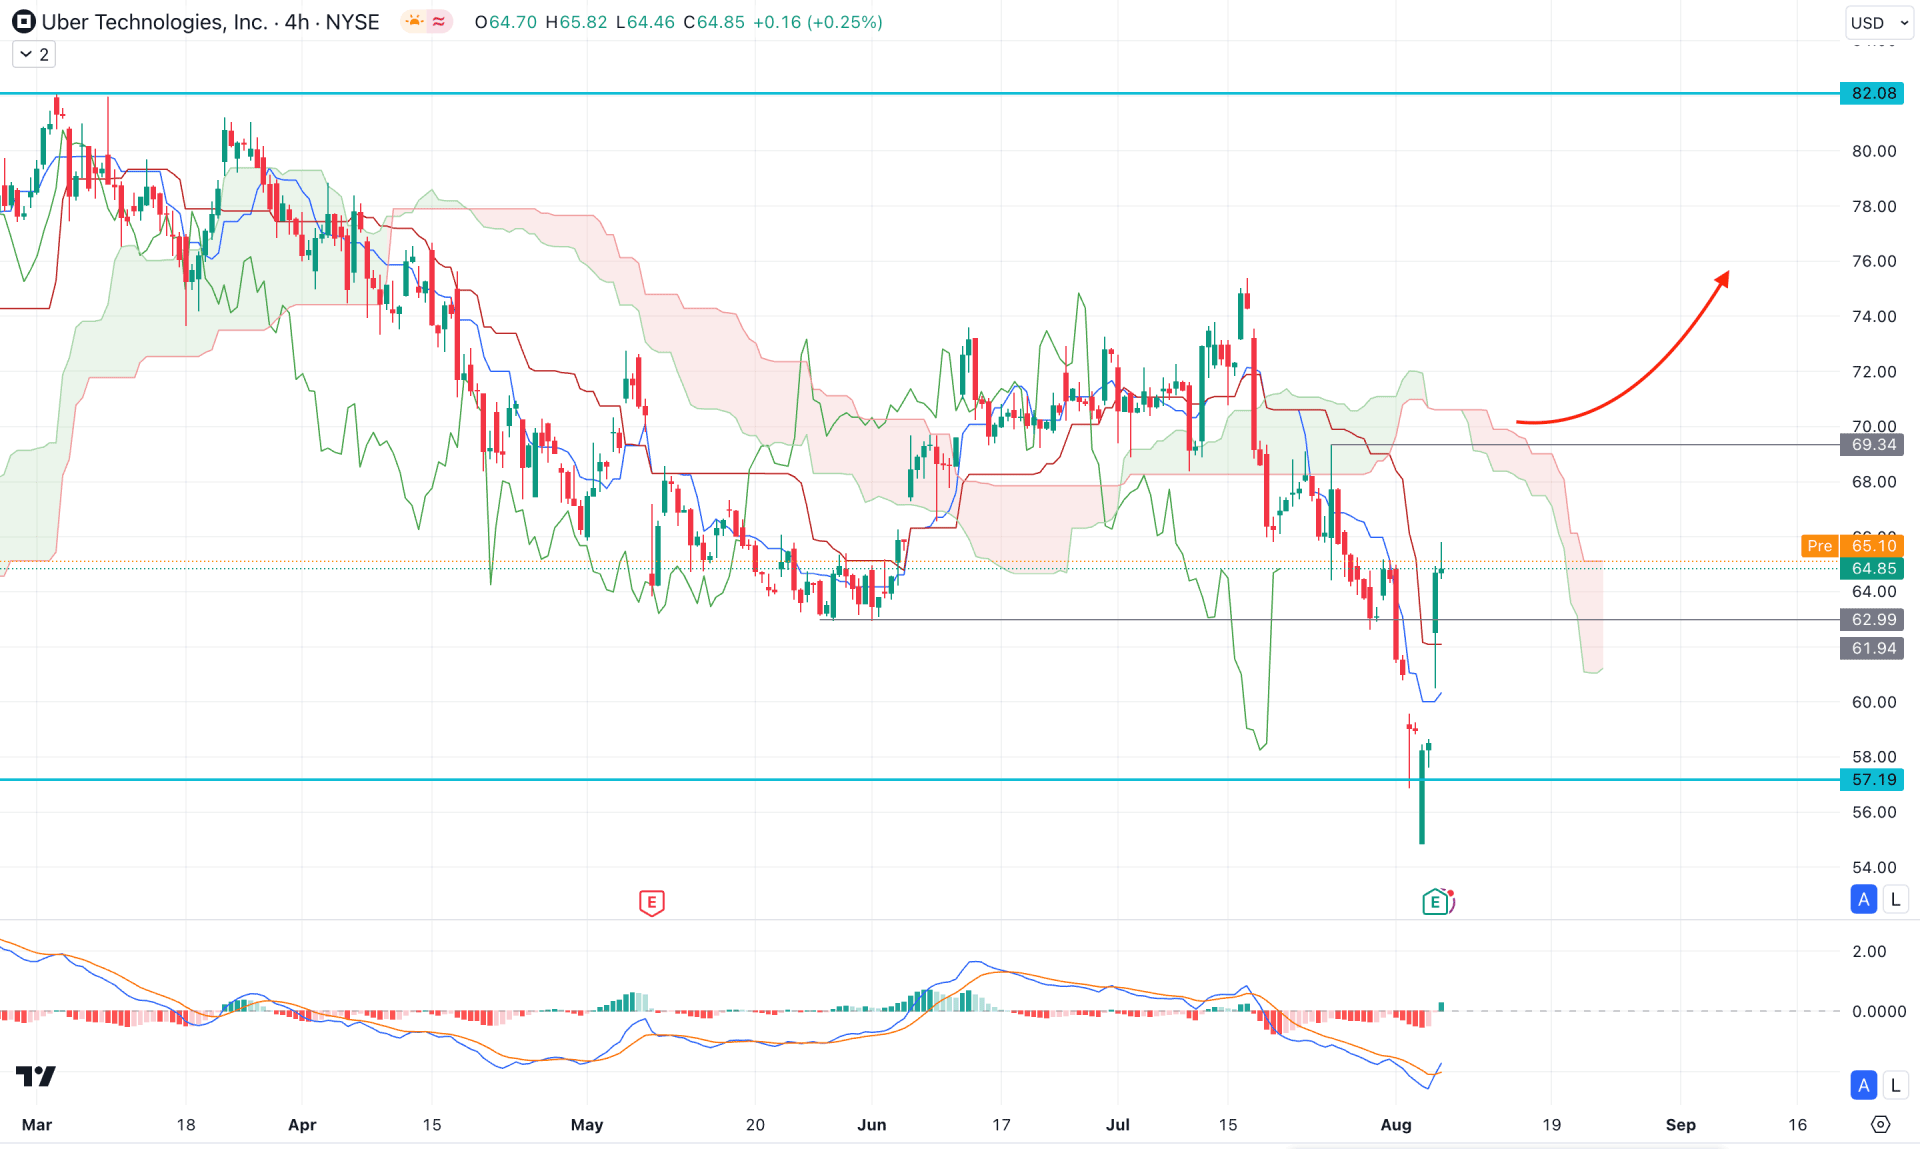
In the H4 timeframe, the Ichimoku Cloud zone remains above the current price, signaling an ongoing bearish pressure. Moreover, the future cloud is bearish, where the Senkou Span A is above the Senkou Span B.
In the indicator window, the MACD signal line showed a bullish crossover, which is a shift in the Histogram. It is a sign that upward continuation is possible, but more clues are needed from the upcoming price action.
Based on the H4 structure, an upward continuation with an H4 candle above the 69.34 level might open a long opportunity, aiming for the 82.08 resistance level.
On the other hand, a failure to move above the could cause resistance with a bearish pressure below the dynamic Kijun Sen level, which could resume the existing trend at any time.

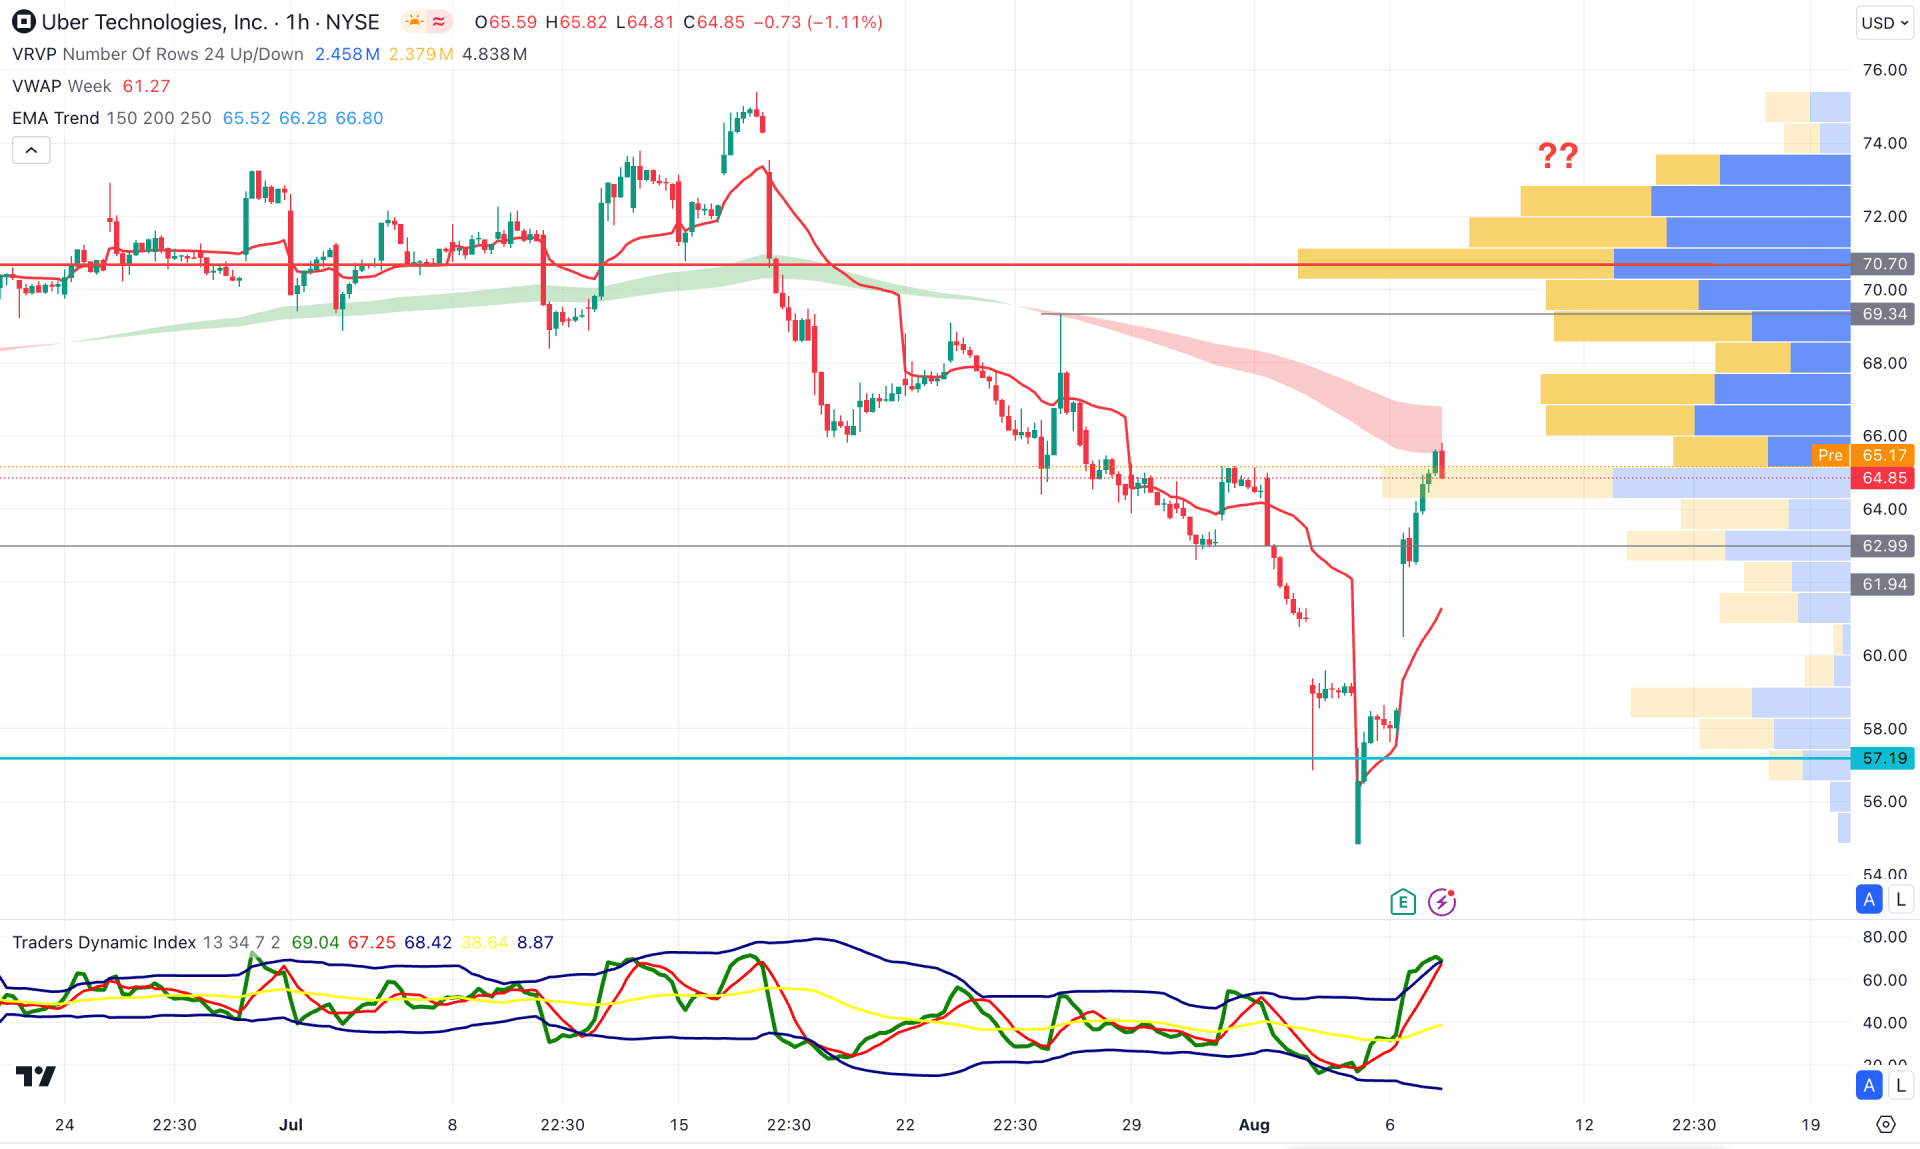
In the hourly chart, UBER is trading higher than the weekly VWAP level, and resistance was found at the dynamic MA wave. Moreover, the visible range high volume level is at 70.70 level, which is working as a major resistance.
In the indicator window, the Traders Dynamic Index (TDI) moved to the highest level in the last three months, suggesting a prolonged buying pressure. The higher TDI with resistance from the EMA wave could signal a bearish possibility, depending on the upcoming price action.
Based on this outlook, an additional buying pressure with an hourly close above the 70.70 level could open the long opportunity. However, a failure to break above the EMA cloud with a bearish H1 candle below the weekly VWAP support could lower the price toward the 56.00 level.
Based on the current market outlook, UBER has a higher possibility of moving higher after forming a valid V-shape recovery. Investors should closely monitor the daily price as a stable market above the near-term resistance could open a long-term bull run.