
Published: July 27th, 2023
The market anticipates that Uber Technologies (UBER) will report a year-over-year increase in earnings and revenue for the quarter ending June 2023. This consensus forecast is crucial for evaluating the company's financial performance. However, the impact of actual results on the near-term price of the stock will depend on how they compare to these estimates.
To evaluate the company's performance, investors will attentively monitor the upcoming earnings report, scheduled for release on August 1. If the main figures exceed expectations, the stock price will rise.
Management's discussion of business conditions during the earnings call will play a crucial role in determining the viability of the immediate pricing change and shaping future earnings expectations. In this regard, understanding the likelihood of a positive EPS surprise can be instructive.
Analyst reports have substantially contributed to the formation of opinions regarding Uber Technologies. On May 3rd, Citigroup increased its price objective for the company from $55.00 to $57.00. Bank of America also projected a positive prognosis, assigning Uber Technologies a "buy" rating. These reports have the potential to influence investor sentiment and the performance of the stock.
Let’s see the future price direction of this stock from the UBER technical analysis:
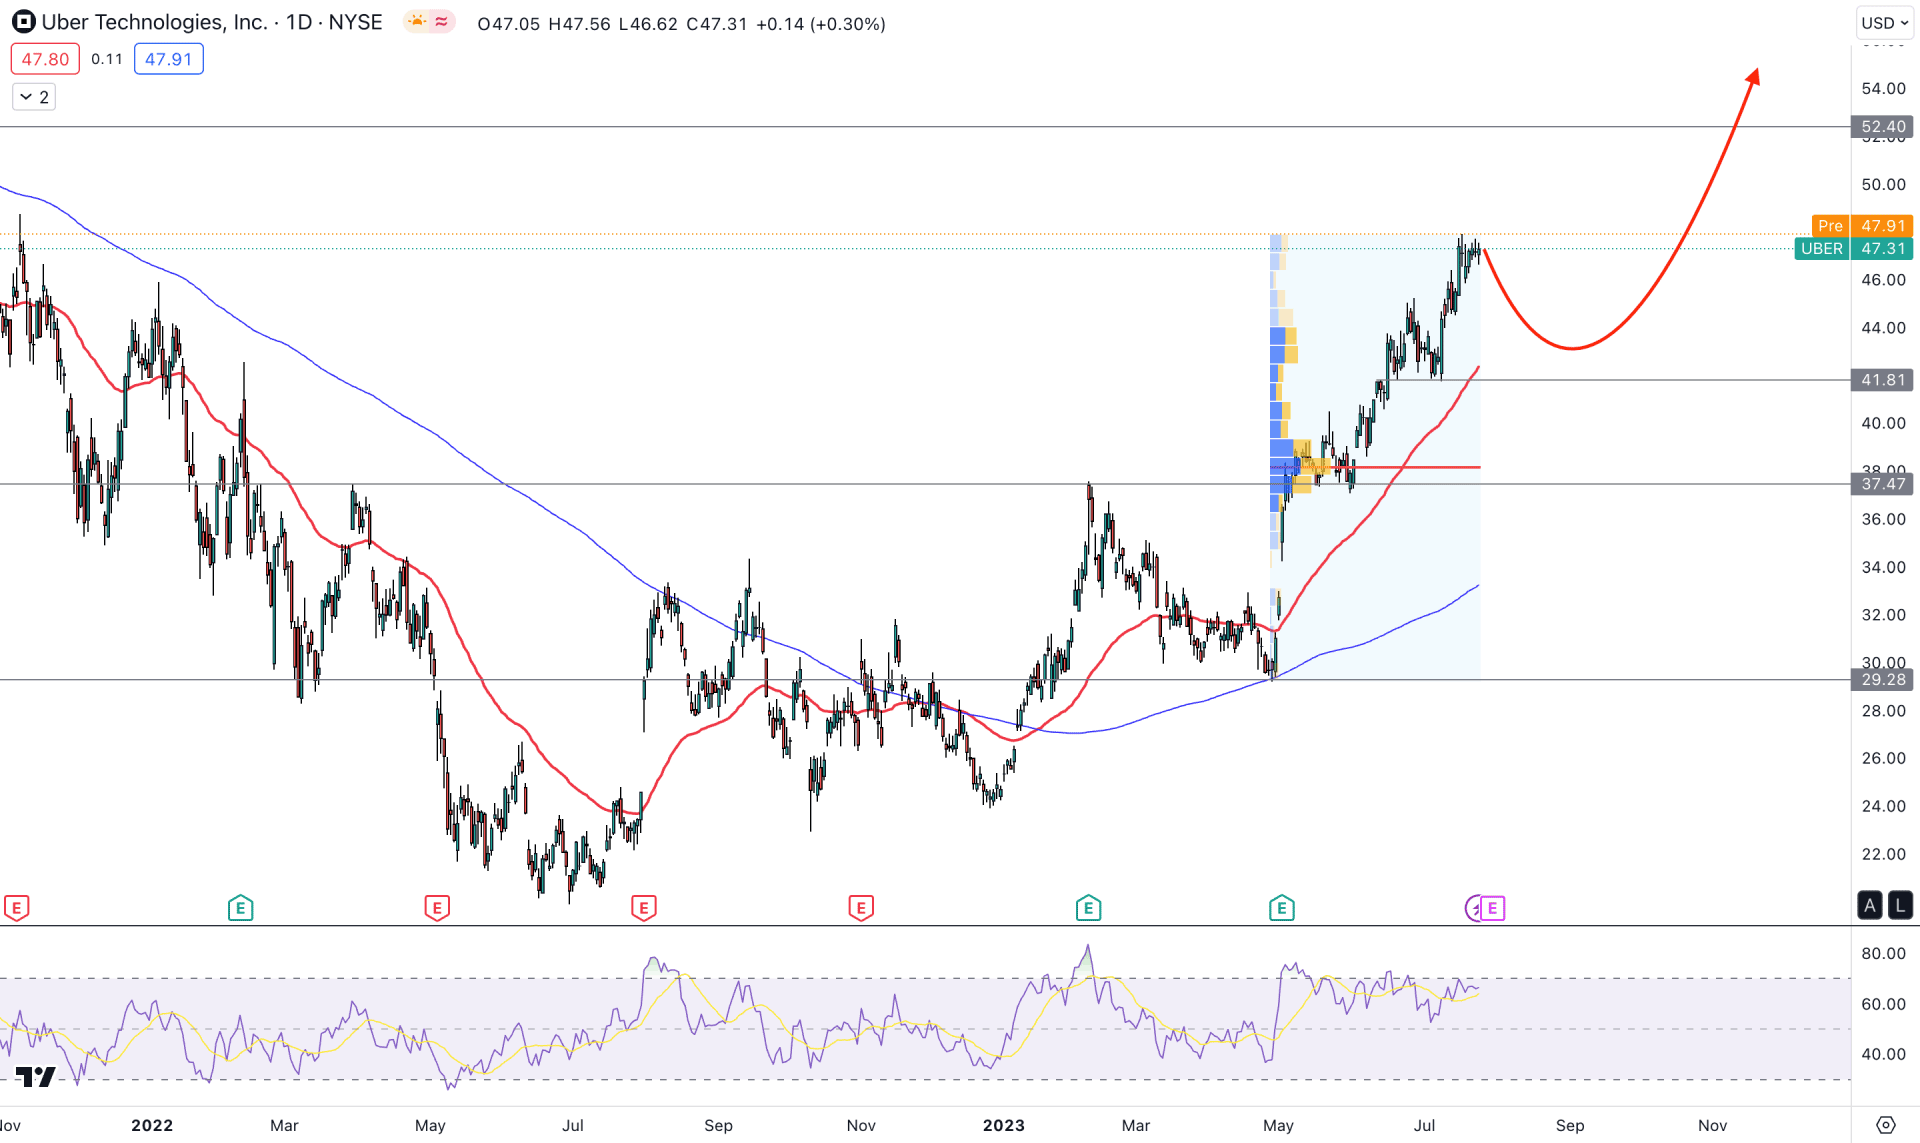
In the daily price of UBER, a strong bullish rebound is seen after setting a bottom at the 19.87 level, from where a new bullish impulsive swing has come. As a result, the primary trading idea of this instrument is to look for a bullish trend continuation strategy, which could provide quick and reliable gains.
In the higher time frame candlestick analysis, the current monthly candle is backed by three consecutive bullish months, which is a sign of a strong trend. A similar structure is visible at the weekly price, where the last three candles show a decent bullish continuation opportunity.
In the daily price, the bullish reversal was initiated from the Golden Cross formation on 18 January 2023, when the 50-day EMA crossed above the 200-day SMA. Later on, the bears tried to regain the momentum by taking the price at the 200 DMA support but failed to hold the momentum. As the current price is trading above the 50 EMA and 200 SMA, any intraday bullish opportunity might provide a higher return.
In the volume structure, the latest upward pressure from the 29.28 low to the 47.95 high shows the highest activity level at the 38.18 level, which is 11.46% down from the current price. Moreover, the current 14-period Relative Strength Index (RSI) has been steady at the 70.00 level for more than a month, which is a sign of a strong buyers’ presence in the market.
Based on the daily outlook, we can expect the UBER price to extend the bullish trend, where the near-term resistance level is at 52.40 level. A bullish recovery above this level could extend the momentum toward the 64.00 high.
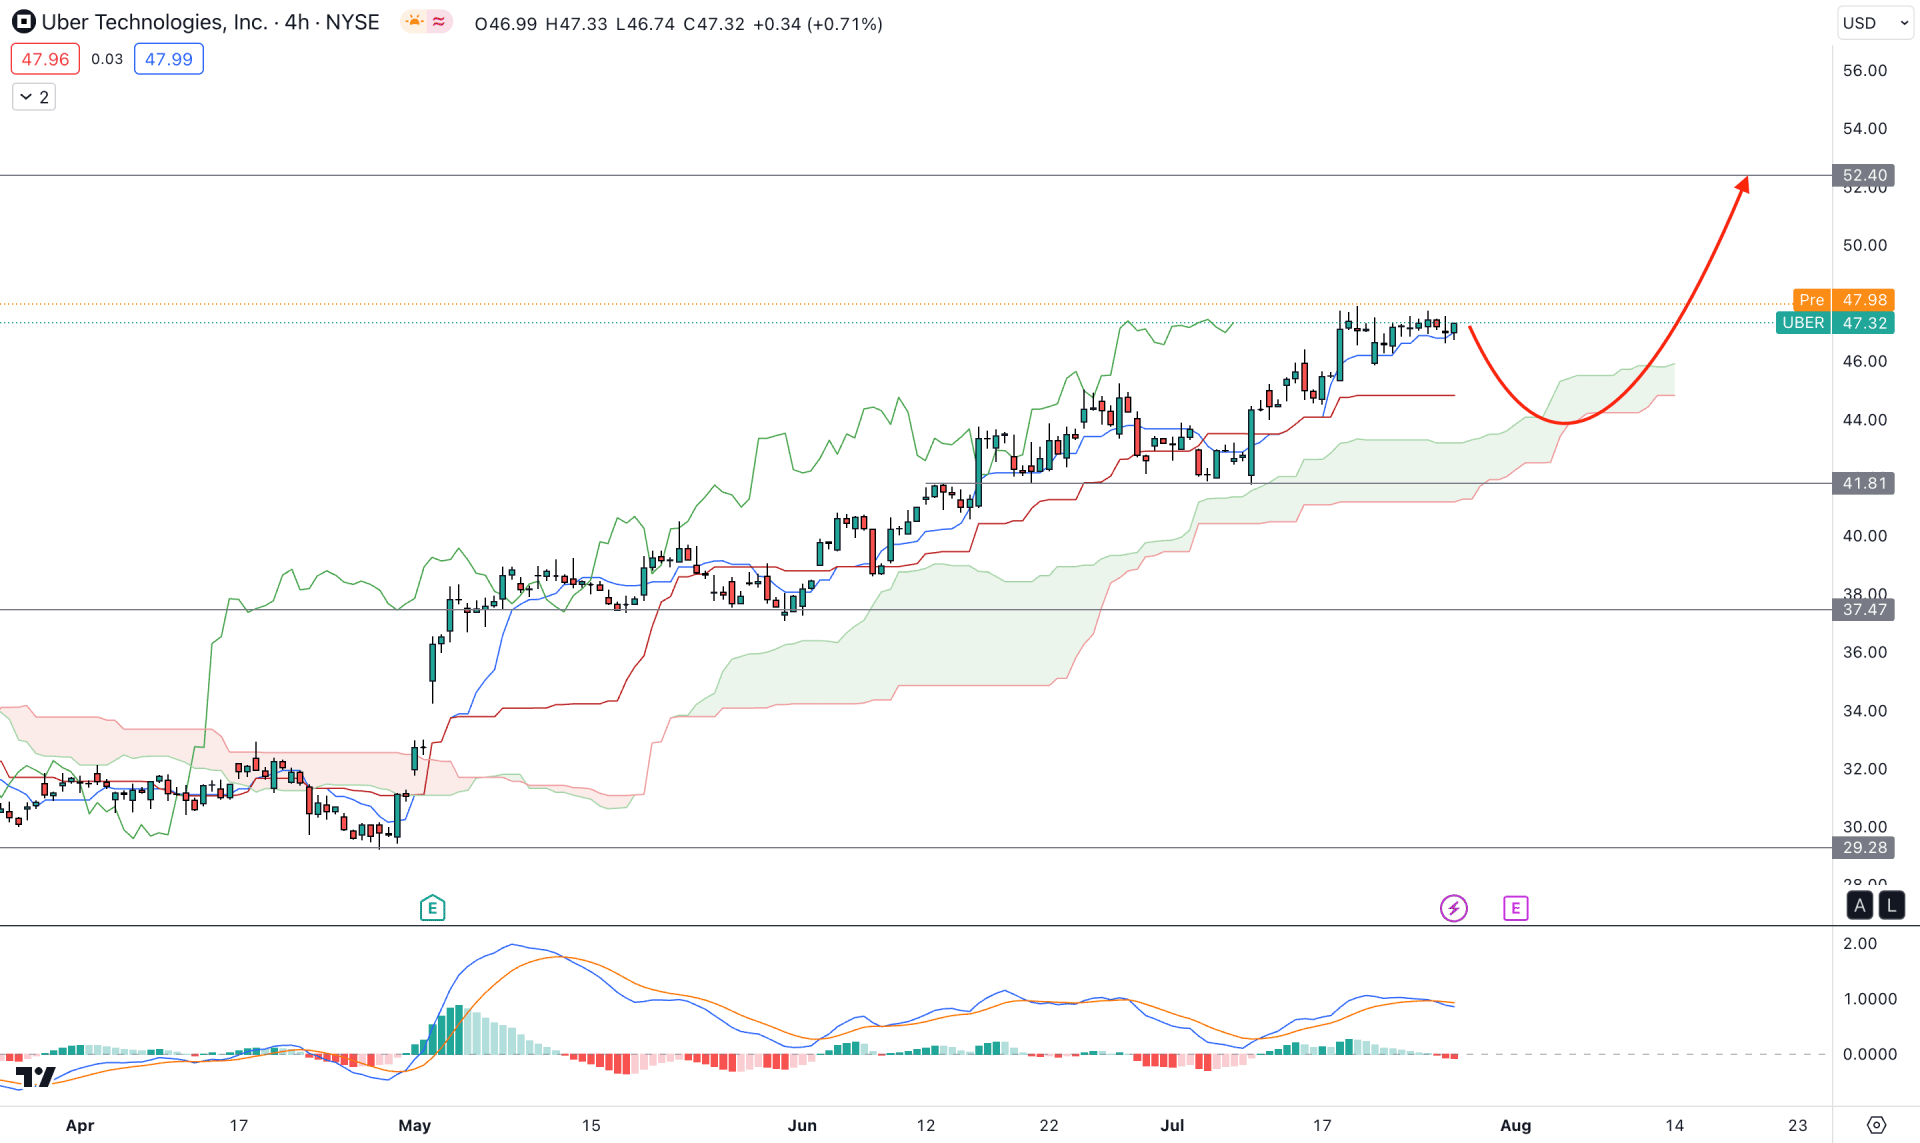
In the H4 timeframe, a clear bullish trend is visible as the current price is aiming higher, with support from the Ichimoku Kumo Cloud.
In the future cloud, the upward pressure is visible as the Senkou Span A is bullish by remaining above the Senkou Span B. Moreover, the dynamic Tenkan Sen is working as an immediate support, while the Kijun Sen is flat.
A bearish crossover is visible at the MACD EMA, which was formed at the overbought area. Also, the current Histogram is below the neutral line, which is a sign of a pending downside correction.
Based on the H4 structure, the broader outlook is bullish but the H4 chart shows a pending downside correction. Therefore, an additional bullish rejection from the Kijun Sen or Cloud zone could be a long opportunity, where the main aim is to test the 52.40 level.
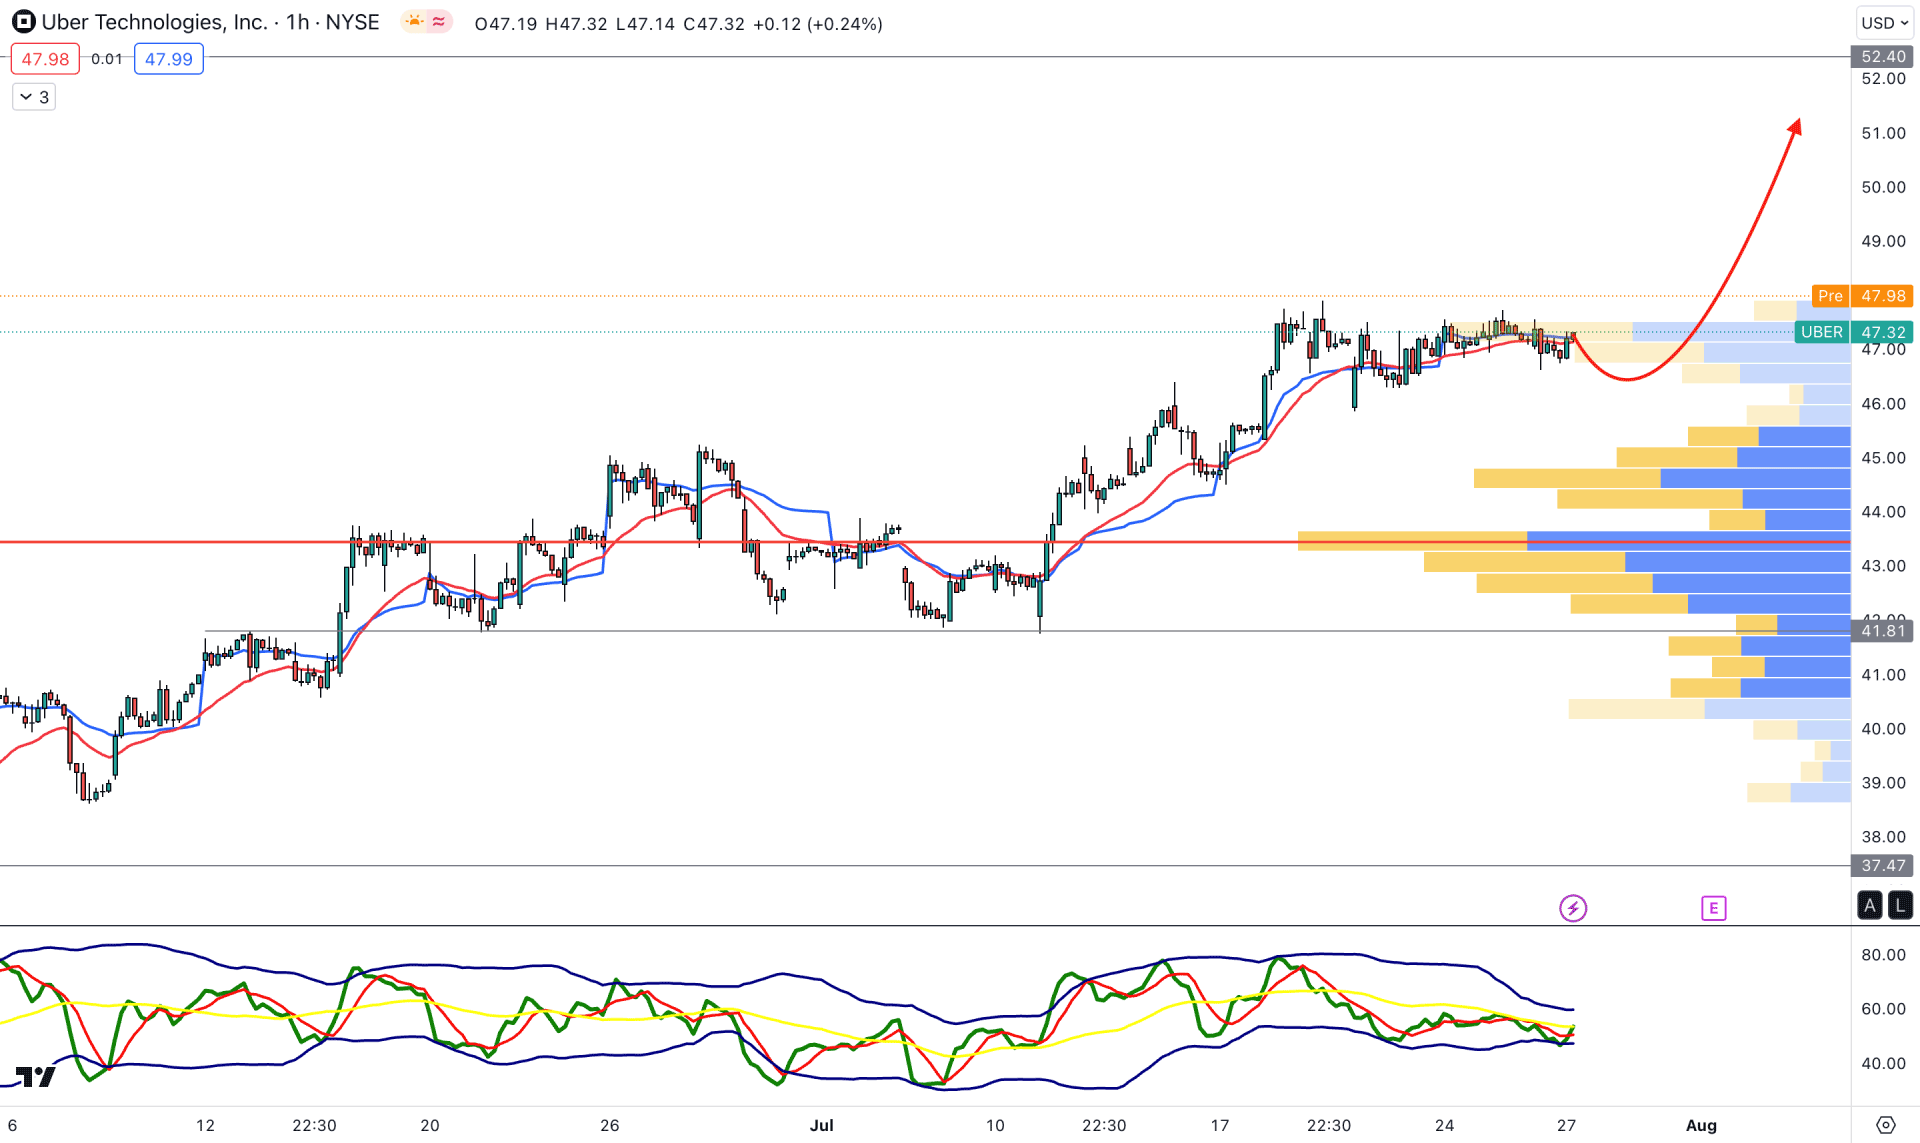
In the hourly chart, the buying pressure is solid as the visible range high volume level is below the current price. Moreover, the price remained sideways after a bullish pressure, where the dynamic 20 EMA is working as immediate support.
A bullish possibility is visible from the TDI indicator, which showed a rebound from the oversold area.
Based on the current market outlook, investors might expect the upward pressure to continue as long as the price remains above the visible range high volume level. However, breaking below the 43.00 level with a bearish H4 candle might alter the current market structure and lower the price in the coming hours.
Based on the current market outlook, UBER is more likely to increase higher in the coming days. Therefore, any bullish rejection from the reliable intraday support level could be a decent way to join the market.


