
Published: January 31st, 2023
Trust Wallet Token (TWT) has recently gained significant attention due to the recent FTX collapse in the cryptocurrency market.
As a result, many investors are turning to TWT as a safe and trustworthy option for the self-custody of their assets. TWT is an ERC20 token issued by Binance, one of the leading global cryptocurrency exchanges. It serves as a reward for participating in Trust Wallet services such as staking or using its decentralized applications.
It also functions as a currency within the Binance ecosystem and offers benefits such as discounted trading fees, bonuses, and other incentives to holders. These advantages have made TWT a popular choice among investors seeking to optimize their returns.
416,649,900 TWT are in circulation, representing 42% of the total supply. Moreover, there was a 28% price surge seen in the previous week, while the current price is still trading within a corrective pressure.
The broader crypto market will face a challenge from the upcoming FOMC, where a 25 bps rate hike could make the US Dollar even stronger.
Should you buy Trust Wallet Token (TWT) now? Let’s see the future price direction from the TWT/USDT technical analysis:
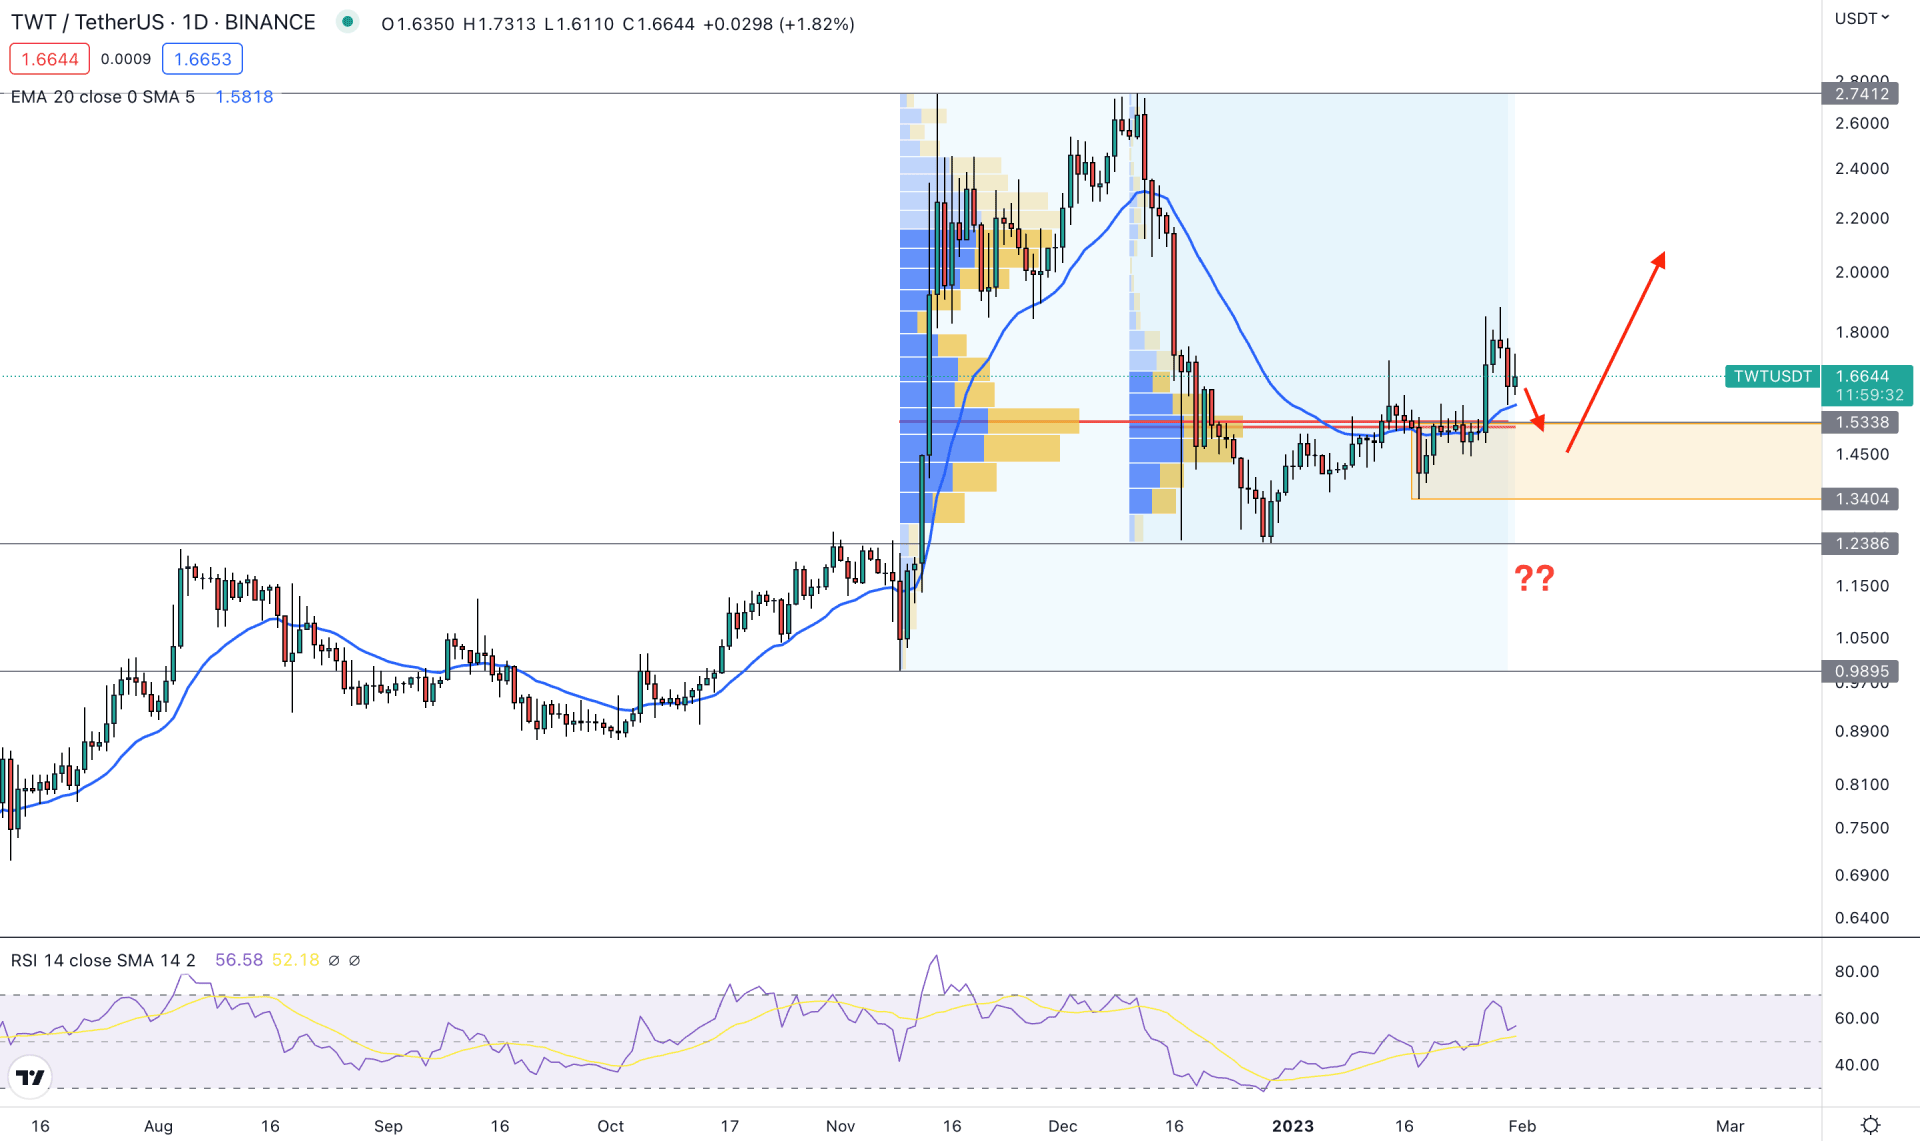
In the daily price, the current buying momentum is still valid as the recent price made significantly higher highs in the broader context.
If we look at the weekly chart, we can see the recent weekly candle closed bullish and managed to make a new swing high at the 1.8826 level. After the weekly bullish close, the current price is trading within the body, whereas a bullish takeover above the previous weekly open could increase buying pressure in this instrument.
If you look at the daily tradable range, the buy-side liquidity is present above the 2.7412 double top level. On the downside, an immediate bearish pressure and recovery from the 0.9895 swing low came with strong bullish momentum.
In that case, investors should closely monitor the near-term price action and identify buying opportunities where the ultimate target is to take the price above the double top level and grab the buy-side liquidity.
The interesting fact about this instrument is its recent high volume levels. The most active level from November to January is spotted at 1.5360 to level. Another higher volume level from the December high to the January low is spotted at the 1.5189 level. As these levels are very close together, we can consider that institutional investors have a strong interest in the demand zone from 1.5338 to 1.3404. Therefore, if the price comes to the demand zone and shows a significant bullish rejection, it can offer a decent buying opportunity.
In the main chart, the dynamic 20 EMA is below the price and working as an immediate support level. The Relative Strength Index (RSI) is still strong above the 50% area, whereas a bullish rebound could extend it above the 70% level.
Based on the daily outlook, the first buying attempt may come with a bullish rejection from the 1.5338 static support level. However, the ultimate buying possibility is valid as long as the price trades above the 1.2386 level, targeting the 2.7412 double-top pattern. Below the 1.2386 level, the next support level is at the 0.9895 area.
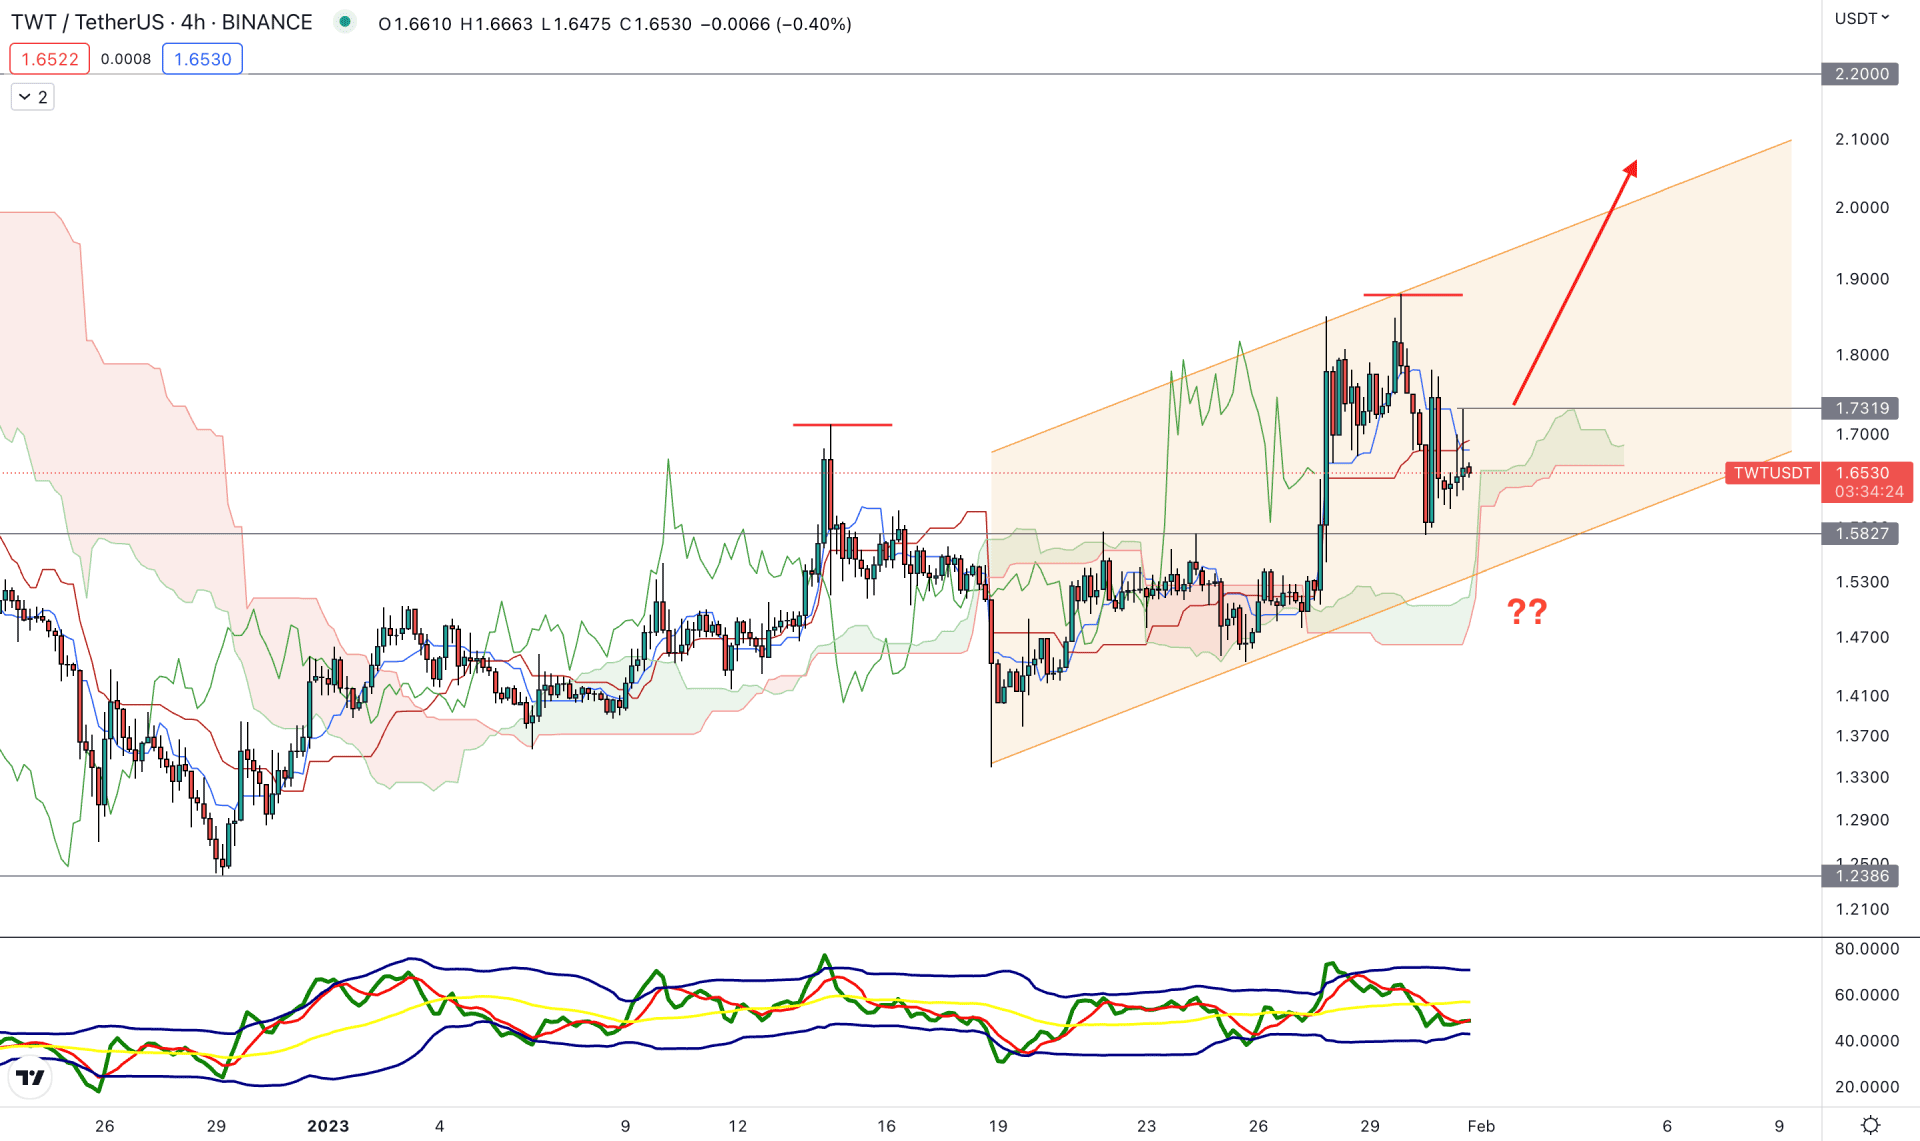
In the H4 timeframe, the buying possibility is potent as the price increases above the Ichimoku Kumo Cloud zone. Moreover, the Senkou Span A is above B in the future cloud while the current price is volatile at the Cloud Support.
In the Traders’ Dynamic Index, the current TDI level faces corrective pressure below the 50% level. Therefore, a rebound from the lower band and a recovery above the 50% level would be a confluence support to bulls.
Based on the current h4 outlook, a strong bullish recovery with an H4 close above the 1.7319 swing high would validate the buy signal, targeting the 2.1000 area.
The alternative trading approach is to wait for the price to come below the 1.5400 level, increasing the possibility of reaching the 1.2386 support level.
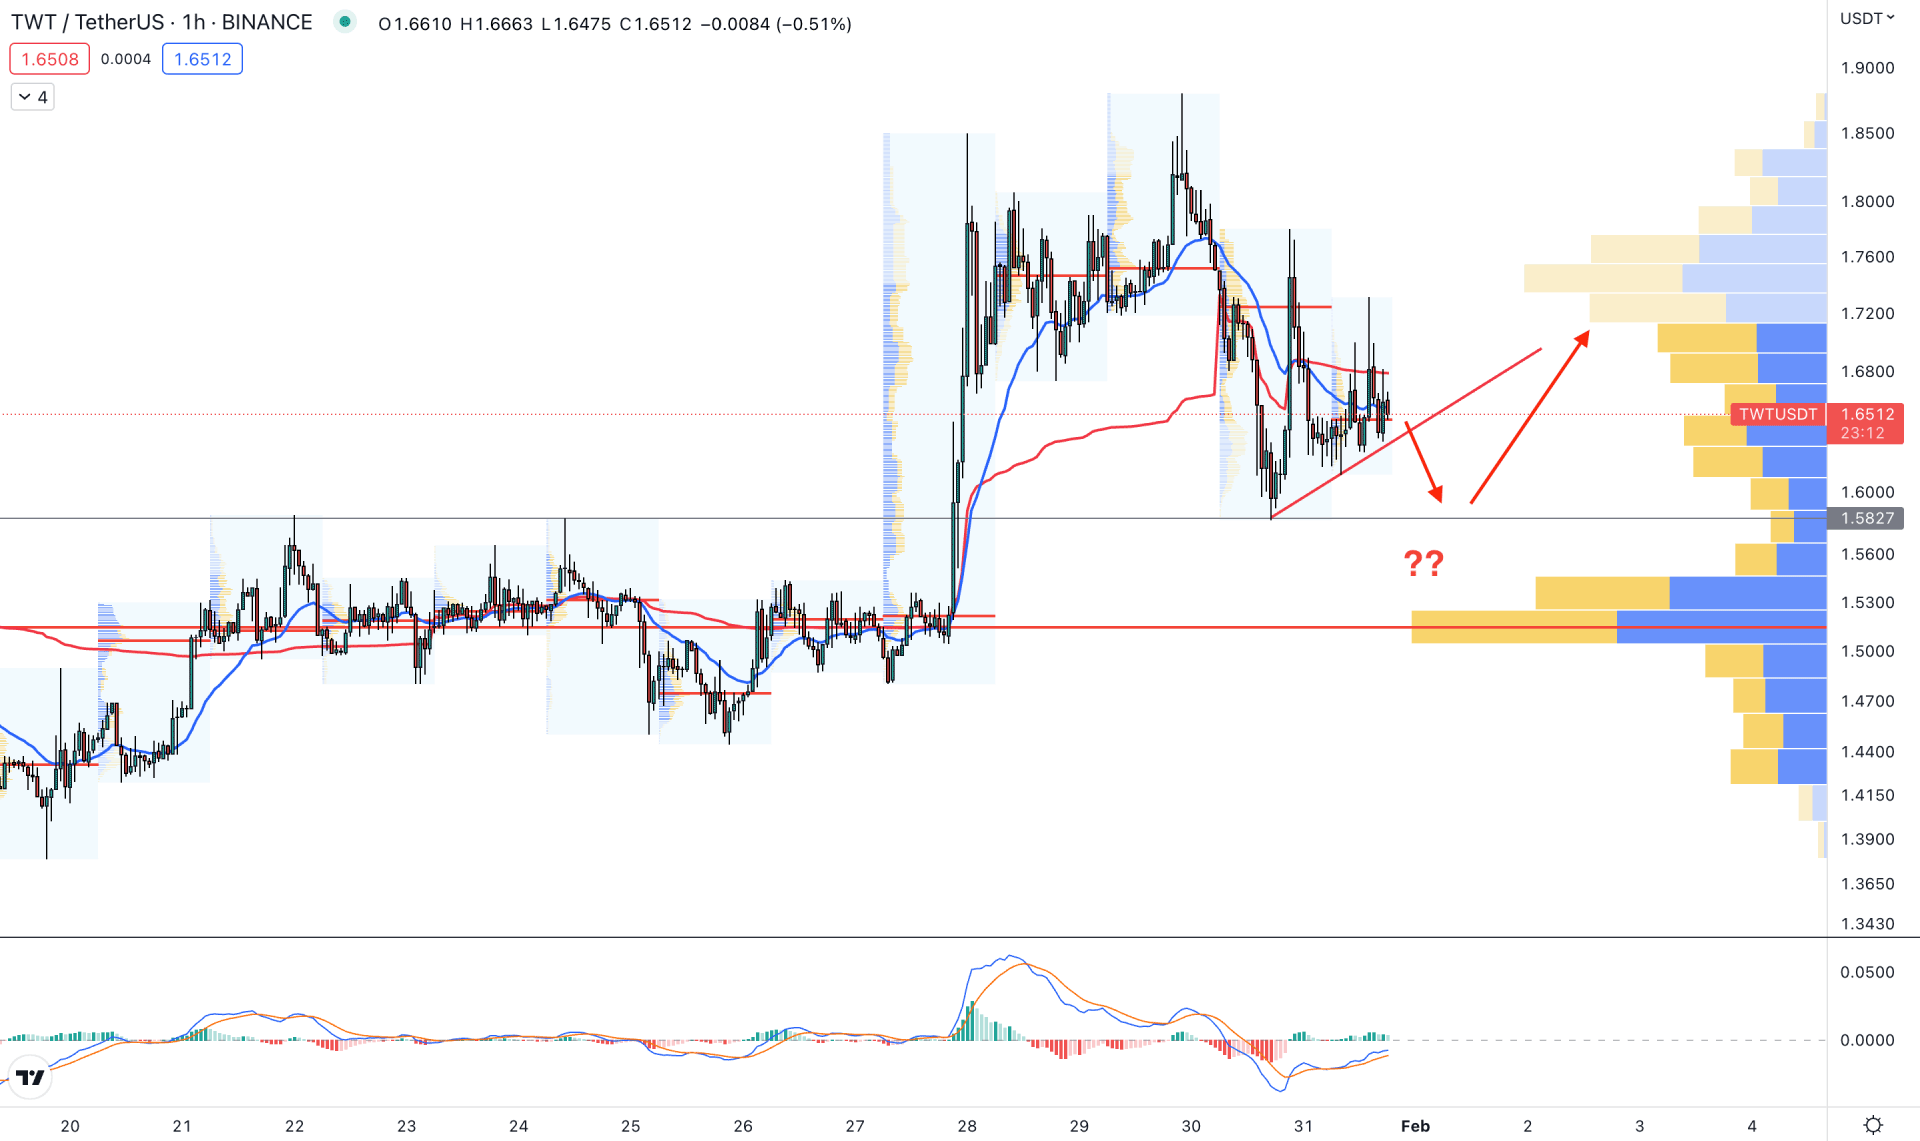
In the hourly time frame, the current price action is very volatile. However, the Visible Range High Volume level is at 1.5292 levels, which is below the current price.
Therefore a valid bullish recovery from the near-term support level could open a buying possibility as long as it remains above the high volume level.
In the recent price, the dynamic 20 EMA and weekly VWAP are closer and above the current price. Moreover, the price is trading by creating an ascending trendline, where bearish pressure below this level is potent.
Based on the hourly price structure, investors should wait for the price to drop below the trendline and form a bullish rejection. The first buying attempt could be found at the 1.5827 support level. However, breaking below the 1.5100 level could eliminate the possibility and lower the price to the 1.4200 level.
Based on the current multi-timeframe analysis, the bullish possibility is potent for this instrument, but a valid recovery from the current correction is needed.
Moreover, the upcoming trading days are going to be volatile due to the FOMC meeting and Non-farm payroll, where a rate hike by the Fed and a hawkish tone could be an alarming sign for crypto bulls.


