
Published: March 9th, 2022
TRON is a blockchain-based system that aims to expand the technology among retail users. The core strength of this channel is its transaction speed. The Bitcoin ecosystem can handle a maximum of six transactions per second, while the Ethereum supports up to 25. However, in TRON, people can make more than 2000 transactions per second, which is a bigger milestone in the crypto sector.
On the other hand, this platform is the best option for content creators where earning rewards after sharing content is possible. Besides, it is one of the famous networks for building DApps. Content creators can connect their audiences through the TRON network that includes streaming, app stores and music sites. Therefore, the digitalization of the entertainment sector with the TRON network is likely to expand even if the global economy faces any pressure.
TRXUSD have lost 60% of its value from the November 2021 peak where the current ground at at 0.0550 level with an increase in volume would be a buying indicator for this token. Let’s see the upcoming price direction from the TRXUSDT technical analysis:
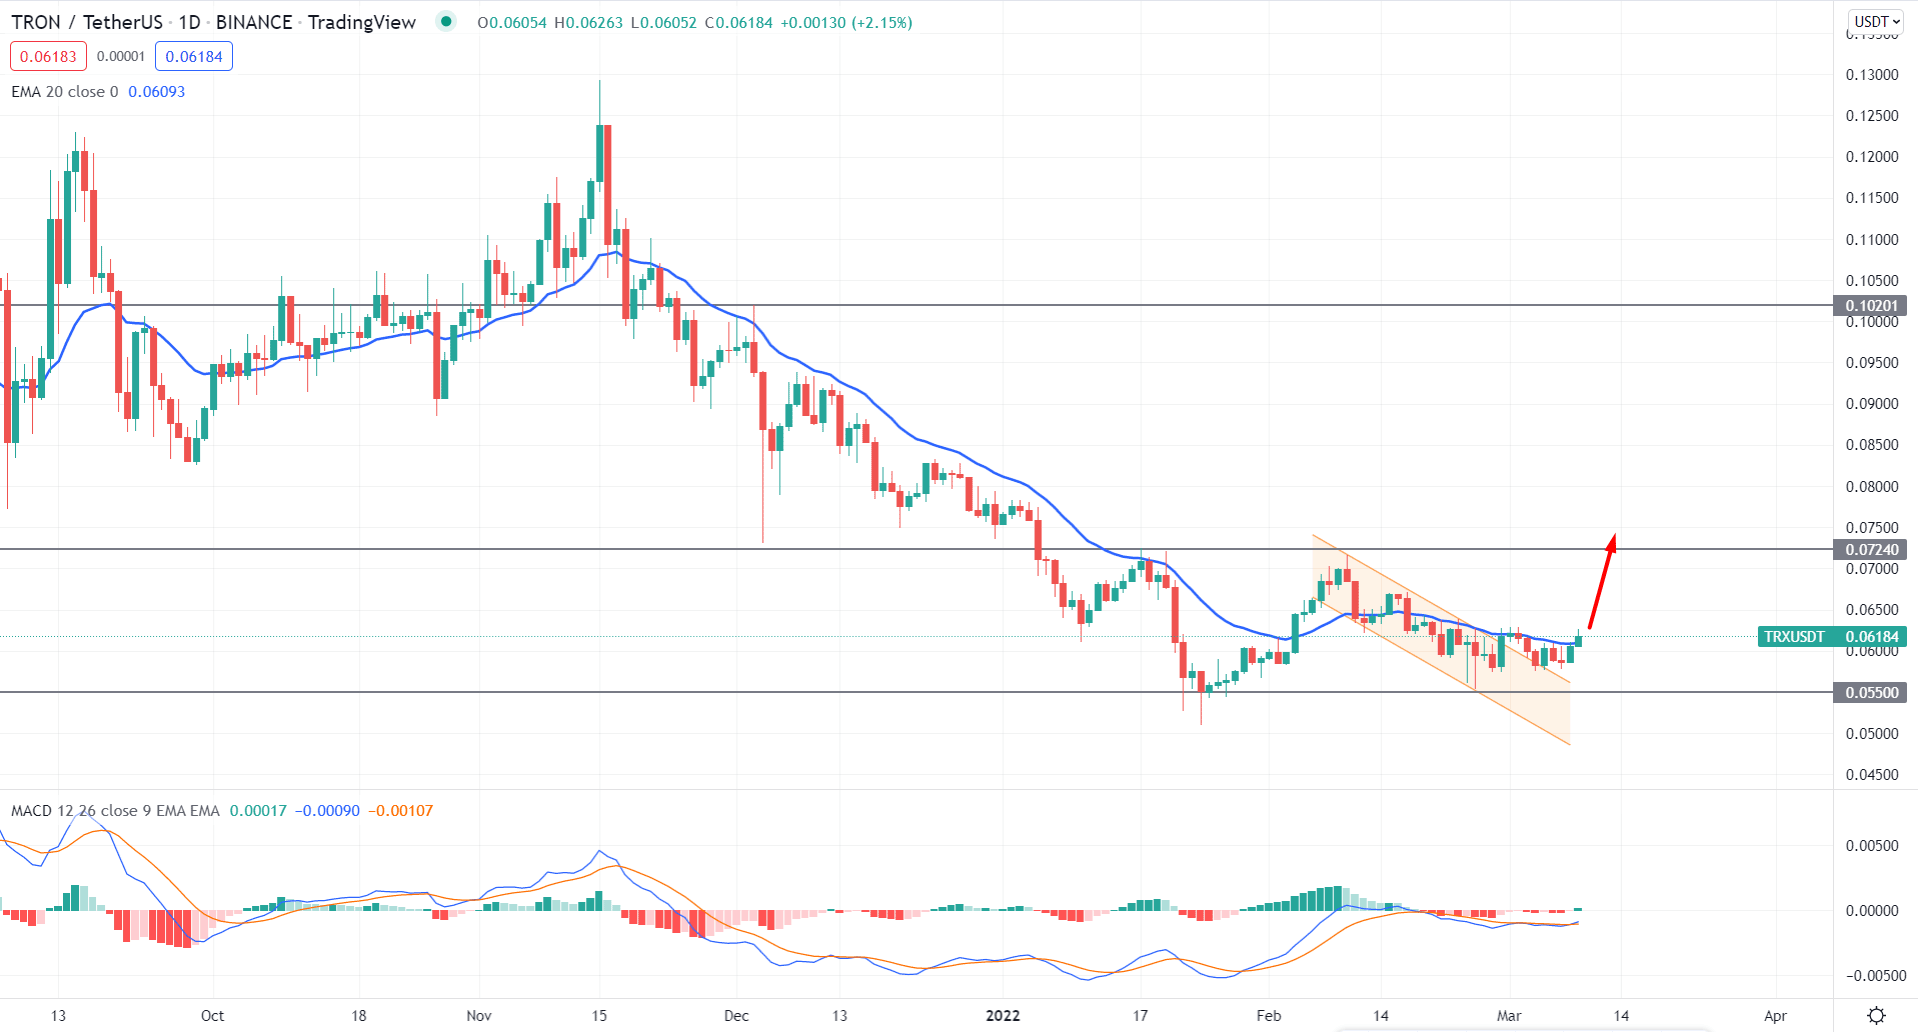
In the TRXUSDT daily chart, the price moved lower with an intense selling pressure where the dynamic 20 EMA worked as a barrier for months. However, bears started to struggle after reaching the 0.0550 level with bullish exhaustion. After two months of struggle, the price showed a violation of the dynamic level in February, while to most recent price formed a pre-breakout structure.
The above image shows how the price showed a bearish channel breakout after the bears, failure to test the 0.0550 level. Although the price remained in line with the dynamic 20 EMA, it failed to make a new lower low. In the indicator window, the MACD Histogram turned bullish in the indicator window while the MACD line started to move up.
Based on the current price structure, a bullish daily close above the dynamic 20 EMA is more likely to extend the buying pressure towards the 0.0724 resistance level. However, investors should closely monitor how the price trades above the 0.0550 level, where any bearish daily close below this line would eliminate the bullish structure.
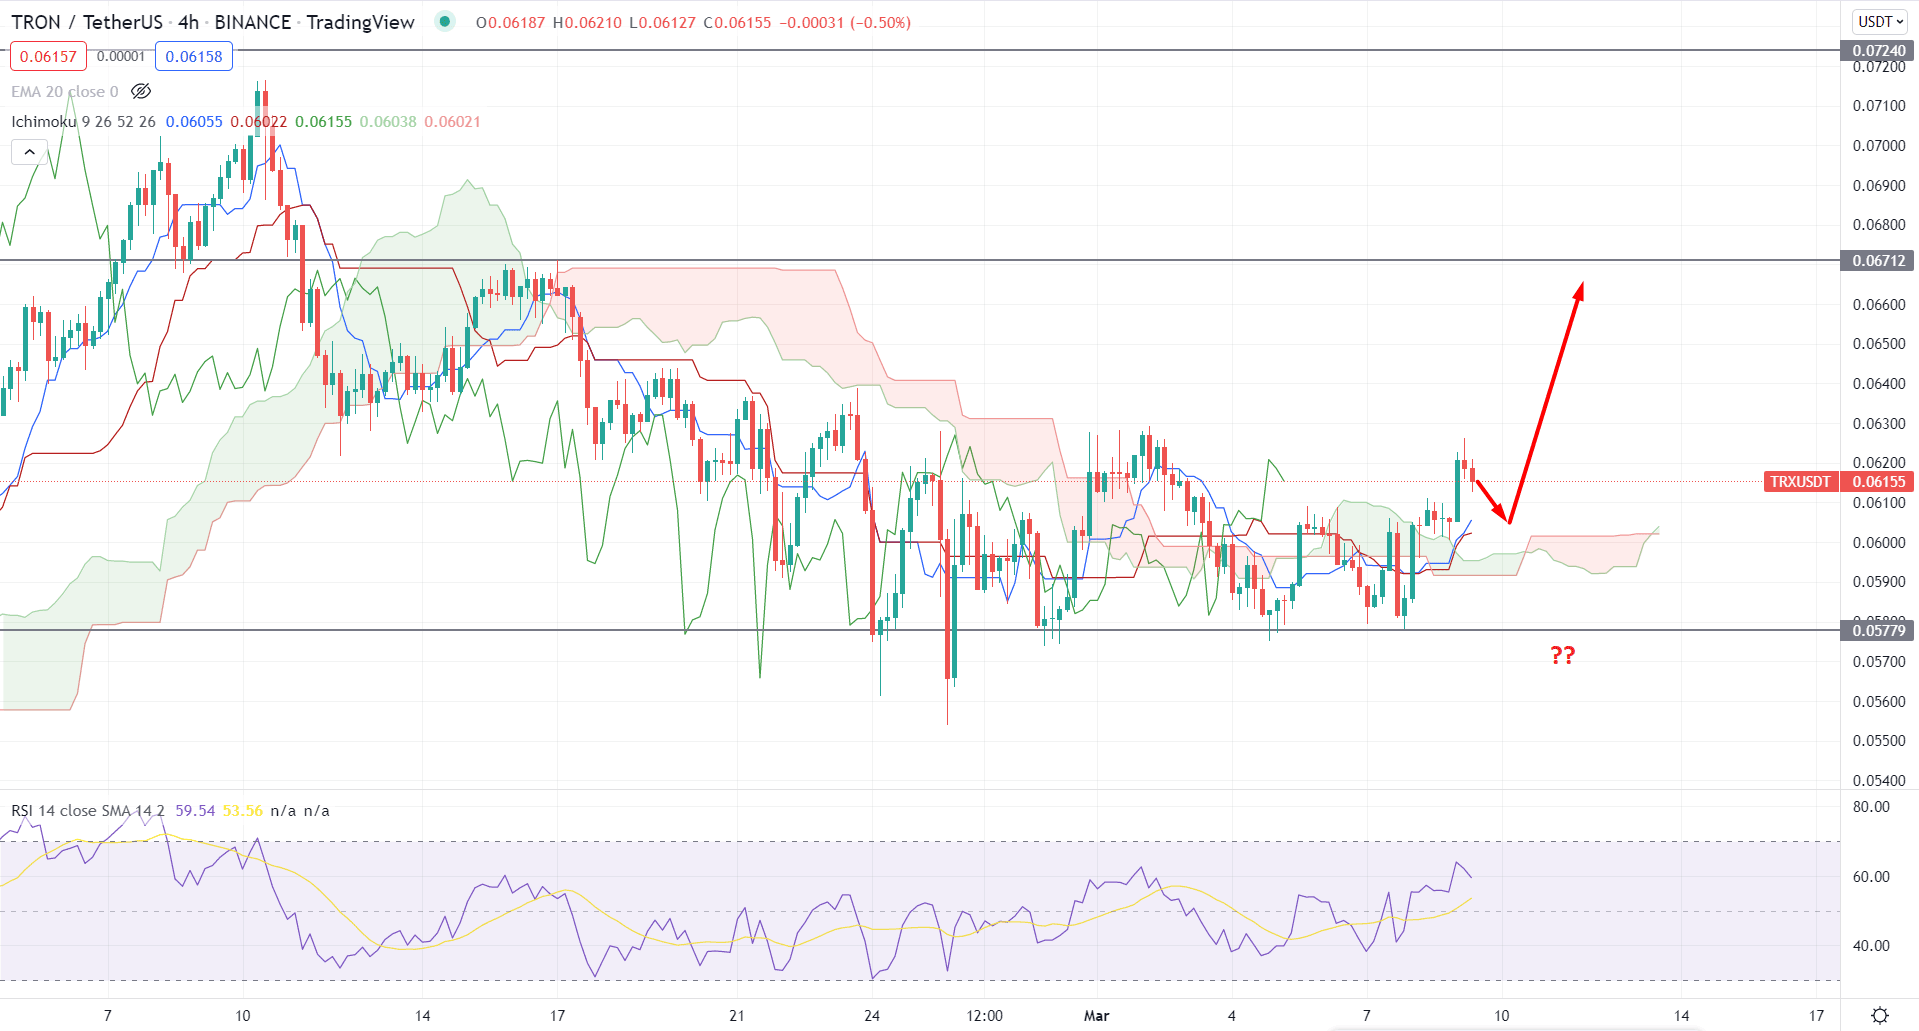
In the H4 timeframe, TRXUSDT shifted its trend from bearish to bullish after failing to break below the 0.0577 static support level. Moreover, the bullish H4 candle above the Kumo Cloud with the formation in future cloud is a sign the bulls may extend the price higher after a consolidation.
The above image shows how the price moved above the Kumo Cloud and dynamic Kijun Sen, indicating that bulls have gained momentum after a long consolidation. On the other hand, the RSI moved above the 50 level and aimed to test the overbought 70 area. The buying pressure from dynamic Kijun Sen and bullish RSI are signs of a possible buying pressure in the price where the primary target would be towards the 0.0671 swing high. On the other hand, a break below the Cloud support with a bearish H4 candle below the 0.0577 static support level would eliminate the current bullish structure and lower the price towards the 0.0510 level.
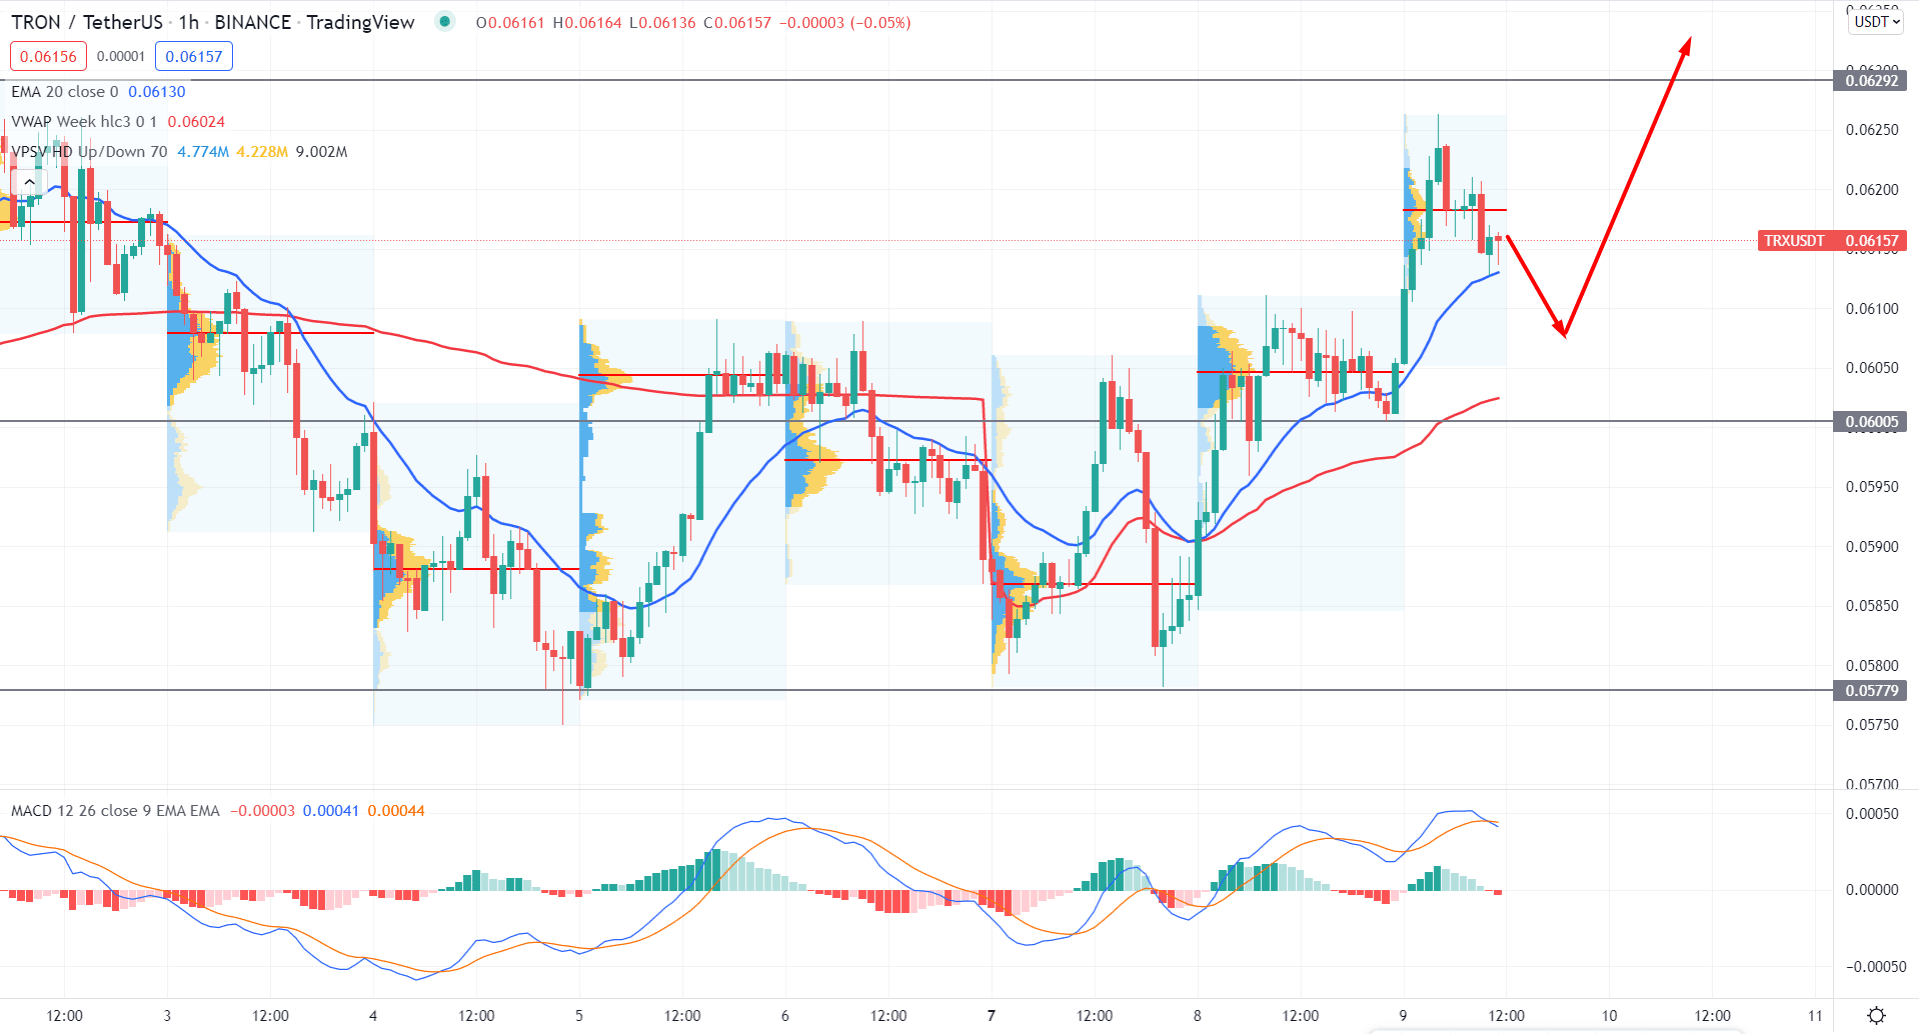
In the intraday chart, TRXUSDT is trading within a bullish momentum as the new higher highs formed in the intraday high volume level that pushed the price above the dynamic 20 EMA. Although the price struggled to hold the bullish momentum above the 0.0618 intraday high volume level, any buying pressure from dynamic weekly VWAP would increase the buying pressure.
The above image shows how the price made a new higher high in the intraday chart with a stable position above the 0.0600 key support level. The buying pressure was influenced by the MACD line while Histogram remained corrective at the neutral zero level.
Based on the H1 price action, investors should find buying opportunities from 0.6130 to 0.6100 area. Any bullish rejection with a H1 close above the dynamic 20 EMA might extend the current bullish trend towards the 0.7000 area. A break below the 0.6100 might need a HODLing approach to find another buying opportunity.
Based on the current multi-timeframe analysis, the buying pressure in TRXUSDT chart is solid even if the broader crypto market remained volatile due to the war-driven sentiment. Besides, finding buying opportunities from the intraday chart, investors should follow what is happening on crypto large caps where a bullish pressure in BTCUSDT above 40,000.00 level would be a strong bullish factor from TRX.