
Published: February 11th, 2026
Even as competitors like Solana and up-and-coming chains vied for market share, TRON maintained its position as the dominant stablecoin settlement platform in the second half of 2025.
Due to the growth of USDT, coupled with USDD and TUSD, the number of monthly current stablecoin users increased 38% to more than 10 million, while availability increased 41%.
With a 50% increase from January, network activity surged back, surpassing 300 million transactions every month for the first time since mid-2023 and reaching about 20 million accounts with activity by December.
The fact that more than half of the accounts dealt in stablecoins highlights TRON's payments-first focus as opposed to the memecoin craze on Solana or BNB Chain. The native token, TRX, increased 26% year over year, with most of the gains occurring in Q2 and Q3 due to ecosystem momentum.
Prior to a Q4 market decline that brought totals down, staking revenue reached around $900 million in Q3; in H2, Solana took the lead in burn revenue. Amid TRX volatility, DeFi TVL gained 15% but fell outside the top five, giving way to Base and BNB.
Let's see the further outlook of this coin from the TRX/USDT technical analysis:
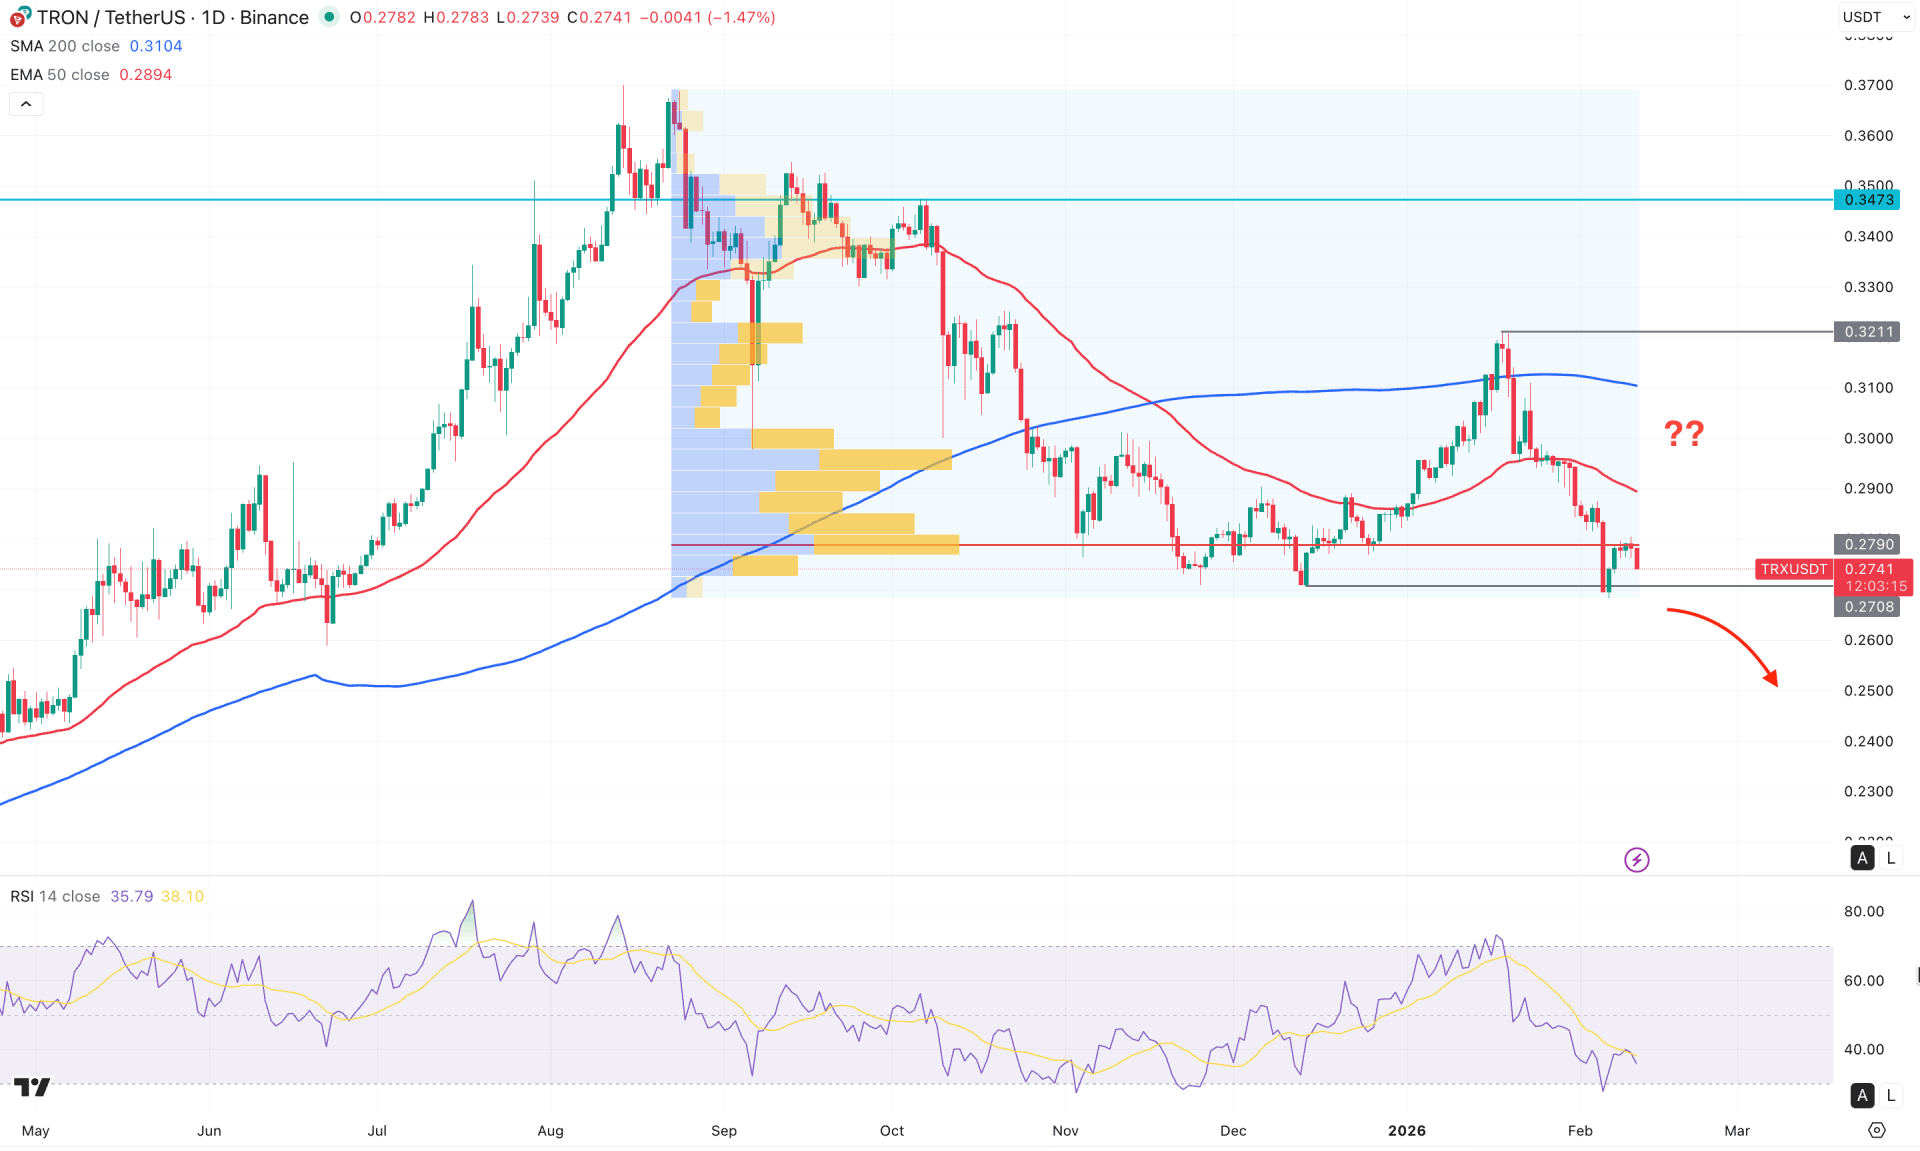
In the daily chart of TRX/USDT, the recent price action shows extended selling pressure from the 0.3211 peak, creating a bearish opportunity. However, the most recent price has reached the crucial support level, where more confirmation is needed before validating the short opportunity.
In the higher timeframe, the price is trading within a selling pressure as the most recent price has formed a bearish inside bar breakout. Moreover, the current price is hovering at a crucial monthly resistance level, where a valid breach could trigger a free fall.
The weekly timeframe shows the same outlook, where an immediate bearish recovery is pending from the 0.3200 area.
In terms of volume, a bearish redistribution phase is underway, as the largest activity level since July 2025 has shifted to 0.2790, just above the current price. As long as the high volume line remains above the current price, the main aim would be to take short trades only,
In the main price chart, the market trend has shifted from bullish to bearish as the price failed to hold the buying pressure above the dynamic 200-day SMA line. An immediate downside recovery with a stable price below the 50-day EMA could increase the bearish possibility at any time.
In the secondary indicator window, the Relative Strength Index (RSI) has rebounded from the 70.00 overbought level. As the current line is hovering below the 50.00 neutral level, more selling pressure in the main price could come.
Based on the daily market structure, TRX/USDT is trading within a bearish trend, and recent selling pressure at the high-volume resistance could offer a decent short opportunity. In this context, a break below the 0.2700 level, with a daily close, could increase selling pressure toward the 0.2300 area.
On the other hand, the current price is trading at a historic low, from where a sufficient liquidity grab is possible. A failure to hold the price below the 0.2790 level, with an immediate bullish rebound, could limit the loss at any time. In that case, a short-term bullback is possible towards the 0.3000 area. A stable price above the 0.3000 area could initiate the bullish rebound targeting the 0.3473 area.
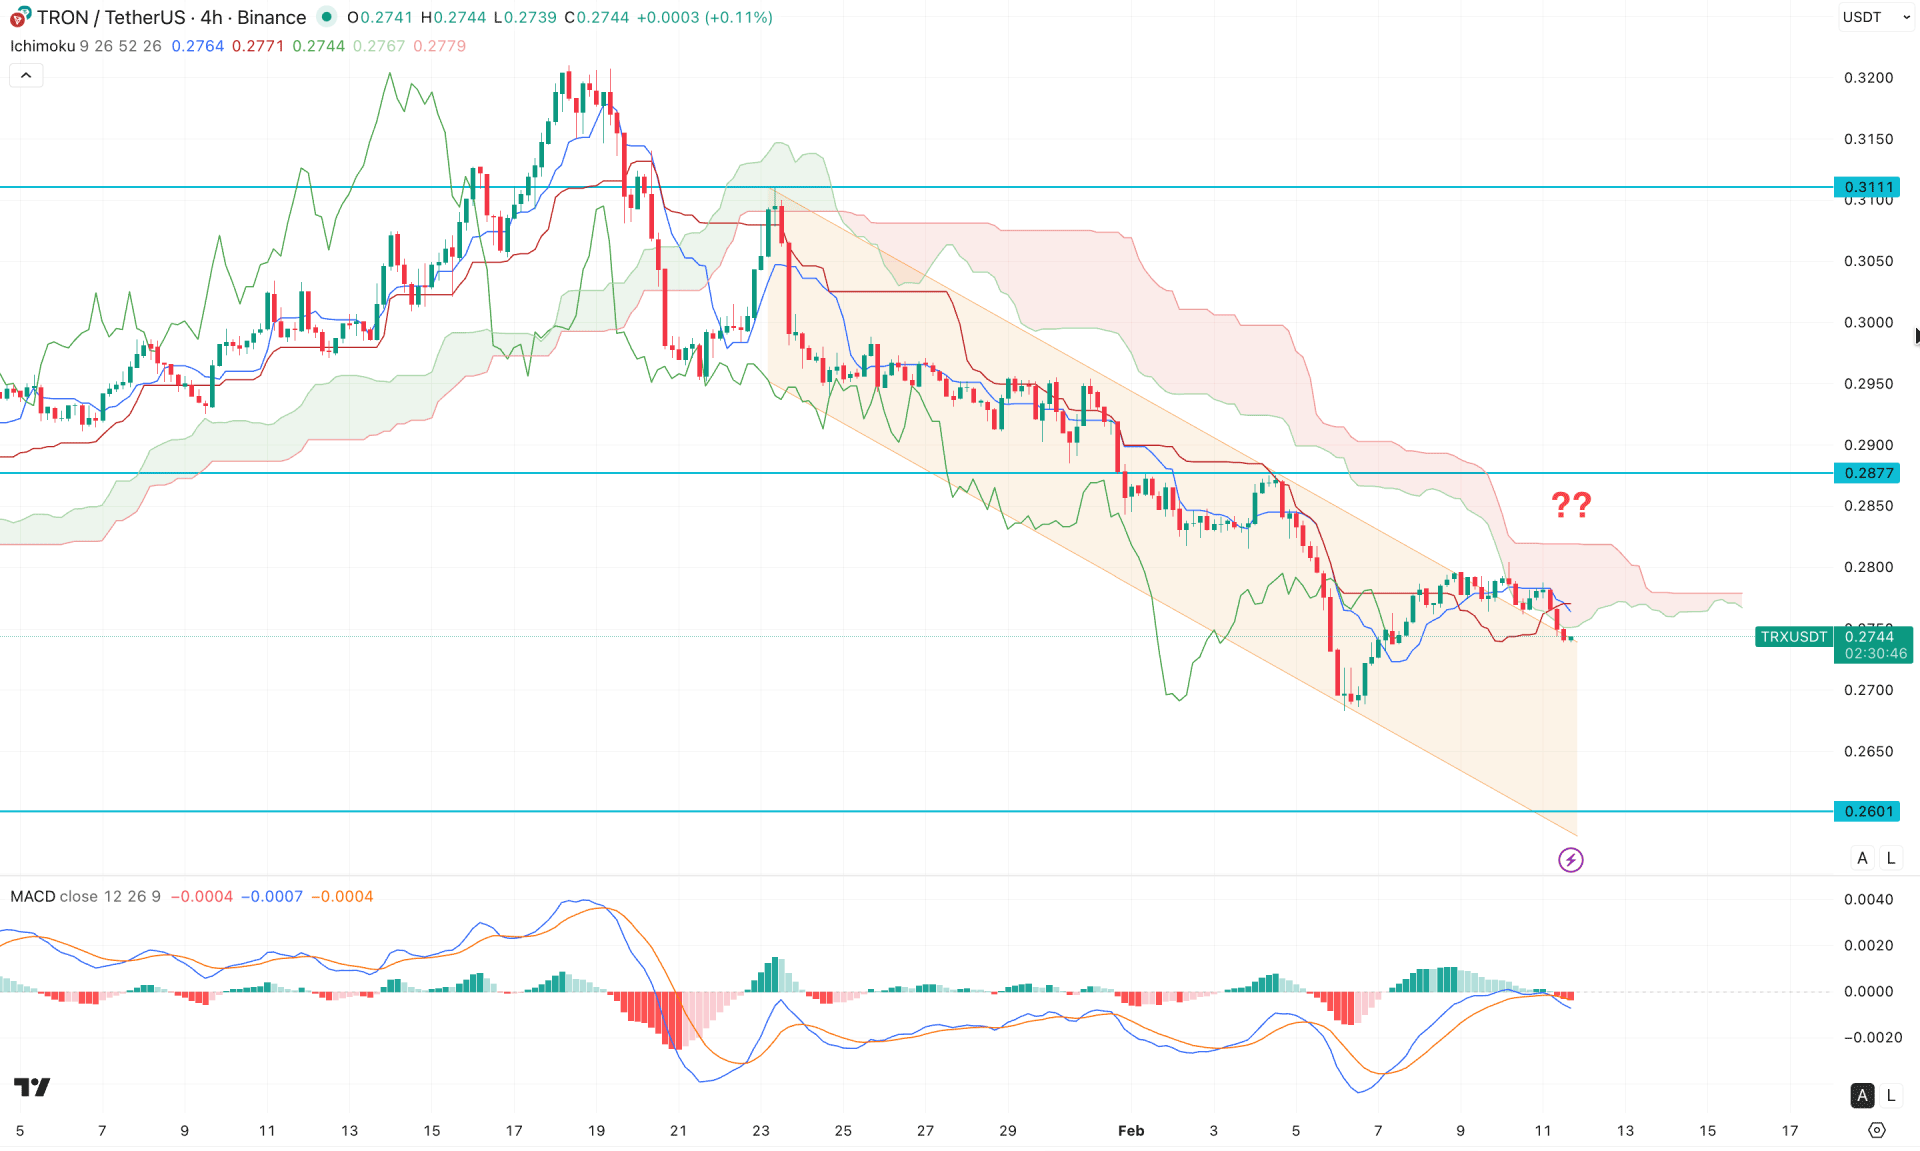
In the 4-hour timeframe, the current price is trading within a descending channel, while the major structure remains varied below the Kuma cloud area.
In the future, both lines are heading downward, signalling a possible bearish continuation. Moreover, a bearish 4-hour candle close is present below the Kijun Sen resistance, which could boost selling pressure at any time.
In the secondary indicator window, the MACD histogram is strongly below the neutral line, with a bearish slope of the signal line. This is a sign of ongoing selling pressure in the market, in line with the major structure.
Based on this market outlook, a descending channel extension is possible, where the ultimate aim would be to test the 0.2601 support level.
On the other hand, an immediate bullish reversal above the cloud area with a stable price above the 0.2800 level would eliminate the bearish possibility. In that case, the price is more likely to make a new swing high above the 0.2877 level in the coming hours.
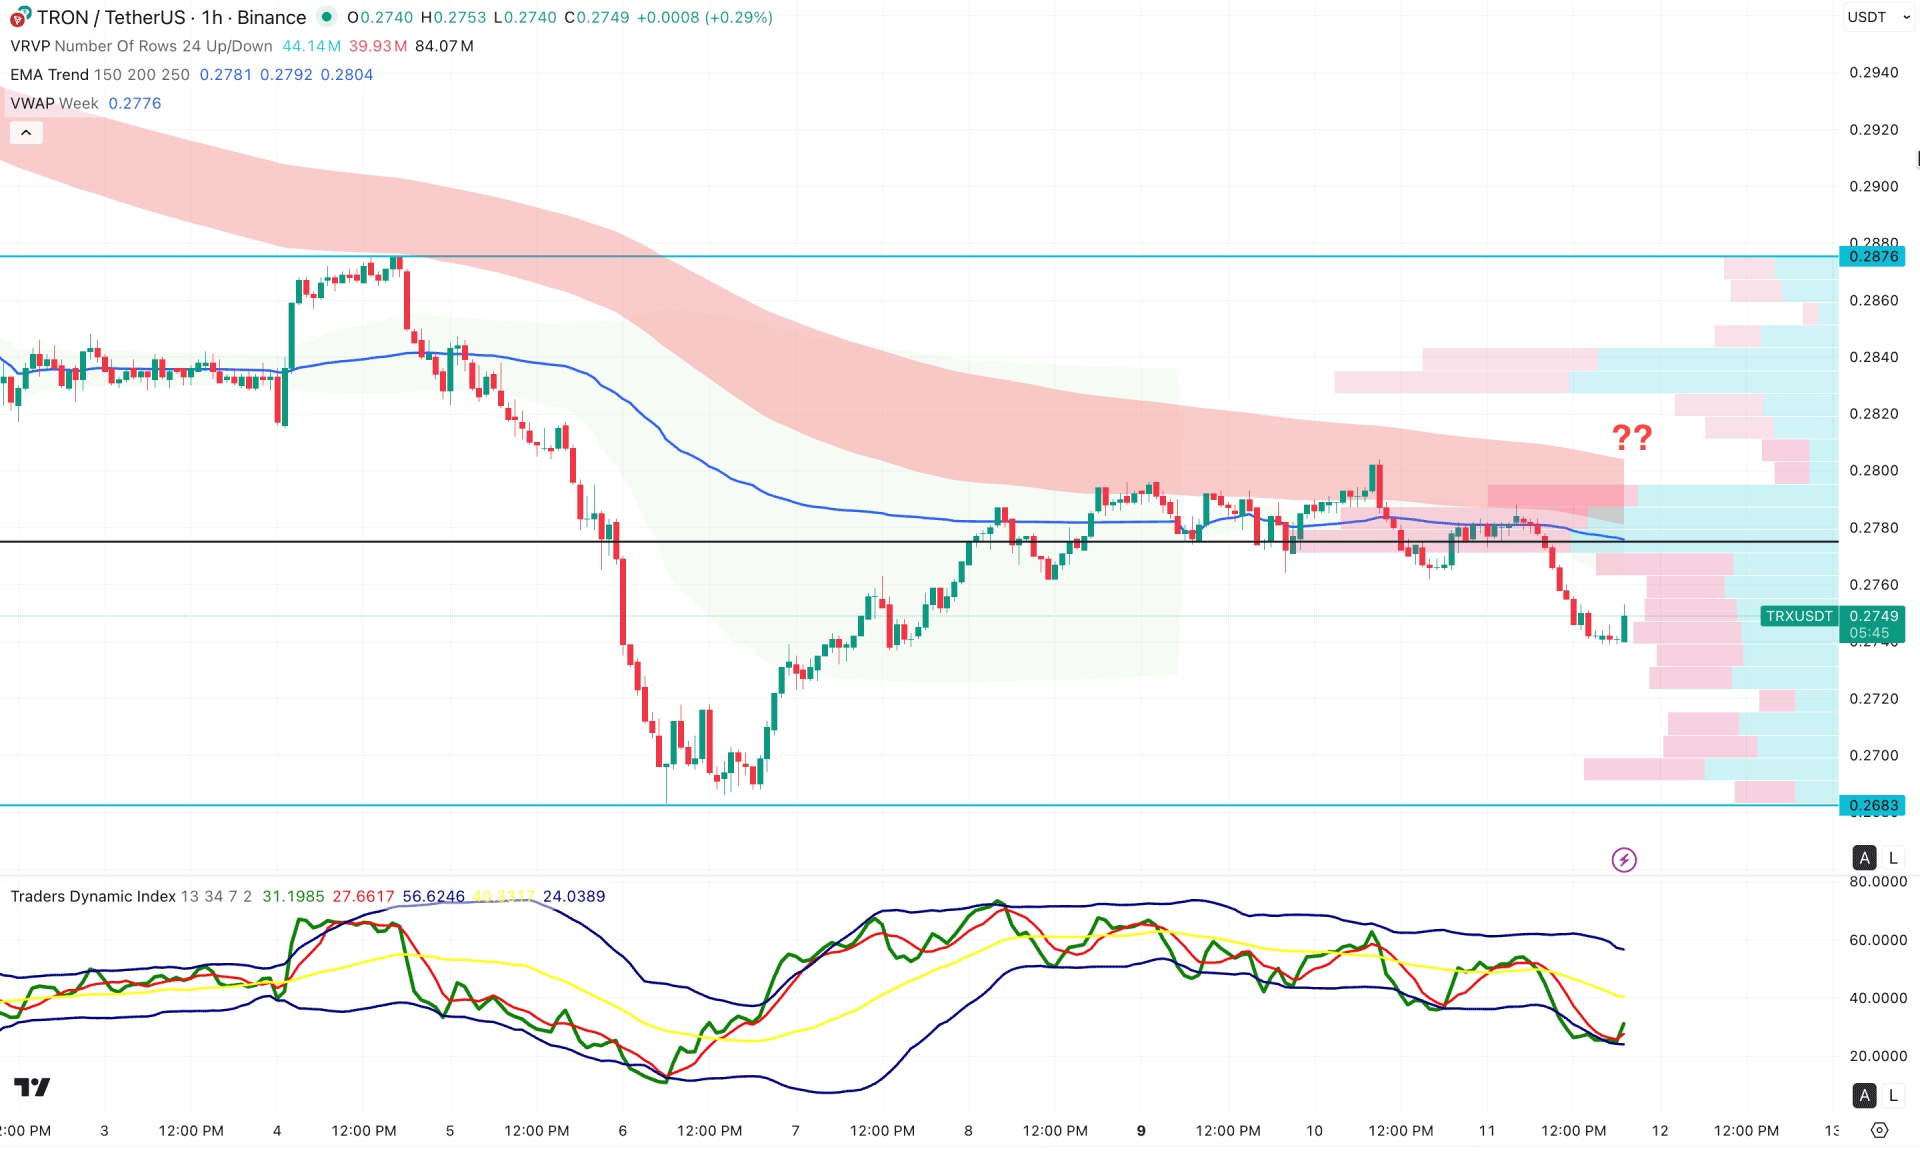
In the hourly timeframe, the most recent price is trading below the intraday high-volume line, signalling intraday bearish pressure. The weekly VWAP line is above the current price and has a bearish slope, following the momentum from the exponential moving average wave. As long as both lines continue to act as resistance, investors should closely monitor price action before opening any long positions.
In the indicator window, the Traders' Dynamic Index has reached the lower peak area, signalling an extreme selling condition in the underlying price. Moreover, the gap between the current price and the dynamic VWAP level has widened, suggesting a possible bullish correction as a mean-reversion trade.
Based on this outlook, the main aim for this pair remains with the sellers, with the ultimate goal being a test of the 0.2683 support level. On the other hand, an immediate bullish reversal with the price holding above 0.2800 could eliminate the bearish opportunity and extend buying pressure toward 0.2876.
Based on the overall market structure, TRX/USDT is more likely to face continued selling pressure following the broader crypto market's struggles. As the intraday price is at the bottom, investors should wait for a decent bullish correction before opening any short position.


