
Published: February 16th, 2023
2023 has come with a blessing to the Tron (TRX) network, as the price already showed a 42% increase from the 6 January low. Moreover, bulls are still strong in this token, with no sign of sellers' presence in recent days.
TRON (TRX) is a blockchain project launched in 2017 by Justin Sun, which uses the TRX token to enable the trading of various chains' products and services on its decentralized platform.
A key use of the TRON (TRX) network is to monetize user-generated content with no fees charged to creators. The platform's permissionless protocols enable content producers and developers to distribute their work freely without centralized control.
Smart contracts on TRON (TRX) allow for the creation and launching of dApps for different purposes, including gaming, exchanges, and open lending systems. The growth of TRON (TRX) shows potential for the project, providing a robust and efficient platform for generating income from DeFi projects.
Is the bull run strong for the Tron (TRX) price? Let’s see the upcoming price direction from the TRX/USDT technical analysis:
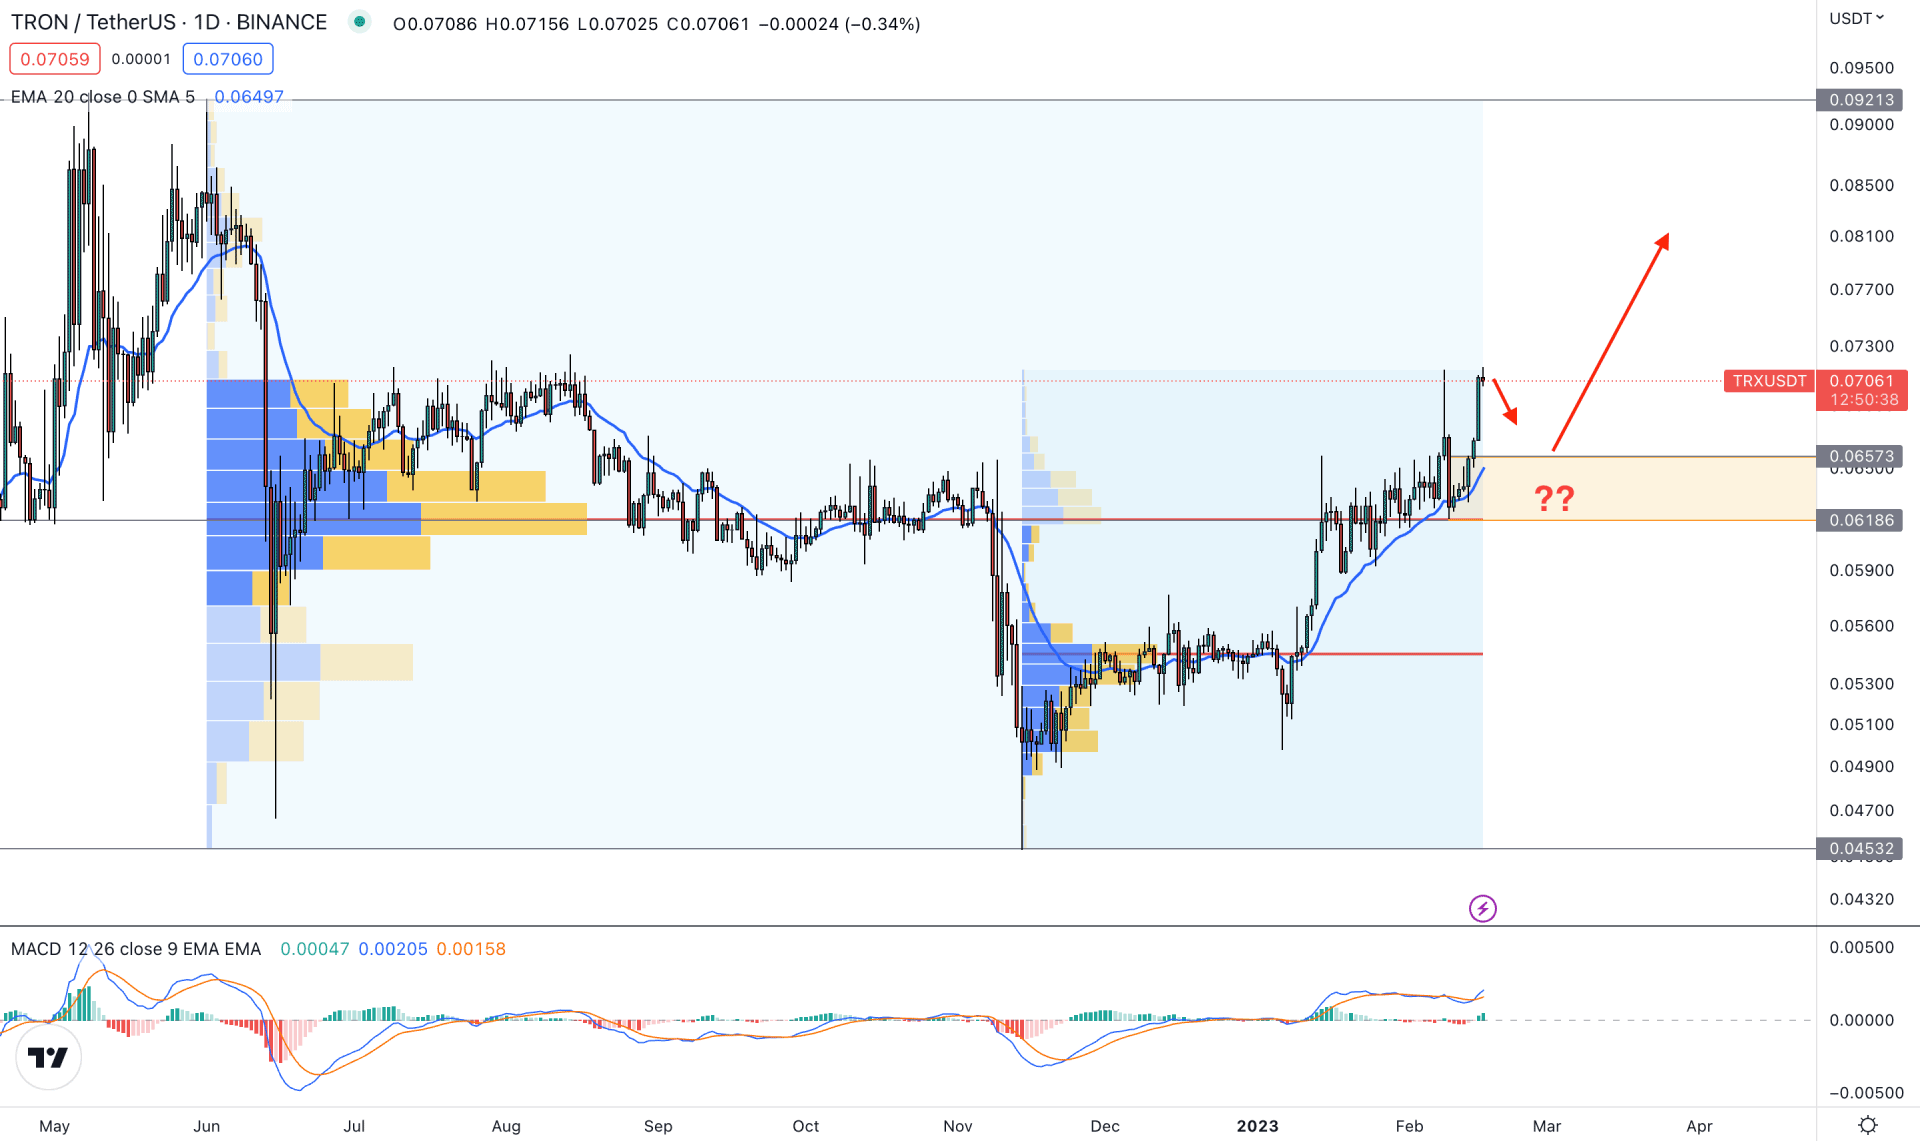
In the daily price, TRX/USDT formed a solid bottom at 0.0453 level, from where a strong buying pressure came with an impulsive counter momentum. Later on, the price went corrective and formed another higher low before validating the bullish trend. As the current price is trading above multiple static support levels, bulls may extend their presence soon.
It is important to identify the current tradable range where the 0.0498 level would be the valid bottom from where a bullish Quasimodo pattern has appeared. On the upside, strong downside pressure is visible from the 0.0921 level, which will be the top of the range. Although the current price is trading at the premium zone, the buying pressure is still strong.
The main price chart shows a strong buying pressure from the 0.0657 to 0.0618 zone, which is a valid demand zone. The dynamic 20 DMA is carrying the price, where a minor dynamic correction is pending.
In the indicator window, the MACD Histogram is above the neutral zone with a bullish momentum from MACD EMA’s. Moreover, a bullish crossover is seen among EMA’s, which is signaling further upside momentum in the price.
Based on the current price structure, the bullish momentum can extend if a downside correction and bullish rejection appear from the 0.0657 to 0.0618 zone. In that case, the primary price target would be towards the 0.0900 level.
On the other hand, a bearish break with a daily close below the 0.0600 level would eliminate the current bullish structure at any time. In that case, further selling pressure may come, where the ultimate target is to reach the 0.0544 high volume level.
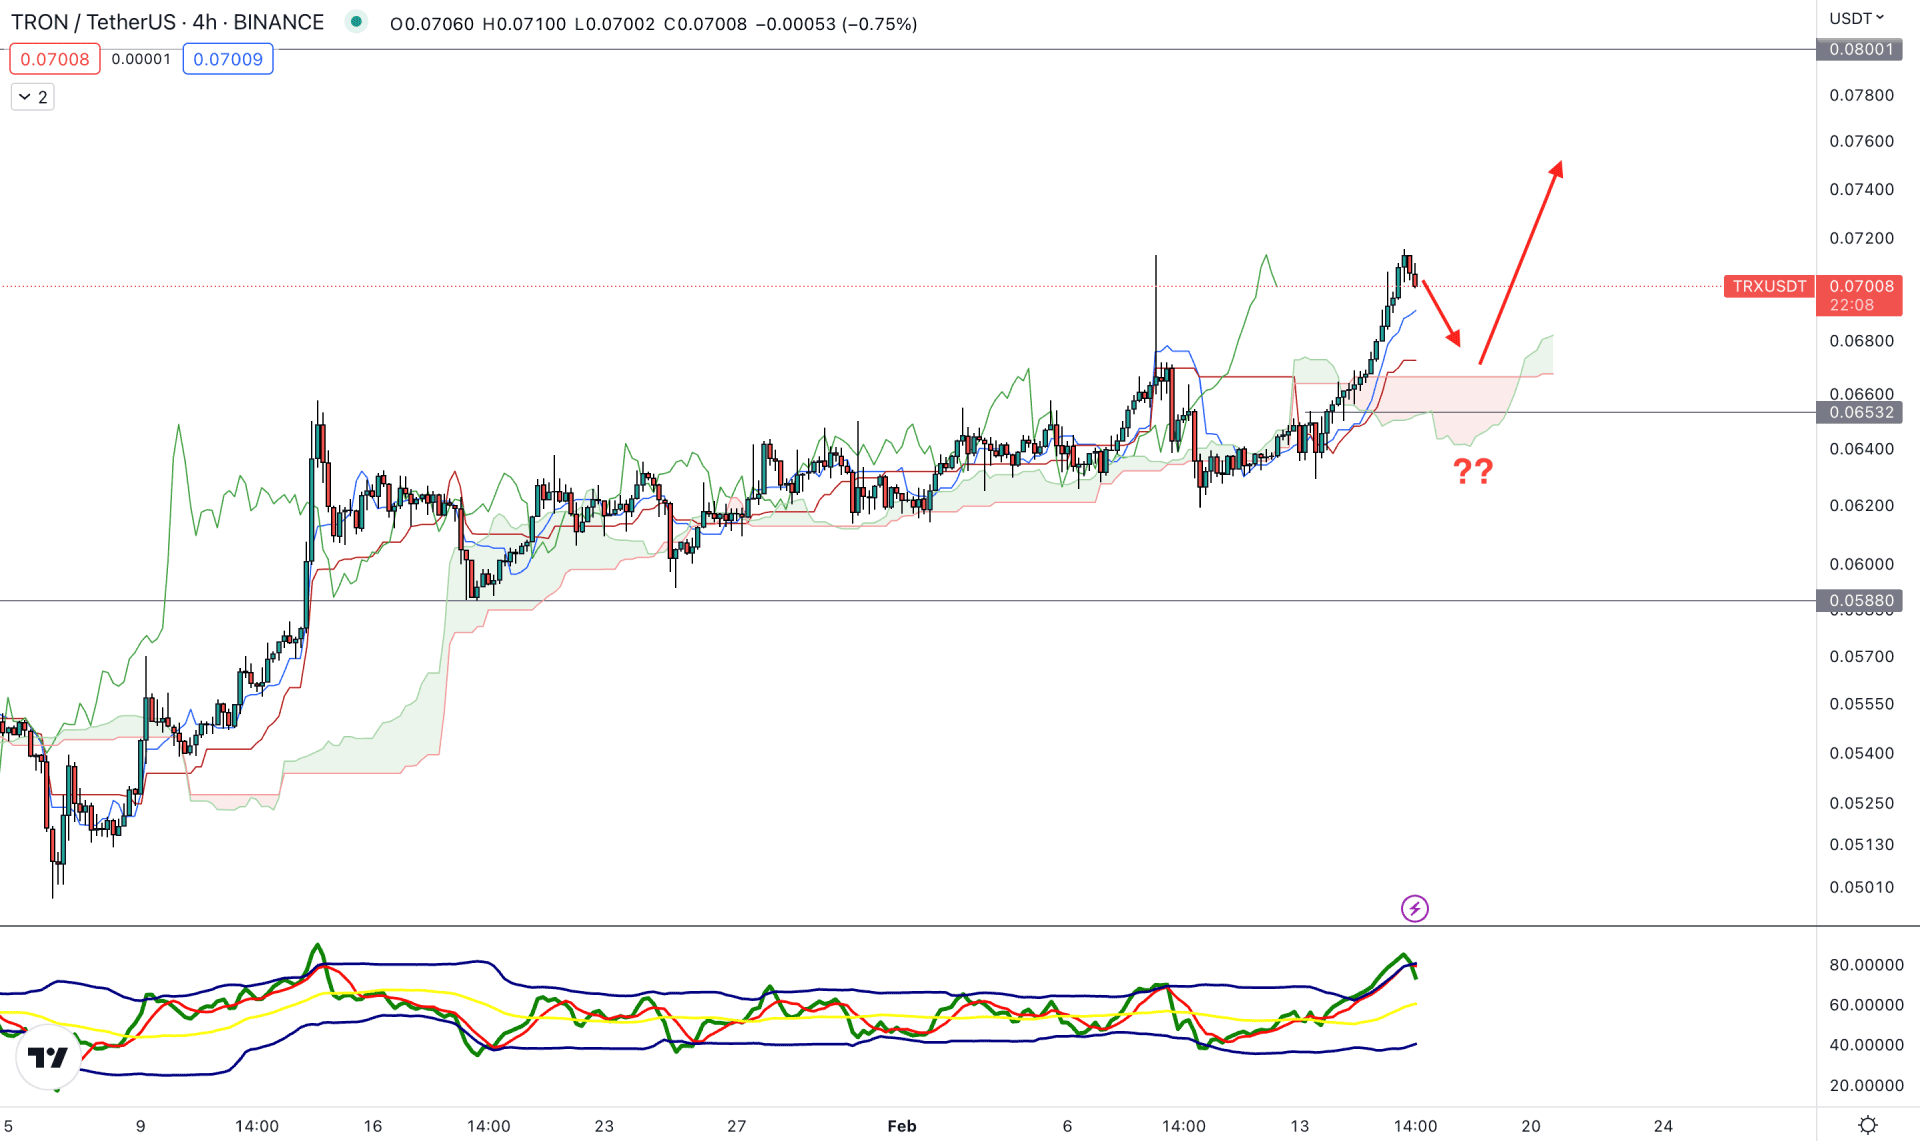
In the TRX/USDT H4 chart, the current outlook is bullish as the price is above the Kumo Cloud for a considerable time. Moreover, the future cloud has flipped, and the Senkou Span A moved above B. Therefore, the bullish momentum would be solid as long as the price trades above the Kumo Cloud bottom.
In the indicator window, the Traders Dynamic Index (TDI) reached the upper band from where a strong bearish correction appeared. The dynamic level of Kijun Sen is still below the price and aimed higher, which is a sign of an existing bullish trend.
Based on the H4 structure, a strong buying momentum may appear once a downside correction is over. A bullish rejection from the dynamic Kijun Sen line with a candle close would be a valid signal for a bullish trend continuation opportunity.
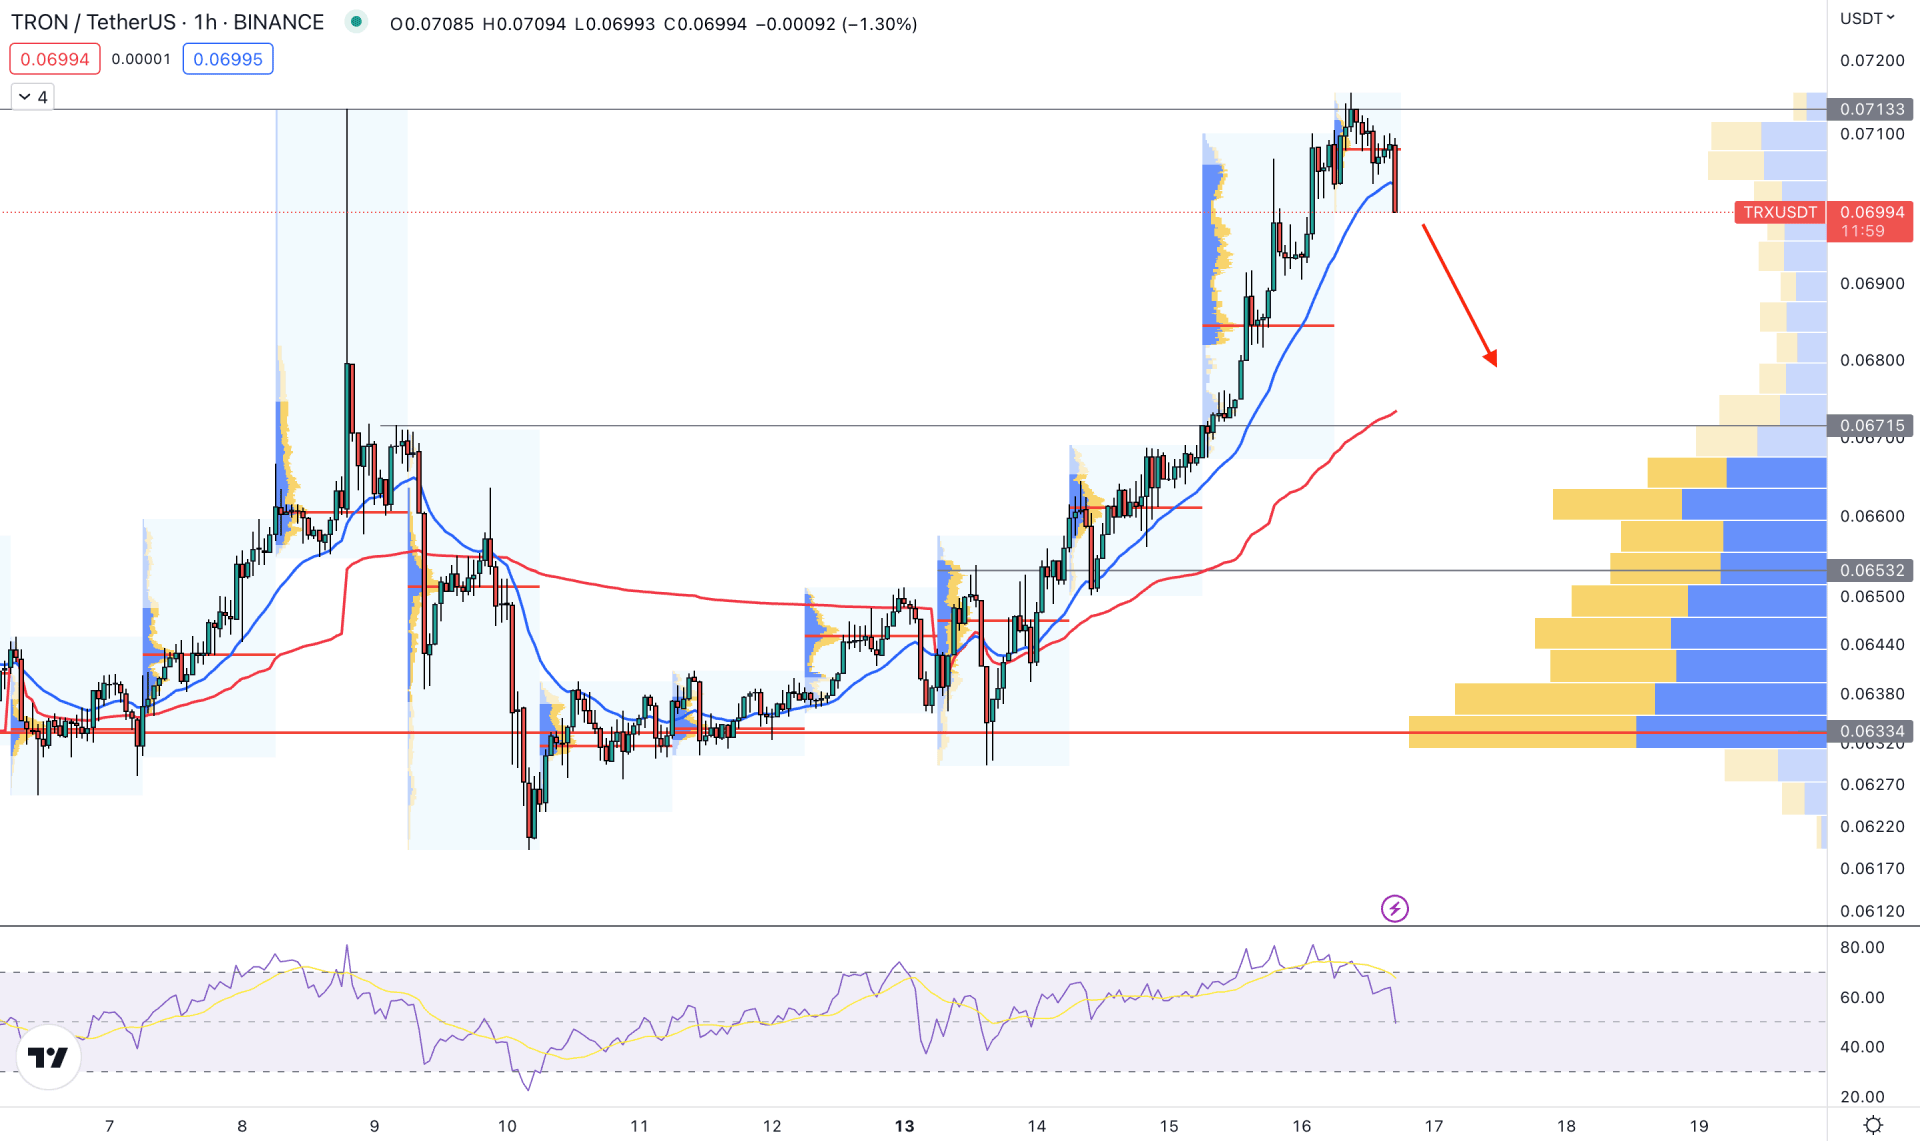
In the hourly chart, the current market outlook is extremely corrective as the price reached the 0.0713 resistance level with a bearish rejection. Moreover, the gap between the price and high volume 0.0632 level has expanded. It is a sign that bulls from the high volume are taking some profits, which could signal further downside pressures in the coming hours.
A strong bearish H1 candle appeared below the dynamic 20 EMA, while the weekly VWAP is still above the 0.0671 static support level. The Relative Strength Index (RSI) showed a strong recovery from the overbought zone, which indicates another signal of a downside correction.
Based on this structure, a bullish rejection from 0.0671, or 0.0653, could offer a long opportunity targeting the 0.0800 level.
However, breaking below the 0.0633 level with a bearish H4 candle could lower the price towards the 0.0500 level.
TRX/USDT is moving up within a strong bullish trend from where any minor bearish recovery in the intraday chart with a valid rejection would be a trend trading opportunity. However, a sharp decline in the daily chart with multiple lower low formations could be an alarming sign to bulls.


