
Published: March 17th, 2022
In the last two weeks, TripAdvisor Stock (TRIP) stock showed a buying pressure from 20.34 swing low to 25.58 with a 25.31% price change. Moreover, the buying momentum was influenced by the 25 bps rate hike by the Fed. Due to the recent price surge, investors may consider it as a potential buying opportunity although the global travel industry is affected by the Ukraine-Russia war.
TripAdvisor is the world's biggest travel booking service provider, where almost 450 million visitors come every month. It provides services on finding a hotel room, cruises, and other travel activities. Therefore, this business is closely connected to the geopolitical uncertainty that might decrease the travel demand due to incidents like pandemics or war.
In the latest quarterly earnings report, TripAdvisor reported $241M revenue against the expectation of $247.919M. Although the revenue was dropped by 20% from the previous quarter, it is backed by consecutive three better quarterly earnings. Moreover, management expects a rebound in the global travel market after the pandemic where the current concern regarding Ukraine-Russia was active. However, the Wall Street sentiment about the global economic growth might work as a price driver from TripAdvisor Stock (TRIP) until the operating updates come likely in early May.
Let’s see the upcoming price direction from the TripAdvisor (TRIP) technical analysis:
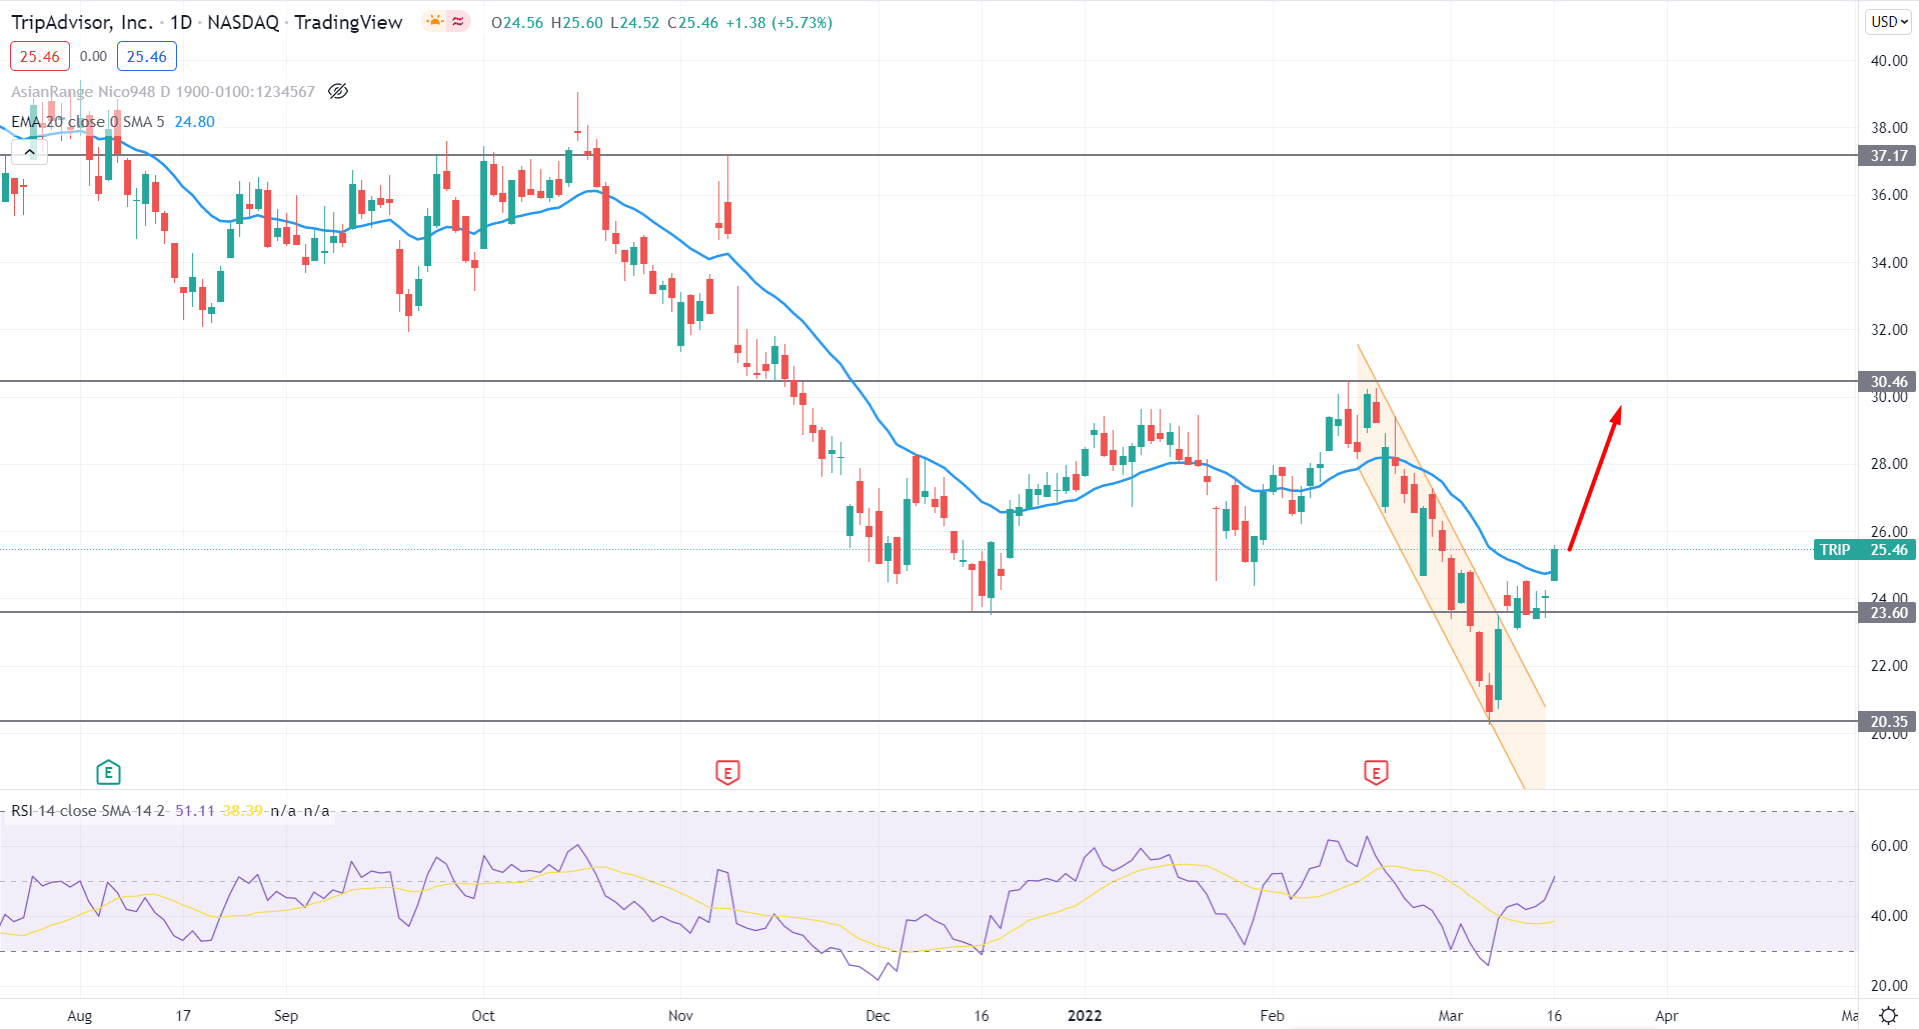
In the daily chart of TRIP, the price showed a prolonged bearish pressure from March 2021 peak, where the daily close below the 37.17 event-level increased the bearish momentum. However, the price action between 30.46 high to 20.35 low became corrective where multiple violations of dynamic level are present. Moreover, the recent bullish breakout from the bearish channel with the daily close above the dynamic 20 EMA might be a bullish factor for the instrument.
The above image shows how the price benefited from the Fed rate hike with a strong bullish daily close. The RSI line rebounded higher from the oversold 30 level in the indicator window and reached the 50 mid-line. Therefore, the RSI has more upside potential to reach the overbought 70 level by increasing the bullish momentum in the price.
Based on the daily price structure, the current price has multiple barriers on the downside. Therefore, as the price trades above the 23.60 level, it is more likely to test the 30.46 resistance level with a 20% gain. On the other hand, the buying possibility might be invalid if the price reaches below the 20.35 swing low with a bearish daily candle.
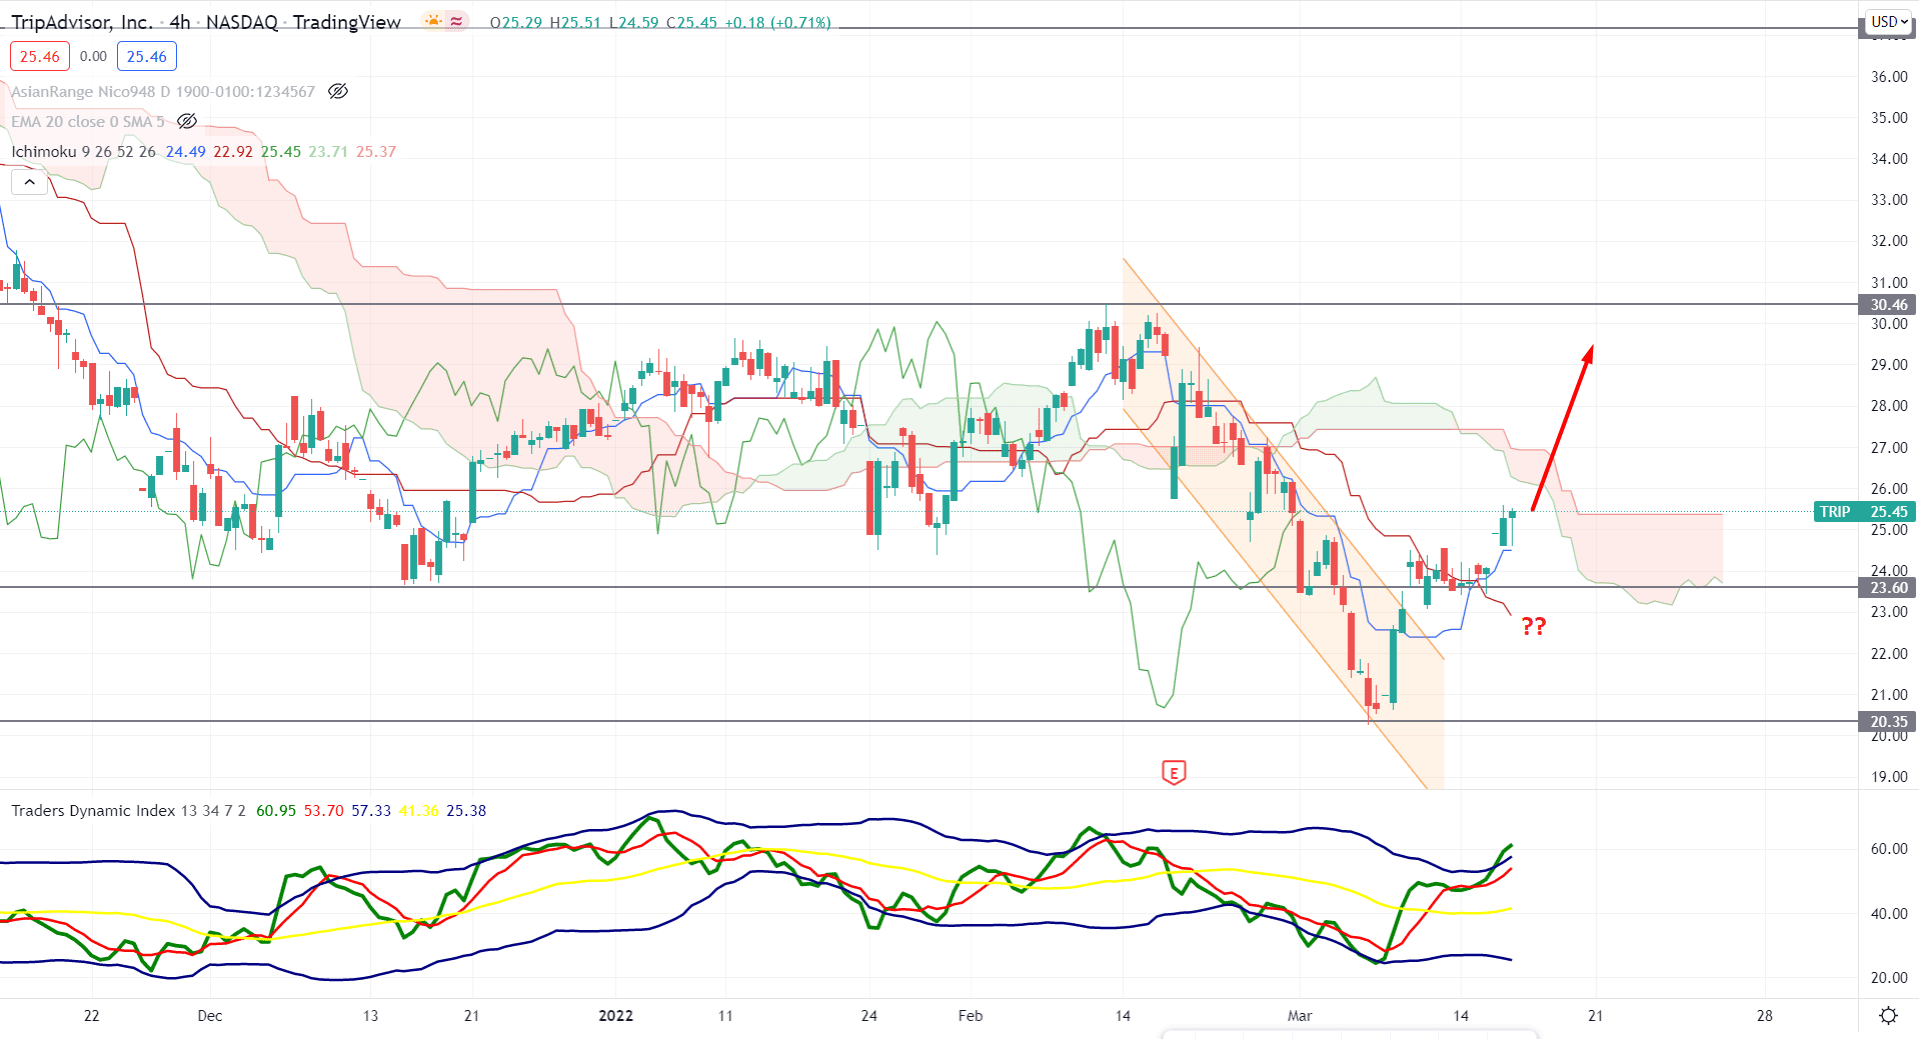
In the H4 chart, TripAdvisor Stock (TRIP) trades below the Kumo Cloud while the future cloud is still bearish. However, the recent bearish channel breakout with a bullish crossover between dynamic Tenkan Sen and Kijun Sen indicates buyers attempt to take the price higher.
The above image shows how the Traders Dynamic Index (TDI) line reached the overbought 60 level, indicating that bulls are active in the market. Moreover, the thickness of the Cloud resistance is not substantial where the dynamic Kijun Sen is below the price.
Based on this price structure, investors should closely monitor how the short-term price trades where the possibility of testing the 30.46 resistance level is valid until bears are taking price below the 23.00 level. The alternative approach is to wait for a rebound from the cloud resistance and open a short position from the bearish H4 close below the dynamic Kijun Sen.
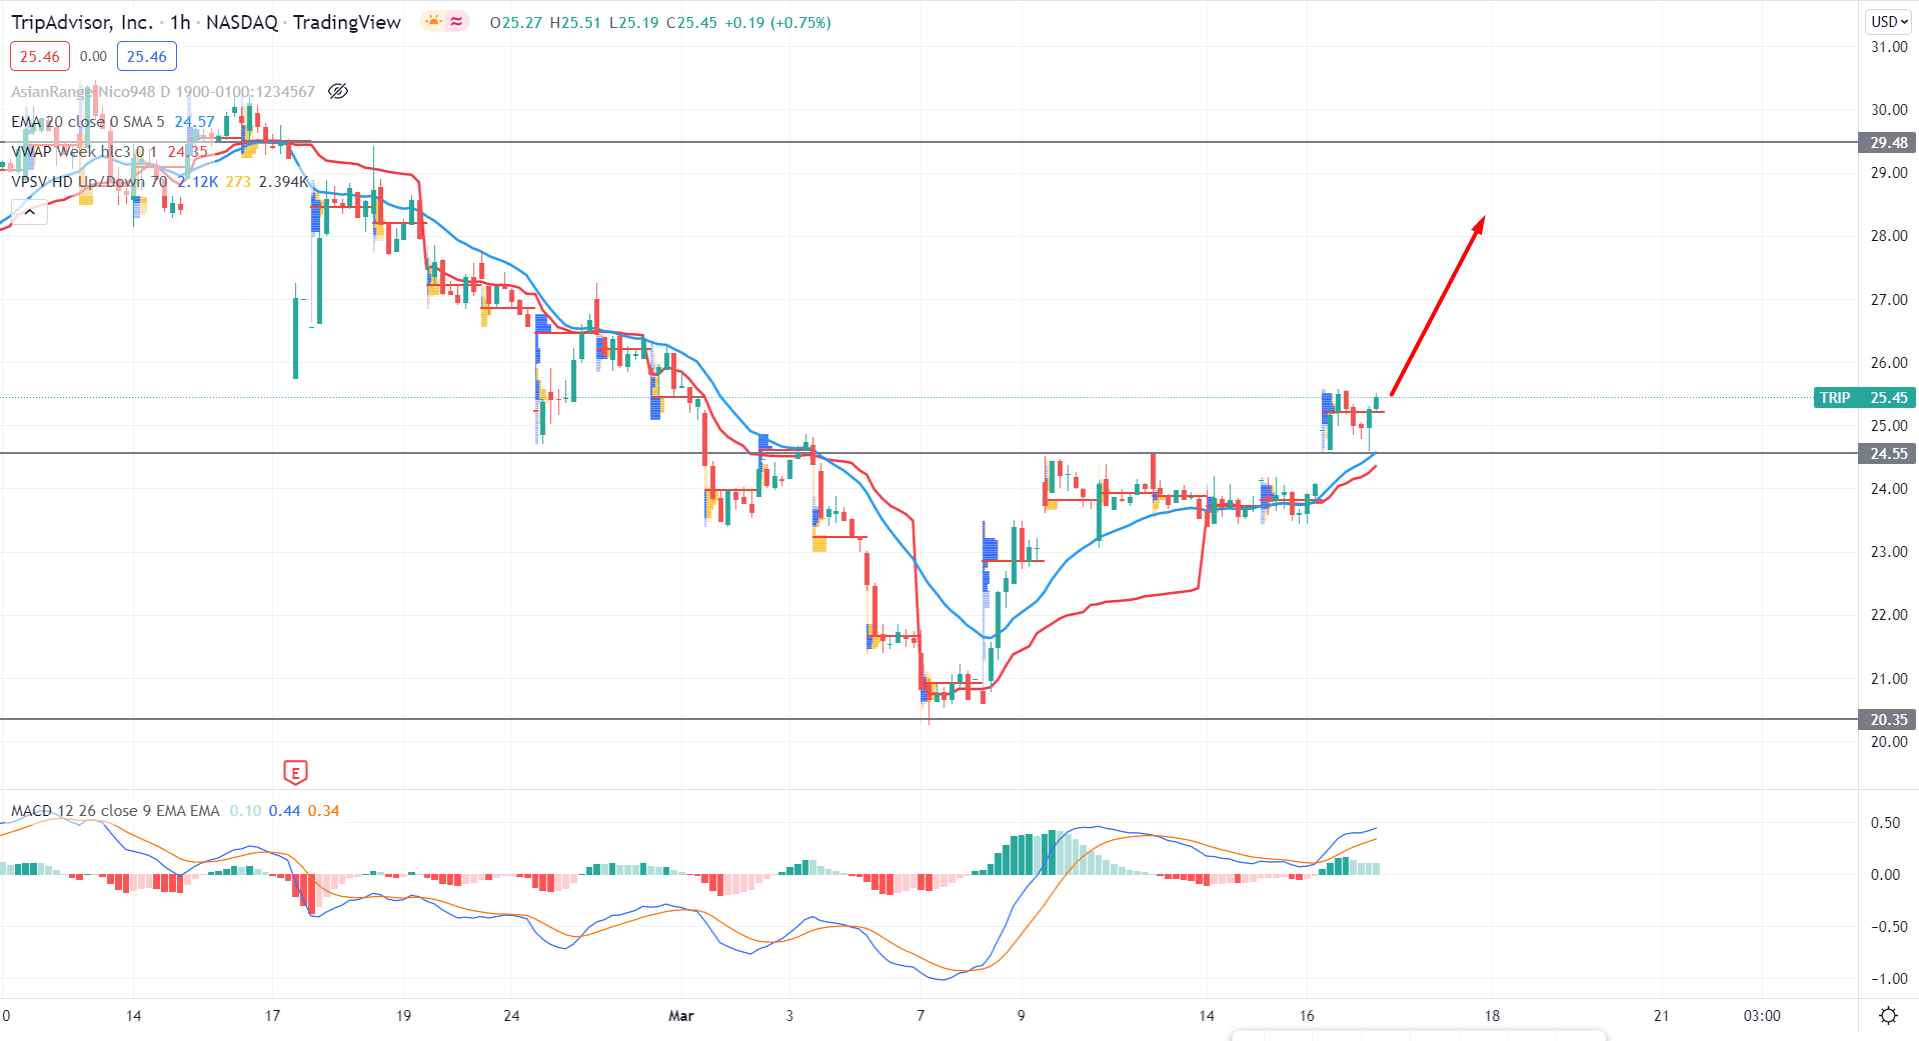
In the intraday chart, TRIP is trading within a buyers zone where the most recent high volume level is below the price. Moreover, the price made a bullish pressure above the 24.55 static level while the dynamic 20 EMA is below the price.
The above image shows how the MACD Histogram failed to move below the neutral level and changed its direction. Moreover, the dynamic weekly VWAP is below the price and aimed at higher. Therefore, the hourly chart shows a strong buyers presence that may take the price up towards the 29.48 resistance level. On the other hand, if the price moves below the dynamic weekly VWAP, a correction towards 20.35 is likely to happen before showing any buying sign.
Based on the current multi-timeframe analysis, TRIP may extend the current bullish momentum towards the 30.46 resistance level from where bears may join. On the other hand, the broader market context of this instrument is still bearish, where traders should remain cautious about taking and buying positions. Therefore, any H4 close below the dynamic Kijun Sen would be the alternative approach to short in this pair.