
Published: May 12th, 2026
Tower Semiconductor's specialised foundry concentration on silicon germanium and silicon photonics is capable of maintaining customer adoption in networking, artificial intelligence, and now U.S. defence. Although the Axiro radar alliance and the positive S&P Maalot prediction may boost confidence in the short-term, they do not eliminate the main concerns associated with possible overcapacity and technological changes.
Despite the robust progress, investors should consider the possibility of Tower's significant capital expenditure and concentrated exposure to SiPho and SiGe.
By 2029, Tower Semiconductor anticipates $2.8 billion in sales and $732.5 million in profits. Moreover, some analysts were already wary, projecting US$2.8 billion in sales and US$716.5 million in profitability by 2029. However, they were concerned that Tower's massive capacity build-out might not be adequately supported by AI-driven photonics demand.
Let's see the further aspect of this stock from the TSEM technical analysis:
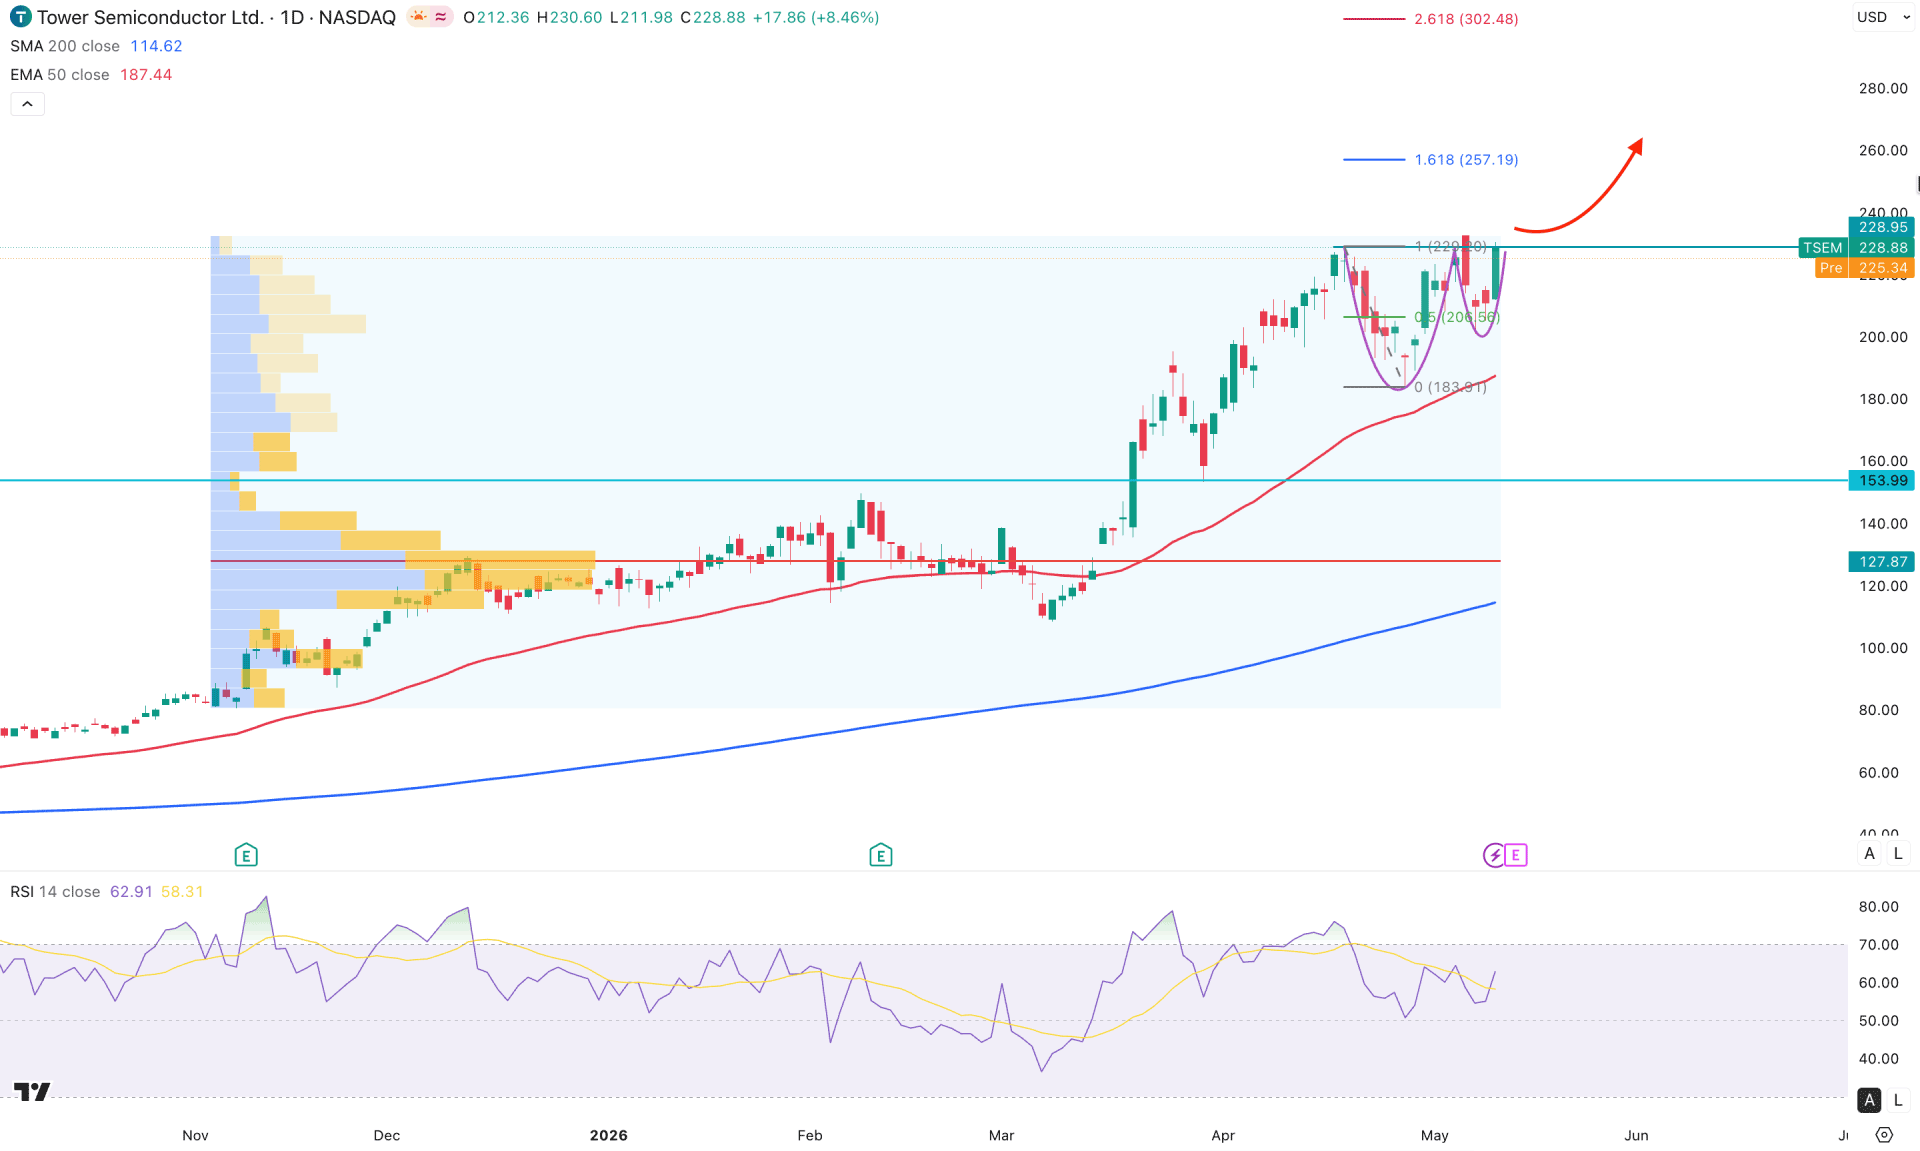
In the daily chart of TSEM, the major market momentum is bullish as no significant selling pressure is visible from the current all-time high area. As long as the price remains bullish above the existing swing low, the main aim would be to look for long trades only.
Looking at the higher time frame,, a strong bullish trend is visible as the recent monthly candle is maintaining buying pressure above the previous monthly high. It is a sign of a strong bullish trend continuation until an exhaustion appears at the top. The weekly timeframe shows a similar story, where corrective market momentum is visible, signaling a bullish rally formation.
In terms of volume, the buying structure is still supportive, as the largest activity level since November 2025 is marked at 127.87. As long as the price remains above this line, we may expect the bullish pressure to continue. Although the market momentum is bullish,, a considerable correction could appear following the gap with the high volume level.
In the main price chart, the 200-day SMA is the lowest point of the dynamic support, signaling a bullish extension. It is also a sign of a potential downside correction before maintaining the buying pressure. However, the 50-day EMA is closer to the current price and is working as an immediate support.
The entire structure is also within a bullish pre-breakout formation followed by a possible cup and handle breakout. The current neckline is marked at the 228.88 level, which is just above the current price.
The RSI is also supportive, where the current line is having a bullish recovery from the 50.00 neutral level.
Based on the overall market structure, the major momentum is bullish and a potential bullish continuation is highly possible. The immediate resistance is marked at the 257.19 level, which is a crucial Fibonacci Extension level. Overcoming this line could extend the buying pressure beyond the 300.00 area.
On the bearish side, a failure to hold the momentum above the 50 day EMA would be the first sign of an extended downside correction. In that case, the primary support level would be at the the 153.99 level before heading towards the 200-day SMA.
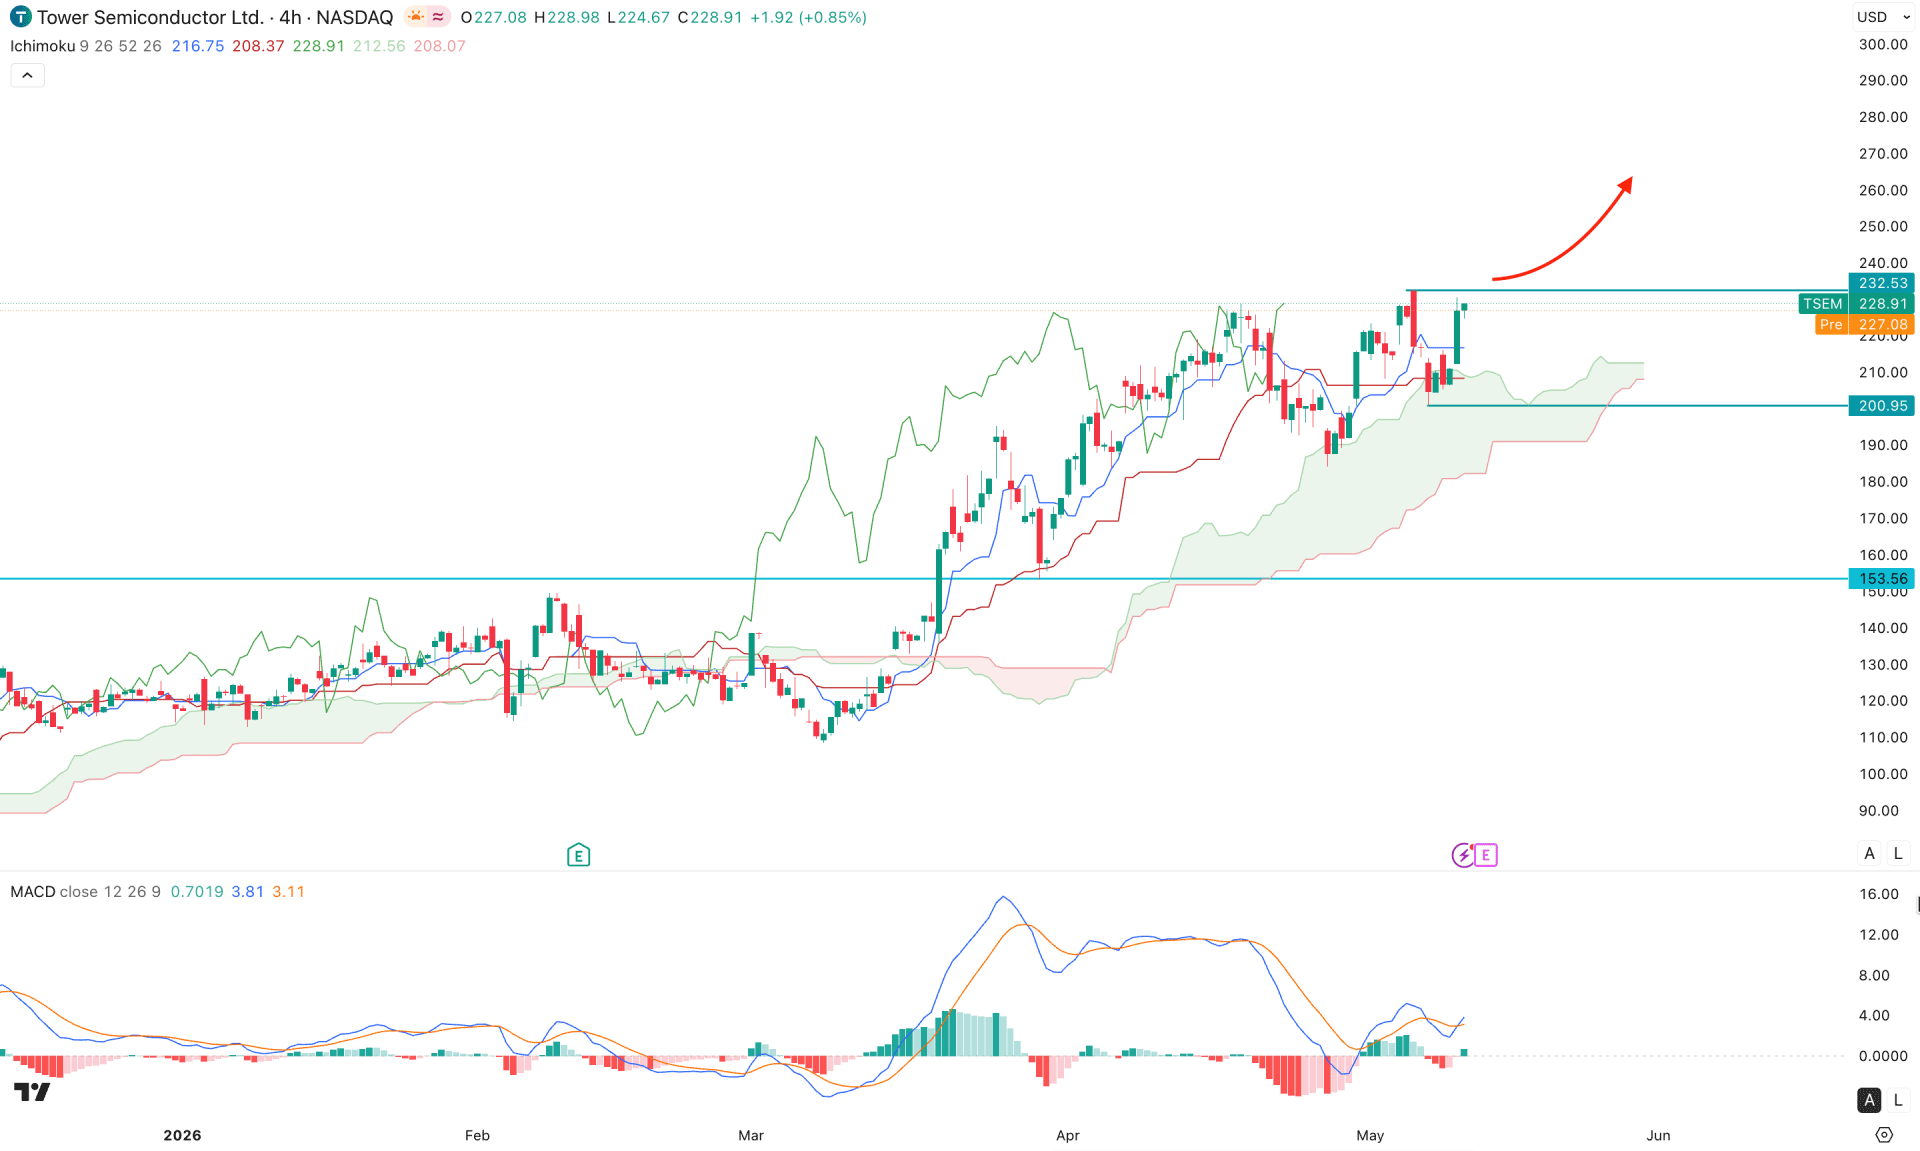
In the four-hour chart of TSEM, the most recent price formed a bullish rebound above the Kumo cloud area with a valid retest. Moreover, a bullish candle is present above the dynamic Kijun-sen level, with a bullish support from the future cloud.
In the indicator window, a potential rebound is also visible in the MACD histogram with a possible bullish crossover in the signal line.
Based on this structure, the bullish possibility is strong, where the immediate resistance is at the 250.00 psychological level. However, a downside correction is possible, where the immediate support to watch is the 200.95 level. An extended selling pressure below the 180.00 level could break the cloud support and take the price below the 153.56 swing low.
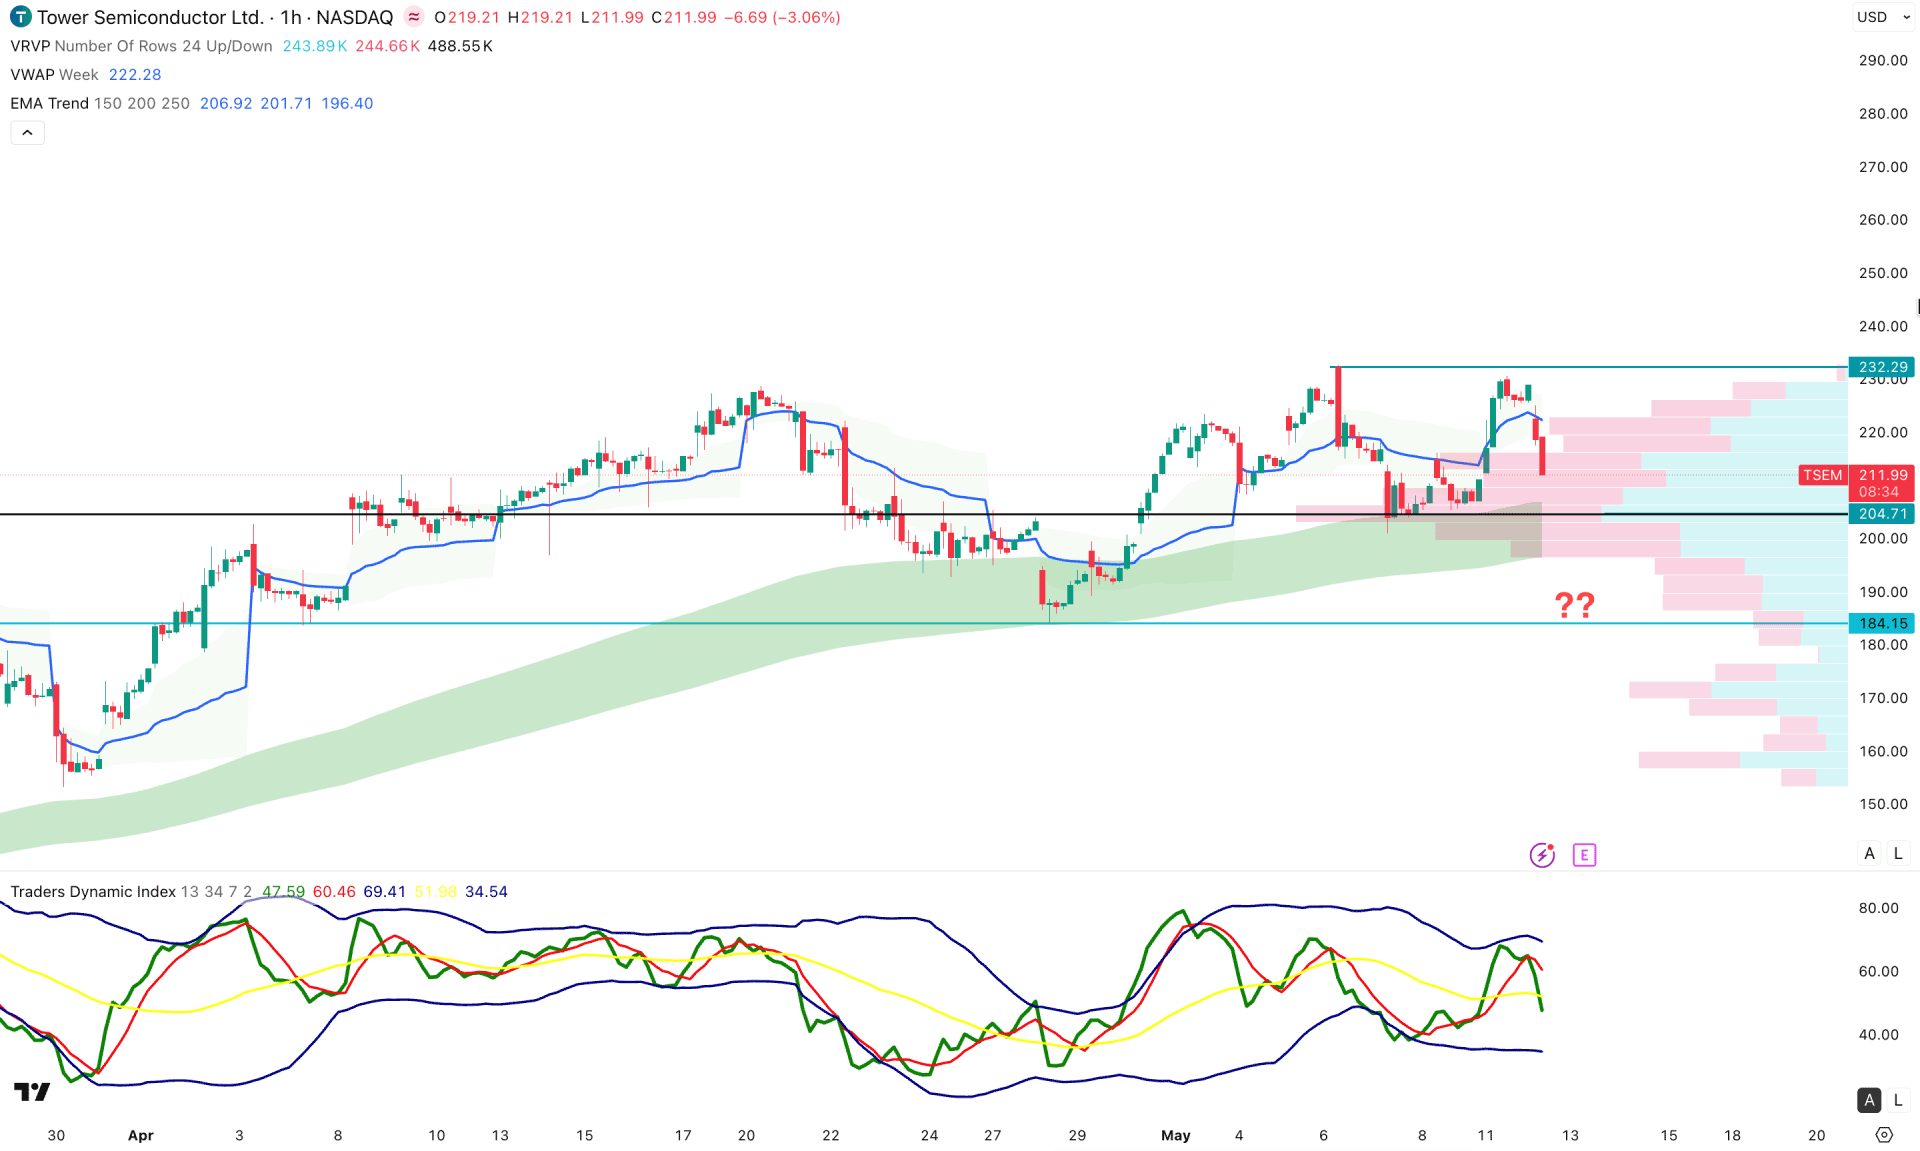
In the hourly chart of TSEM, the intraday market momentum is sideways to slightly bullish. The most recent price is trading within a rectangle pattern. However, the trend is still valid as the intraday high-volume line is below the current price and working as an immediate support.
In the secondary indicator, the Traders Dynamic Index is hovering below the 50.00 neutral line, signaling minor weakness.
Based on this outlook, the ongoing market momentum is sideways, and the price can test the 204.71 support level before forming a bullish signal. In that case, a valid bullish reversal can start from the 204.71 area. A move toward the 218.15 area with a valid hourly candle above the weekly VWAP line could open a long opportunity.
In that case, overcoming the 232.29 swing high could be a remarkable move, as it may take the price beyond the 260.00 level.
On the other hand, a failure to hold the price above 184.15 may initiate an extended downside correction toward the 150.00 level.
Based on the overall market structure, TSEM is trading within a prolonged bullish trend. A valid rebound from a reliable price area could provide a potential trend continuation opportunity. As the current price is sideways, investors should closely monitor the price action, as a higher low formation followed by a bullish rebound could be a trend continuation signal.


