
Published: August 16th, 2023
Tap Fantasy, a blockchain-based MMORPG game, shifted its focus to the TON Network, contributing to Tone Coins recent gains. By migrating across chains, Tap Fantasy hopes to capitalize on the extensive user base and robust technical support of the TON Network.
Pavel Durov, the CEO of Telegram, disclosed his ownership of Toncoin and Bitcoin on his official Telegram channel less than a month prior. This revelation occurred at the same time as Telegram's continued substantial expansion. Durov's announcement highlighted the app's remarkable metrics, including over 800 million active users per month and creating over 2.5 million new accounts per day.
In the midst of this favourable trend, the TON Developer Reported an extraordinary 102% increase in developer engagement over the previous year. The developer community for the project grew to 9,134 members by the end of June, a 6.56 percent increase from the 8,572 members recorded on April 1st. TON Documentation received over 300 commits and 111 merges from 32 contributors during the same time frame.
This expansion was spurred by the DoraHacks hackathon, which generated significant developer participation and sustained progress on proprietary production repositories, as detailed in the most recent report. Throughout the quarter, the Foundation organized several competitions, including one centered on the TON Wallet that garnered nearly 100 submissions.
The result of these developments is clearly visible on the price chart. Let’s see in detail from the TON/USDT technical analysis:
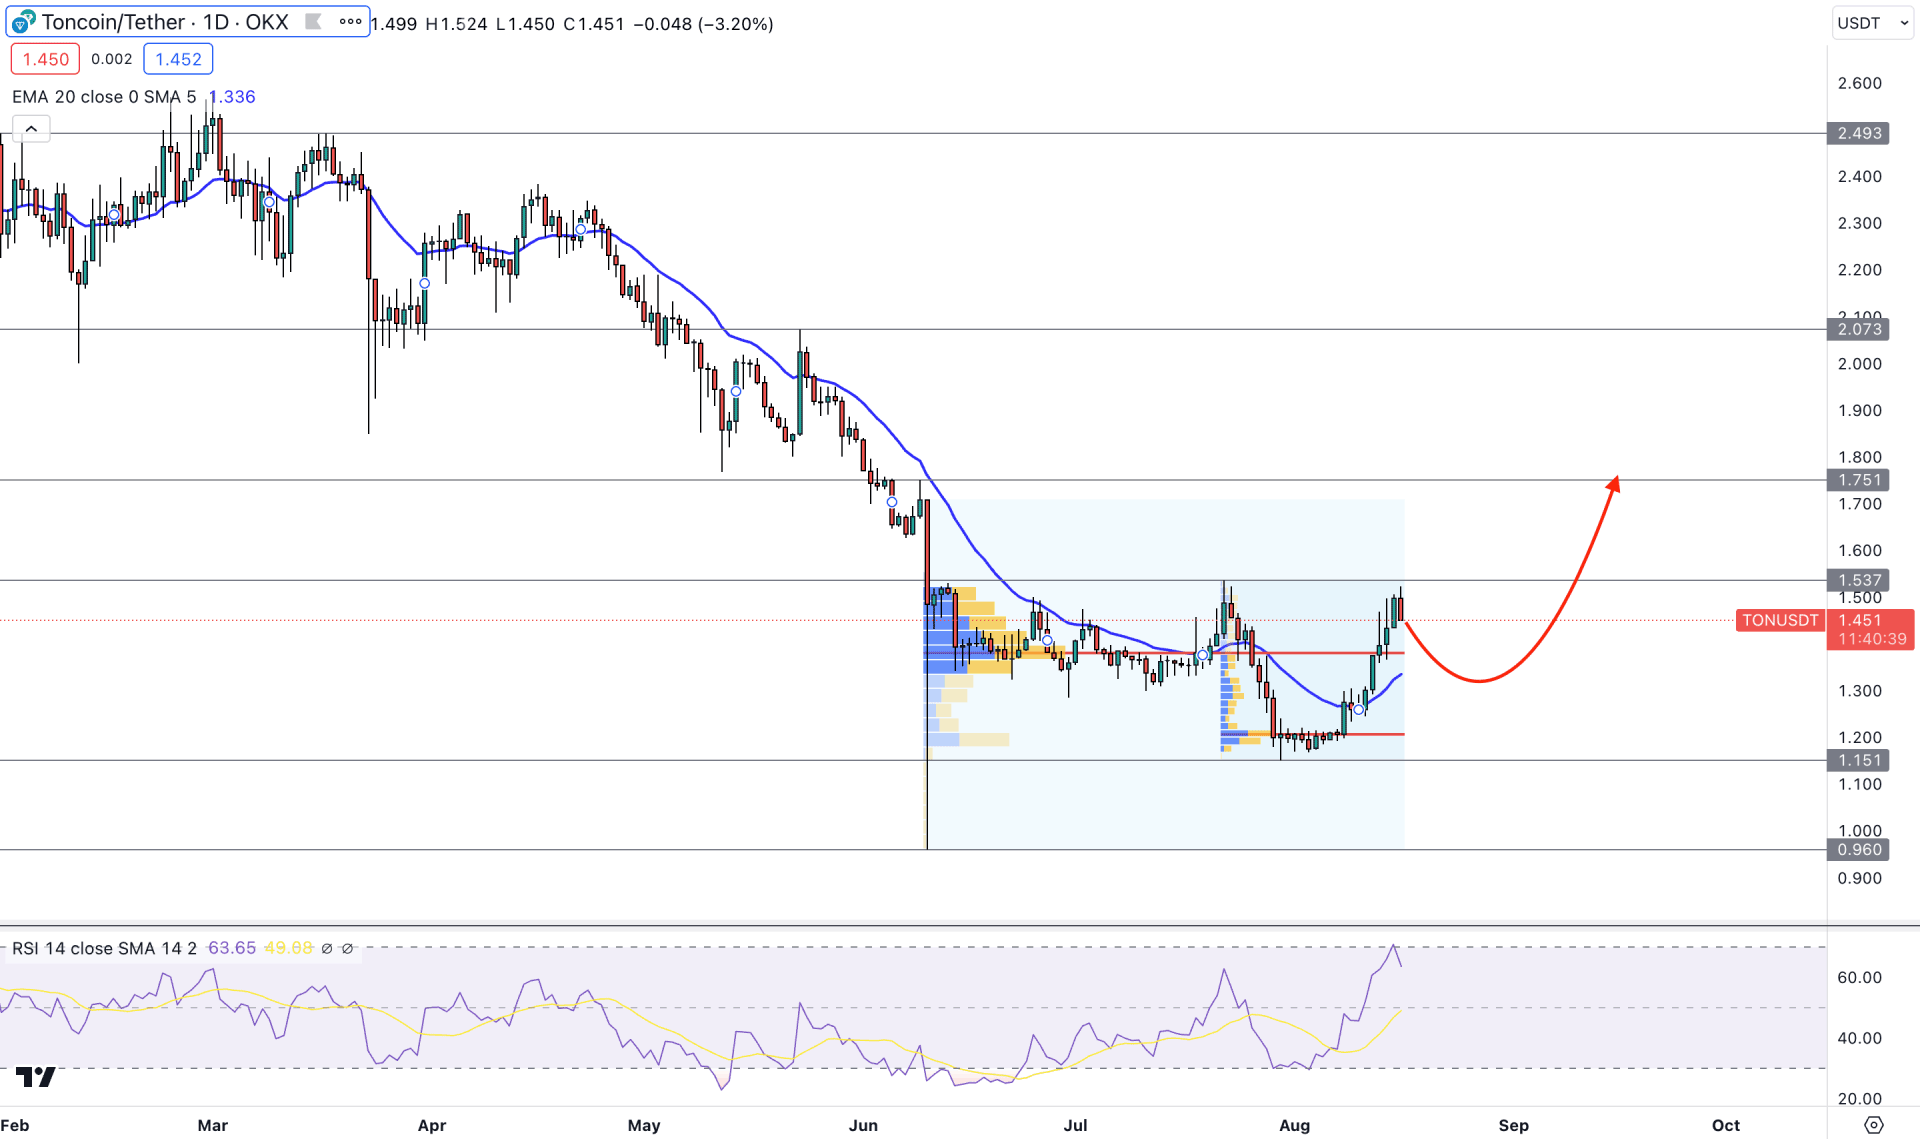
In the daily price on TON/USDT, the overall market outlook is bearish as the recent price shows a strong downside momentum since March 2023. However, the bearish pressure was exhausted in June, which was the primary indication of a trend change. As the current price faces resistance, investors should monitor how the price reacts in this area before finding a stable trend.
In the higher timeframe’s price action, it is the first ongoing bullish month after the fourth consecutive bearish month. Moreover, the weekly price shows a corrective structure, from where a breakout could offer a trend trading opportunity.
The strong buying signal may come after breaking above the near-term resistance level in the daily price, supported by a U-shape recovery. Moreover, the dynamic 20-day Exponential Moving Average is below the current price and working as a minor support.
In the volume structure, indecision is visible as the current high volume level since June 2023 is at 1.380 level. Another high volume level from 22 July high is at 1.206 level. As both levels are below the current price, we may expect a bullish continuation pattern potent for this pair.
In the indicator window, the current RSI is at the overbought 70.00 level, which signals an extreme buying momentum in the price.
Based on the daily price of TON/USDT, a bullish break above the 1.537 resistance level with a bullish D1 candle could be a strong long signal in this pair, targeting the 1.800 level.
However, downside momentum is still potent, where any bearish daily close below the 20-day EMA could resume the bearish trend towards the 1.000 psychological level.
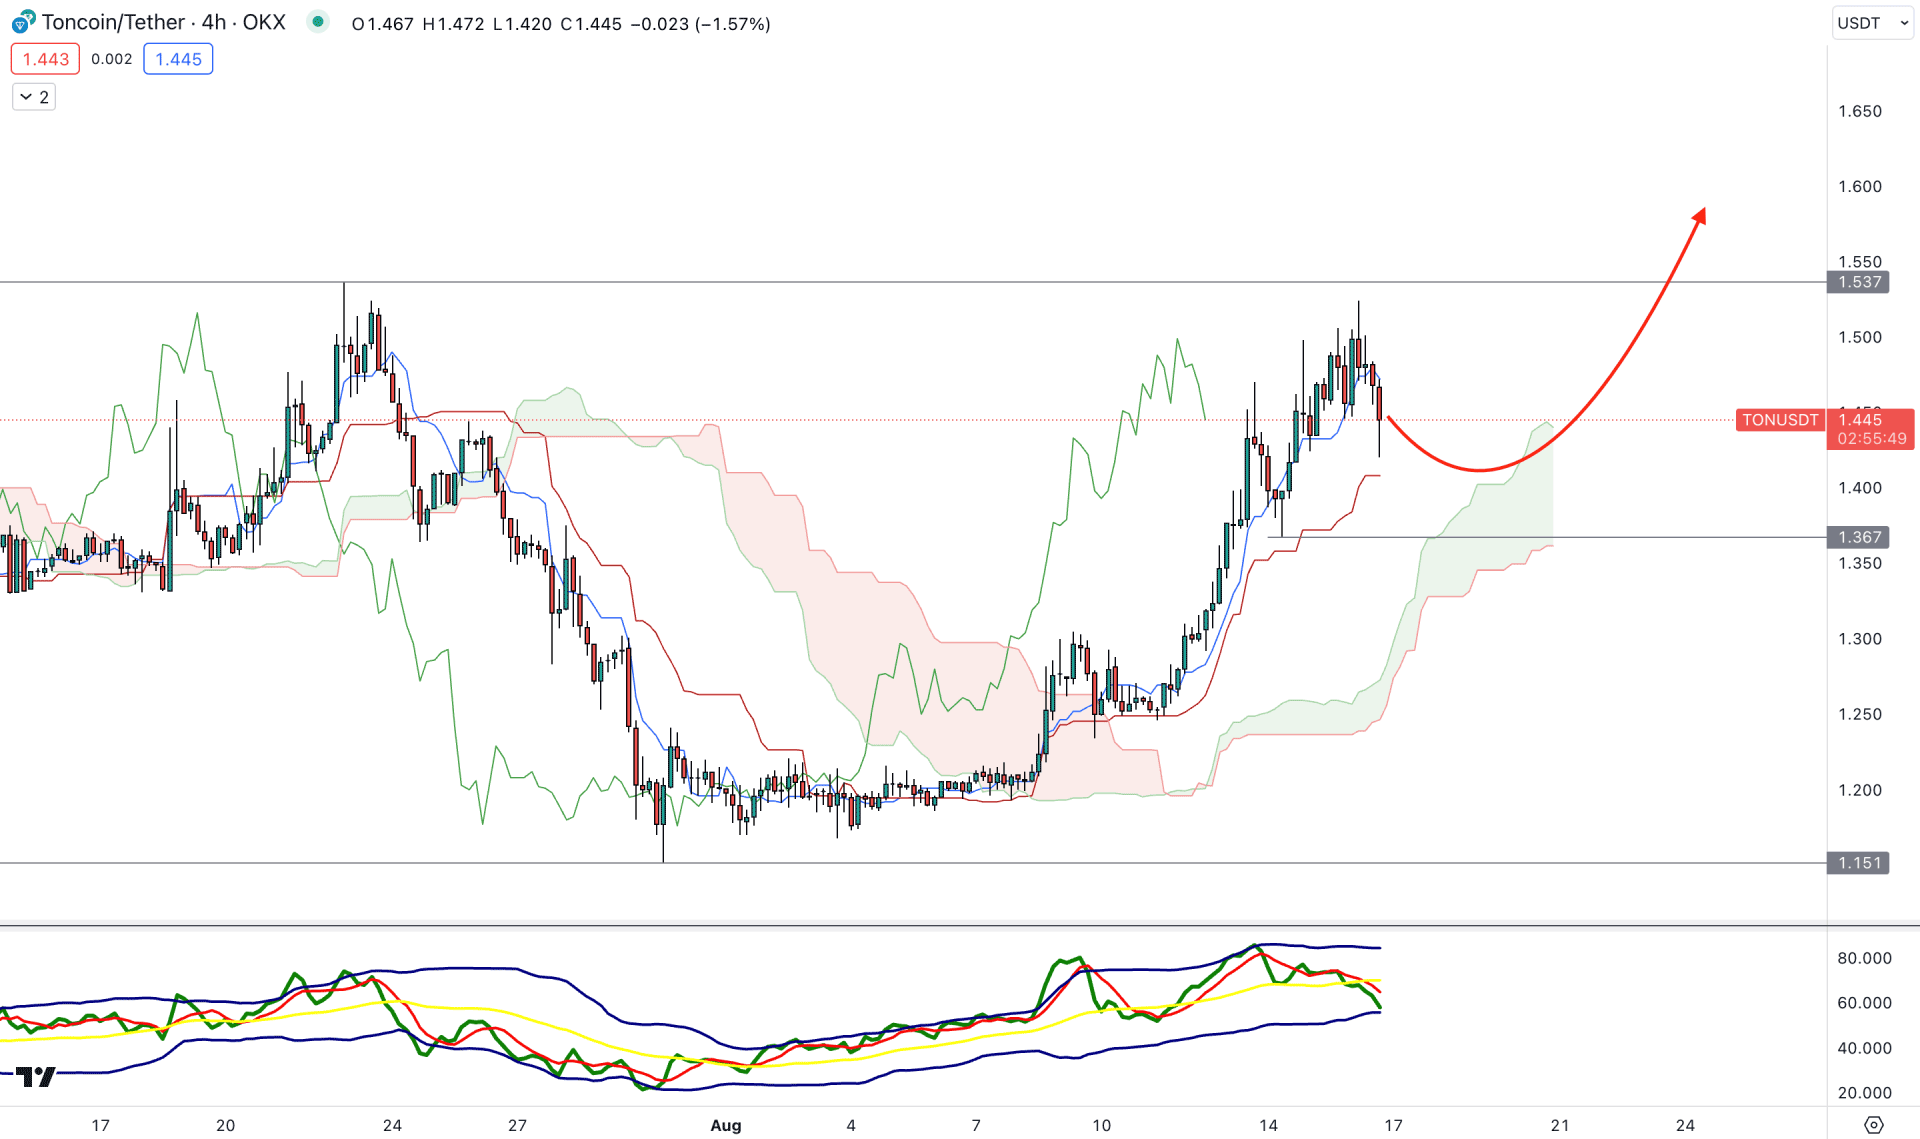
In the H4 chart, the broader market direction is bullish, as the current momentum shows a bullish continuation opportunity above the Cloud zone. Moreover, the future cloud is bullish, where the gap between Senkou Span A and B is solid for a continuation opportunity.
In the indicator window, the current Traders Dynamic Index level is below the 50.00 neutral line, which signals a downside momentum in the price. A bullish recovery in the TDI line above the 50.00 level is needed before aiming for a bullish opportunity.
Based on the H4 timeframe, bullish rejection from the dynamic Kijun Sen support could be a trend continuation opportunity in this pair, targeting the 1.800 level. On the other hand, a bearish H4 candle below the Kumo Cloud zone could be an alarming sign to bulls.
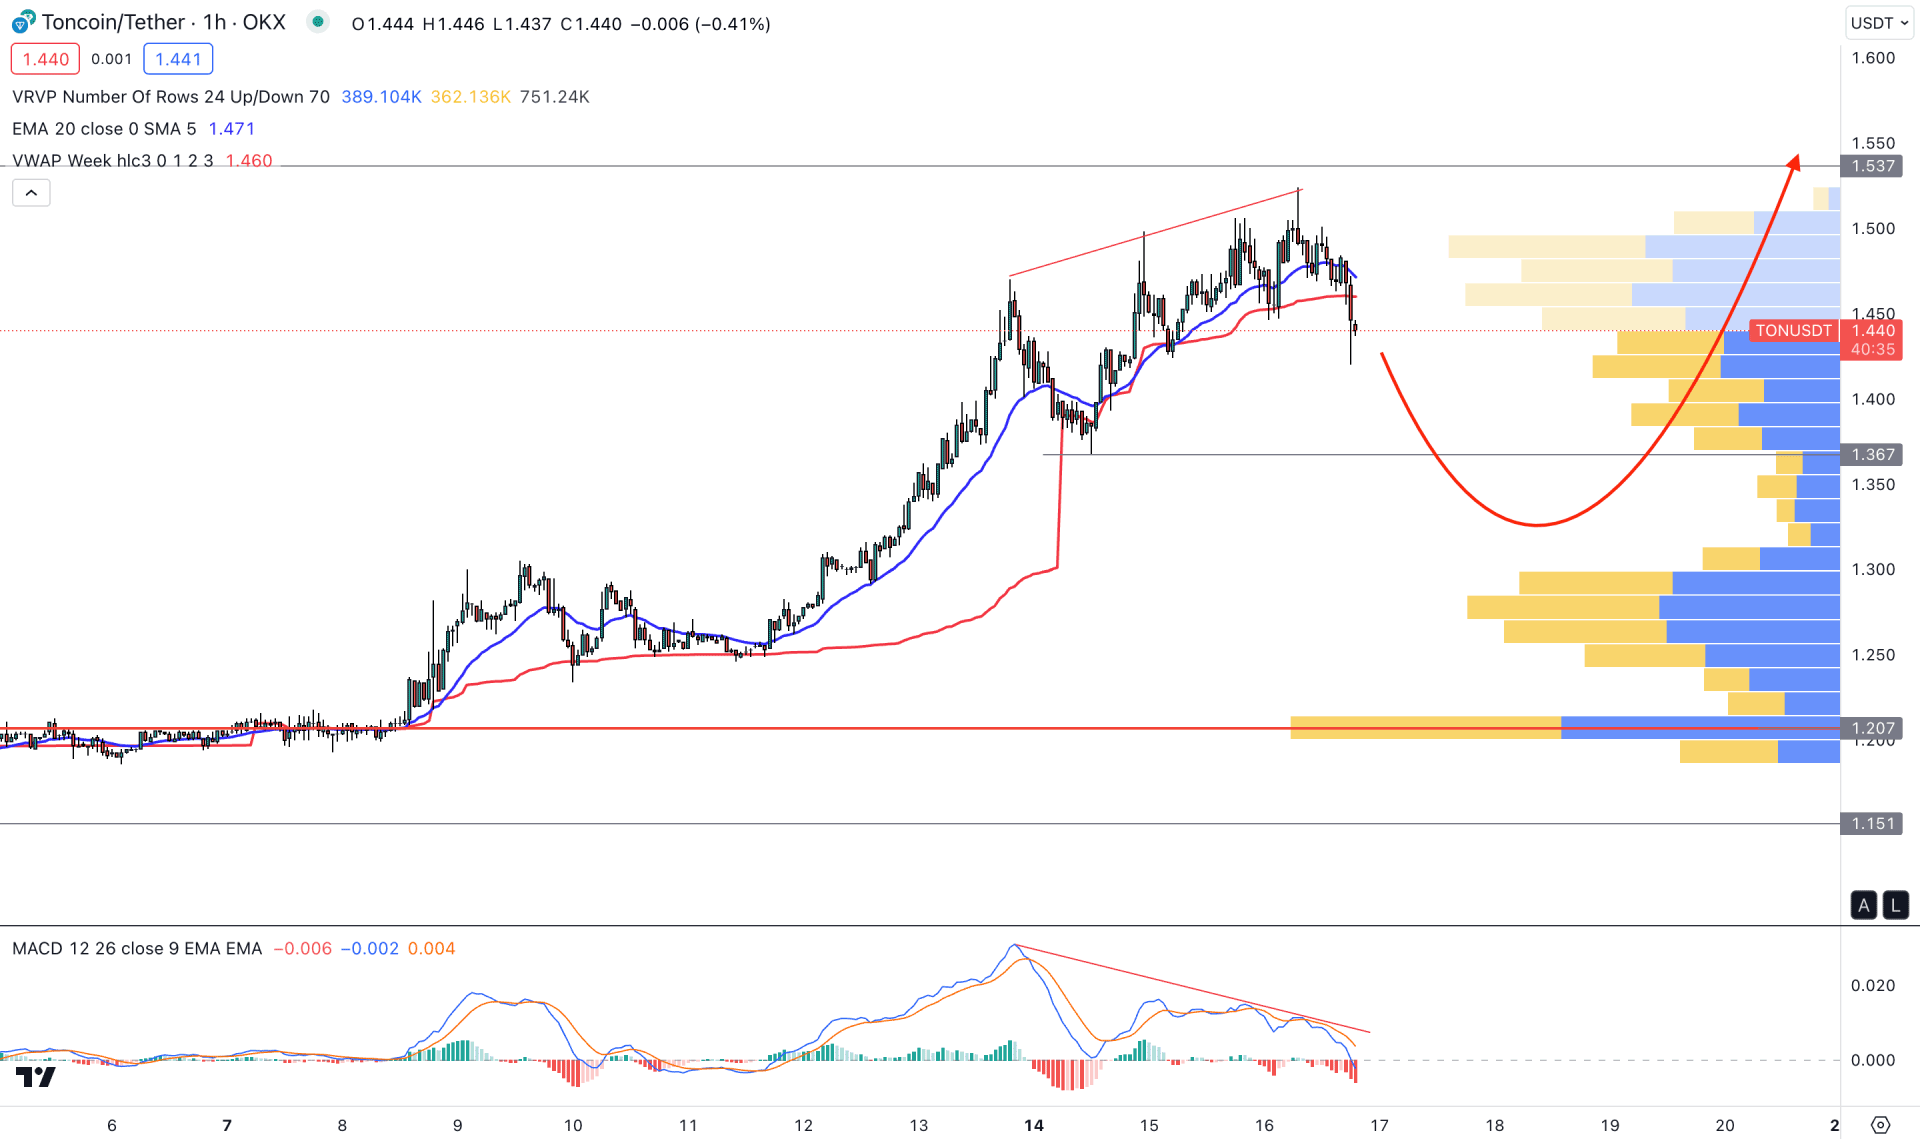
In the H1 chart, the current price is trading above the visible range high volume level, which signals a buyer's presence in the market. However, the gap between the high volume level and the price has widened, which may result in a mean reversion.
The current price is trading below the dynamic 20 EMA, while there is a strong sell signal from the MACD Divergence.
In the H1 chart, the current bearish pressure may lower the price below the 1.367 support level to grab liquidity. In that case, a bullish rejection from the 1.360 to 1.200 area could be a short-term long opportunity, targeting the 1.600 level.
Based on the current multi-timeframe analysis, TON/USDT could extend the buying pressure after grabbing the sell-side liquidity in the intraday chart. However, an immediate bullish recovery with a proper breakout could resume the trend at any time.


