
Published: March 4th, 2026
Toncoin (TON) is trading bearish, supported by a declining participation in the on-chain action. Technically, the price is trading within a downtrend with no sign of a reliable recovery.
According to the on-chain data, the trading volume has dropped, taking the TVL down by more than 3%. The weekly trading volume has marked the lowest of $12.6 million. This significant drop in the volume means less interest in this instrument with a lower liquidity injection.
On the other hand, the positive funding date is a positive sign of this instrument that can be pointed to as an early bullish signal. The funding metric has flipped to 0.0050 today, signalling a growing momentum. This ratio indicates that the longs are working as an expense to sellers, which can work as a potential bottom formation. However, the price action is still bearish with more confirmations pending.
Let's see the complete outlook from the TON/USDT price analysis:
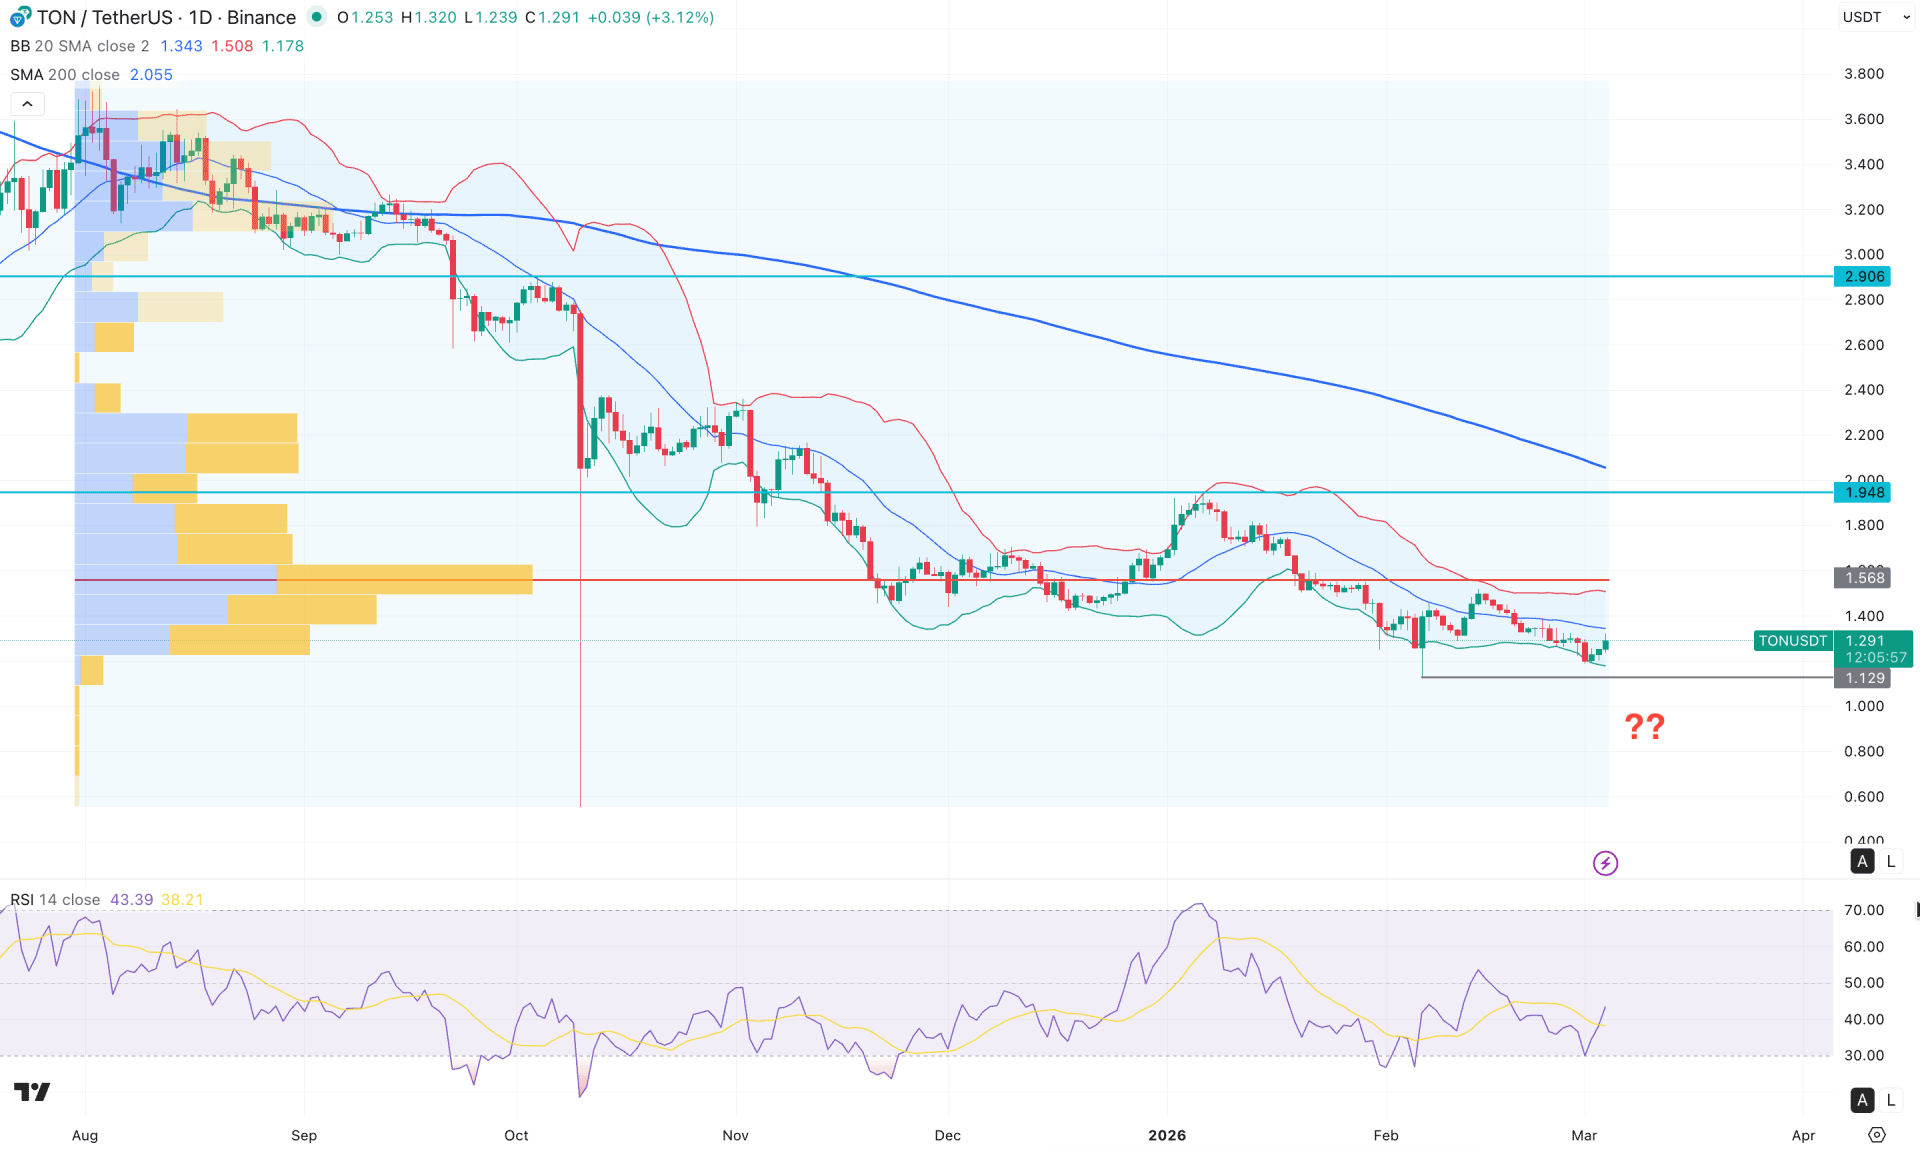
In the daily chart of TON/USDT, the major market momentum is bearish, as no significant bullish pressure has been visible since the beginning of 2026. Primarily, investors might consider this a continuation opportunity; however, a higher bottom formation could reverse the momentum at any time.
Looking at the higher timeframes, the monthly candle is strongly bearish, as the price continues to decline following an inside bar breakdown. Additionally, no valid support is present near the current price swing, which could be considered an additional warning sign for buyers. The weekly timeframe shows a similar structure, with the price declining in a base-drop-base formation.
Coming to the daily chart, the price is experiencing a minor bullish correction from the lower Bollinger Band, signalling mild profit-taking from the prevailing bearish trend. Moreover, the 200-day Simple Moving Average has a downward slope and is positioned above the 1.948 resistance level, which adds to the overall bearish outlook.
According to the volume structure, the most active level since August 2025 is around 1.568, which is above the current price. The gap between the current price and this high-volume level has widened, creating a potential bullish correction opportunity in the medium term. Additionally, the distance between the current price and the 200-day SMA has expanded, which may also support a temporary long opportunity despite the dominant bearish momentum.
In the indicator window, the Relative Strength Index (RSI) previously found support near the 30.00 level and bounced from the oversold region. However, the RSI remains below the 50.00 neutral line, signalling that the market is still within sellers' territory.
Based on this outlook, investors should closely monitor price behaviour around the middle Bollinger Band, as it may act as a crucial resistance level. Any bearish rejection from the mid-band could present a short opportunity targeting the 1.1290 level.
On the other hand, a broader bullish correction could extend toward the 1.5680 high-volume level; however, a bullish breakout followed by consolidation above the 1.6000 level would be required before targeting the 2.0000 psychological resistance.
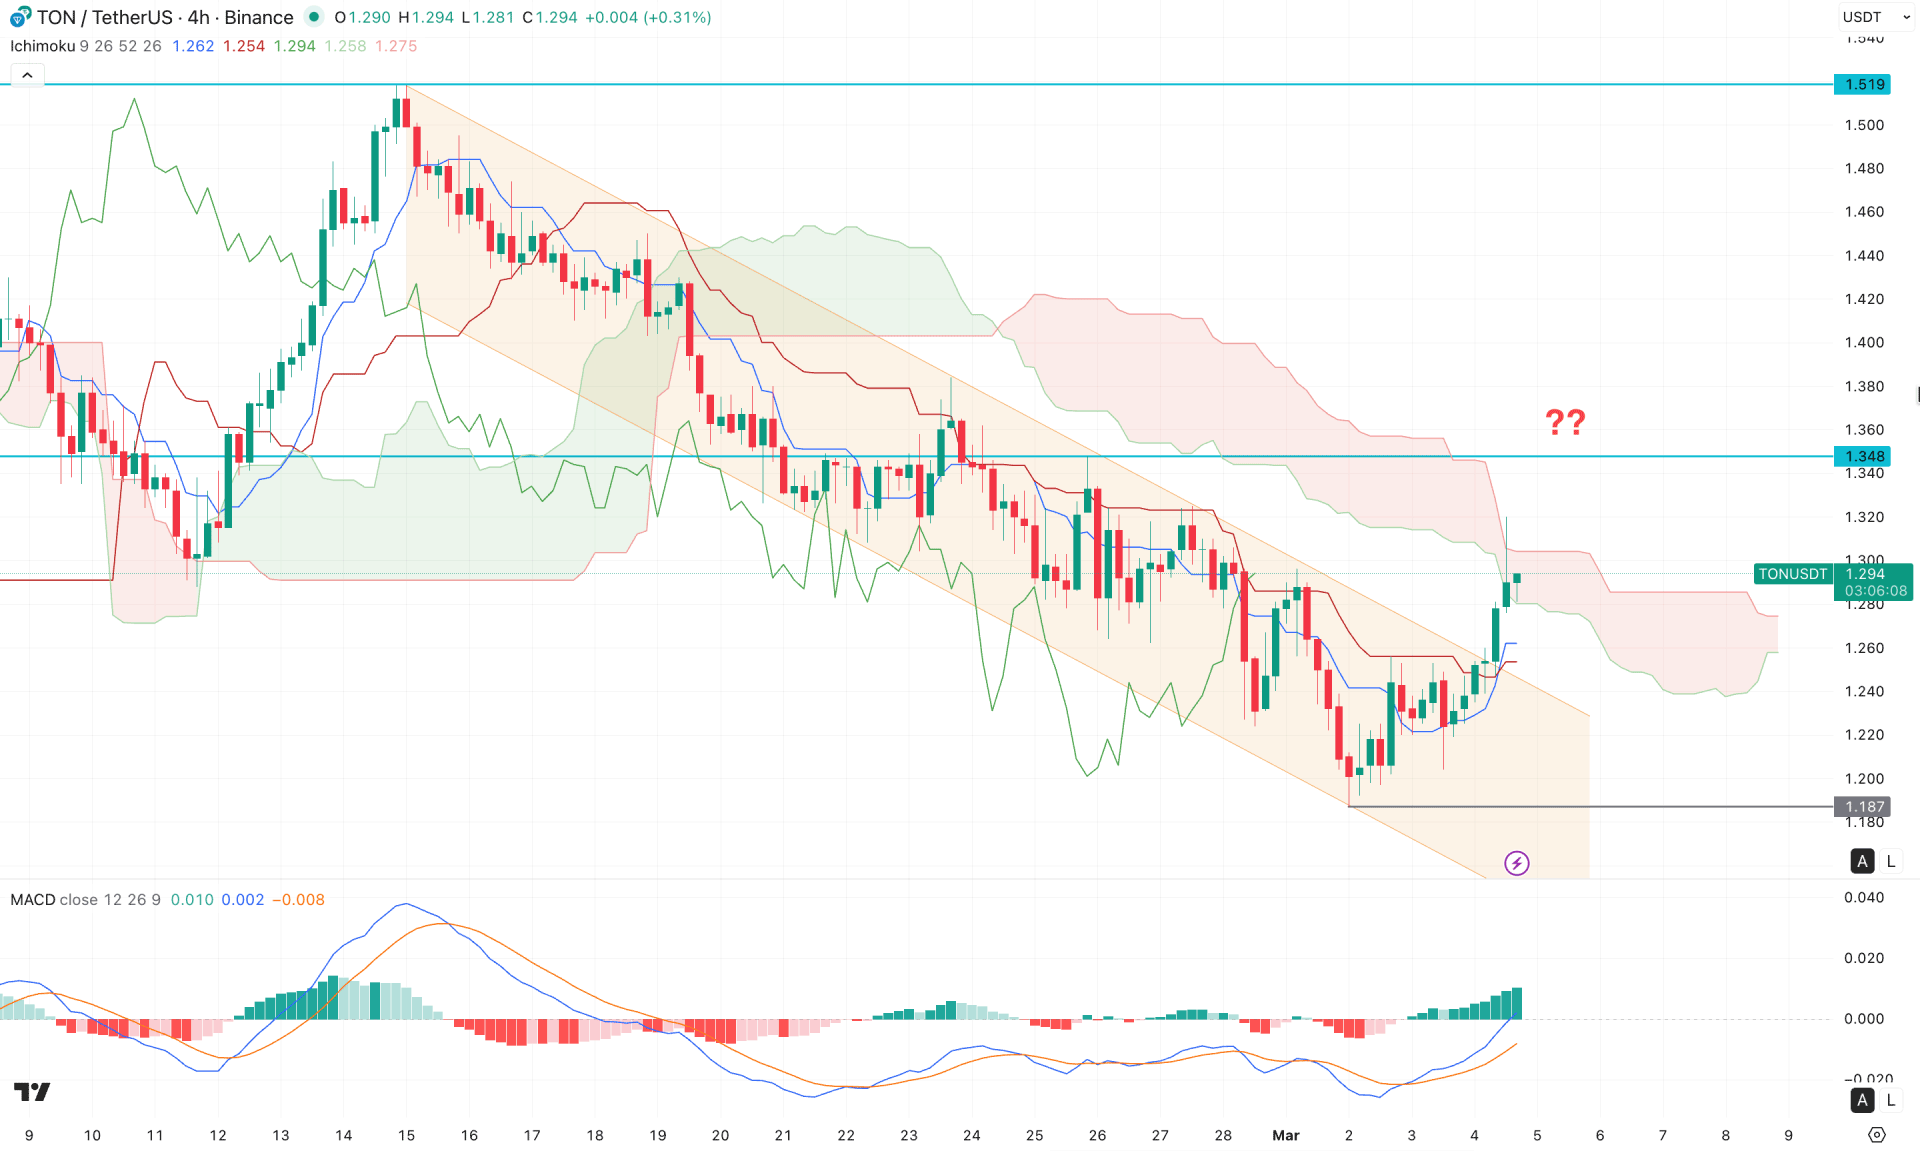
In the H4 timeframe, the price is still trading below the cloud resistance, signalling persistent selling pressure in the market, despite a strong bullish breakout from the descending channel. The future cloud has flipped, and both leading spans have compressed, indicating market indecision.
In the indicator window, the MACD histogram shows ongoing bullish pressure, maintaining positive momentum for a considerable period.
Based on this outlook, the immediate resistance stands at 1.3480, which could be tested before the price resumes its downward movement. However, a bullish breakout above the cloud area followed by short-term consolidation would signal increased buying pressure, potentially pushing the price beyond the 1.5000 psychological level.
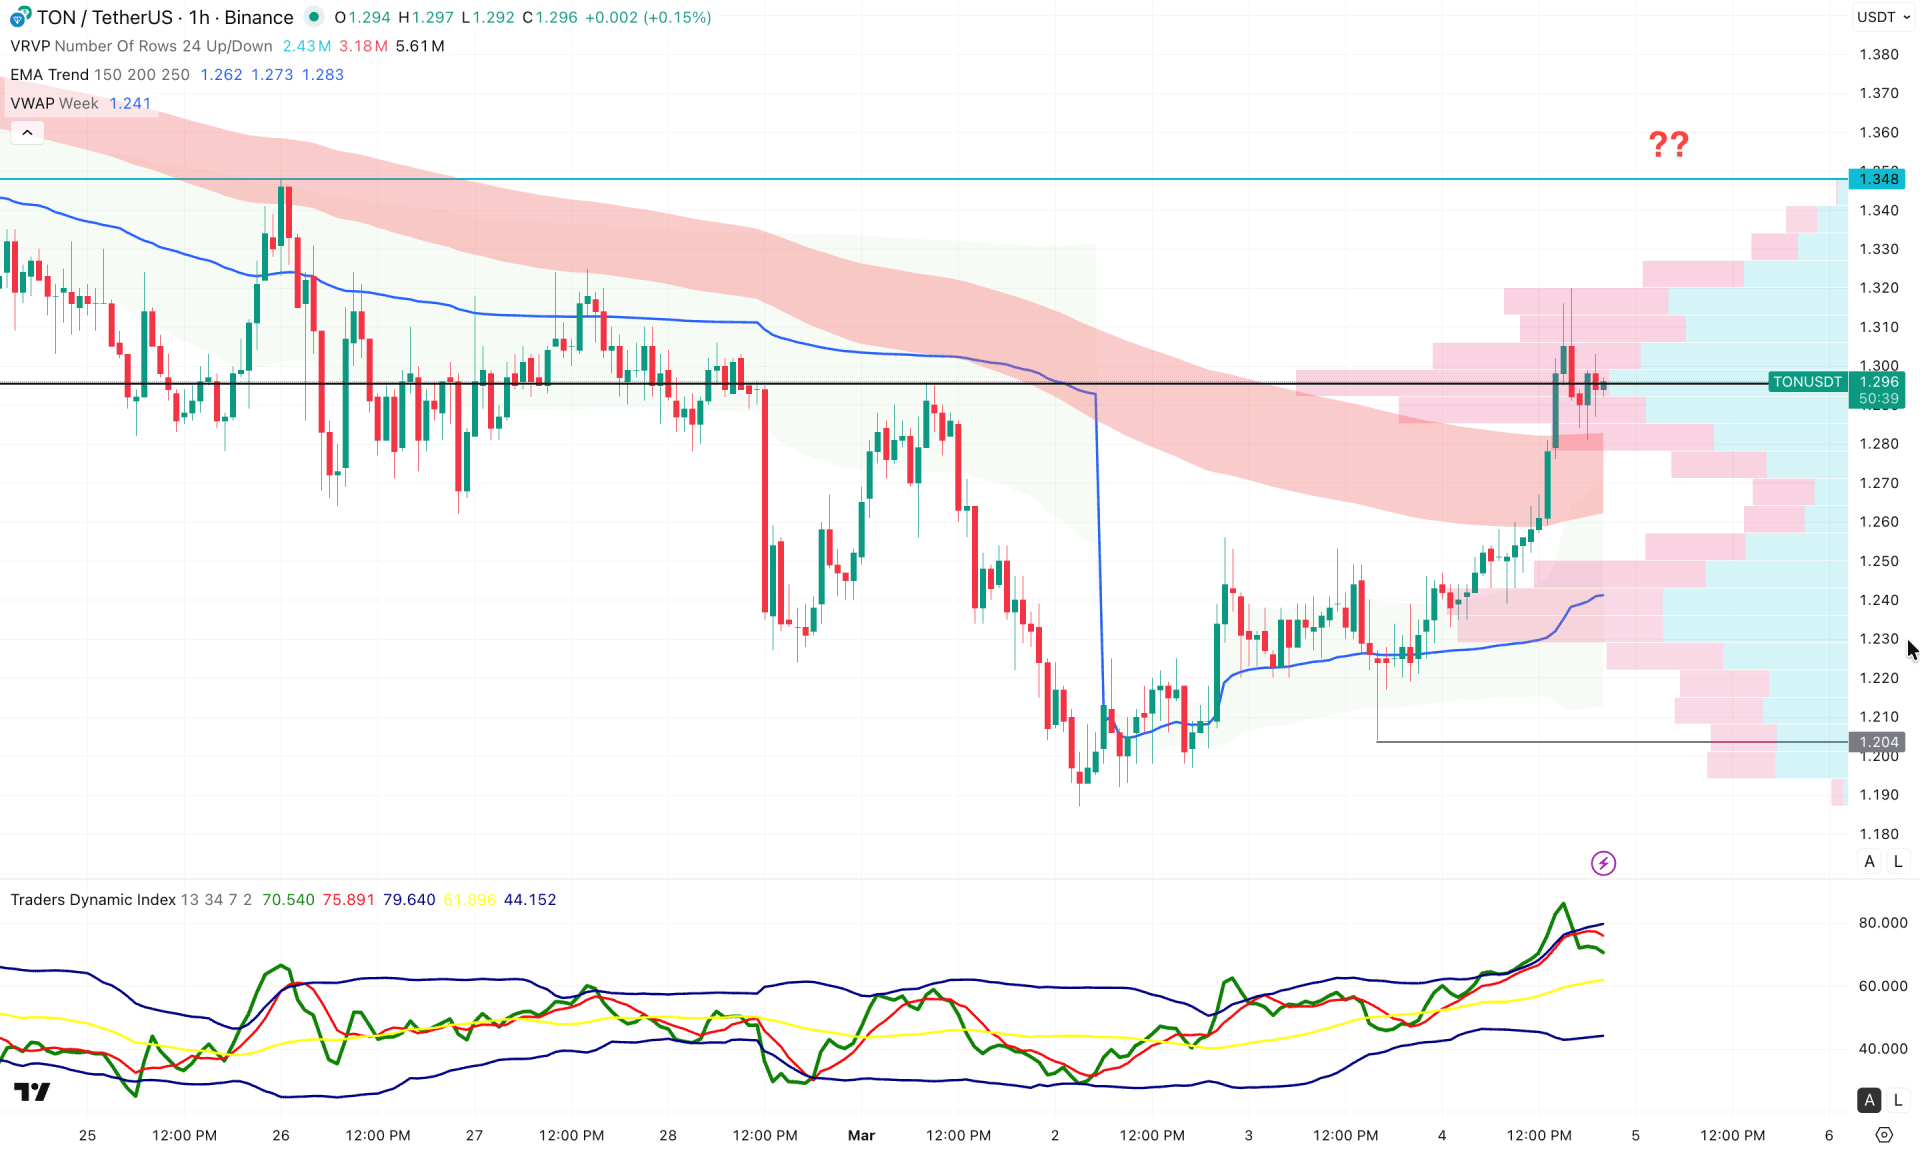
In the hourly timeframe, the price is experiencing strong bullish pressure on the intraday chart, with multiple hourly candles closing above the Exponential Moving Average wave. As a result, the gap between the price and the dynamic VWAP has widened, creating the possibility of a minor downside correction.
In the indicator window, the Traders Dynamic Index (TDI) has reached an extreme bullish condition, with a rebound observed from the 80.00 level. Since the current TDI reading remains above the 50.00 neutral line, bullish strength may continue in the short term.
Based on this outlook, investors should monitor how the price completes the minor downside correction. A corrective sideways consolidation, supported by dynamic support from the EMA, could present a potential long opportunity targeting the 1.3480–1.3500 region.
On the other hand, failure to maintain momentum above the 1.3000 level, followed by the formation of a new swing low, could create a bearish opportunity targeting the 1.2040 support level.
Based on the overall market structure, TON/USDT is trading in an extended condition at the current price, testing traders' patience. Investors should closely observe how the current price action develops. A valid rebound from a reliable support zone could provide a continuation setup; however, confirmation through structure and momentum is essential before entering any position.


