Published: June 18th, 2024
This cycle, Toncoin (TON), the native token of The Open Network, has demonstrated exceptional performance. The token achieved a new all-time high (ATH) and surpassed Ethereum in terms of active users this week. According to market analysts, this breach could potentially facilitate a rally toward the $10 threshold.
In a recent prediction, crypto analyst Ali Martinez noted the ascending triangle pattern on Toncoin's chart and suggested a potential 40% increase above the $10 price range, indicating a significant breakout for the cryptocurrency.
Numerous crypto analysts have observed TON's recent performance, with several anticipating a double-digit target for the summer. The bullish sentiment has prompted analysts such as Martinez and Daan Crypto to establish their next target for TON above $10.
Some community members think that Toncoin has the potential to become the next Solana (SOL), as its performance is similar to that of SOL during the previous cycle. Crypto trader ImNotTheWolf predicted that "TON will become the new SOL, in terms of gains potential."
An additional market observer underscored TON's market strength. WiseAnalyse proposed that TON is "the only strong chart out there" due to its real-world use and adoption. Toncoin recently surpassed Ethereum (ETH) in daily active addresses. This accomplishment is attributed to its incorporation with Telegram and its 900 million user base.
Unchained also addressed the potential of The Open Network blockchain to become the next Solana, emphasizing the community's optimism and TON's performance despite its distance from Solana.
Let's see the further aspect of this coin from the TON/USDT technical analysis:
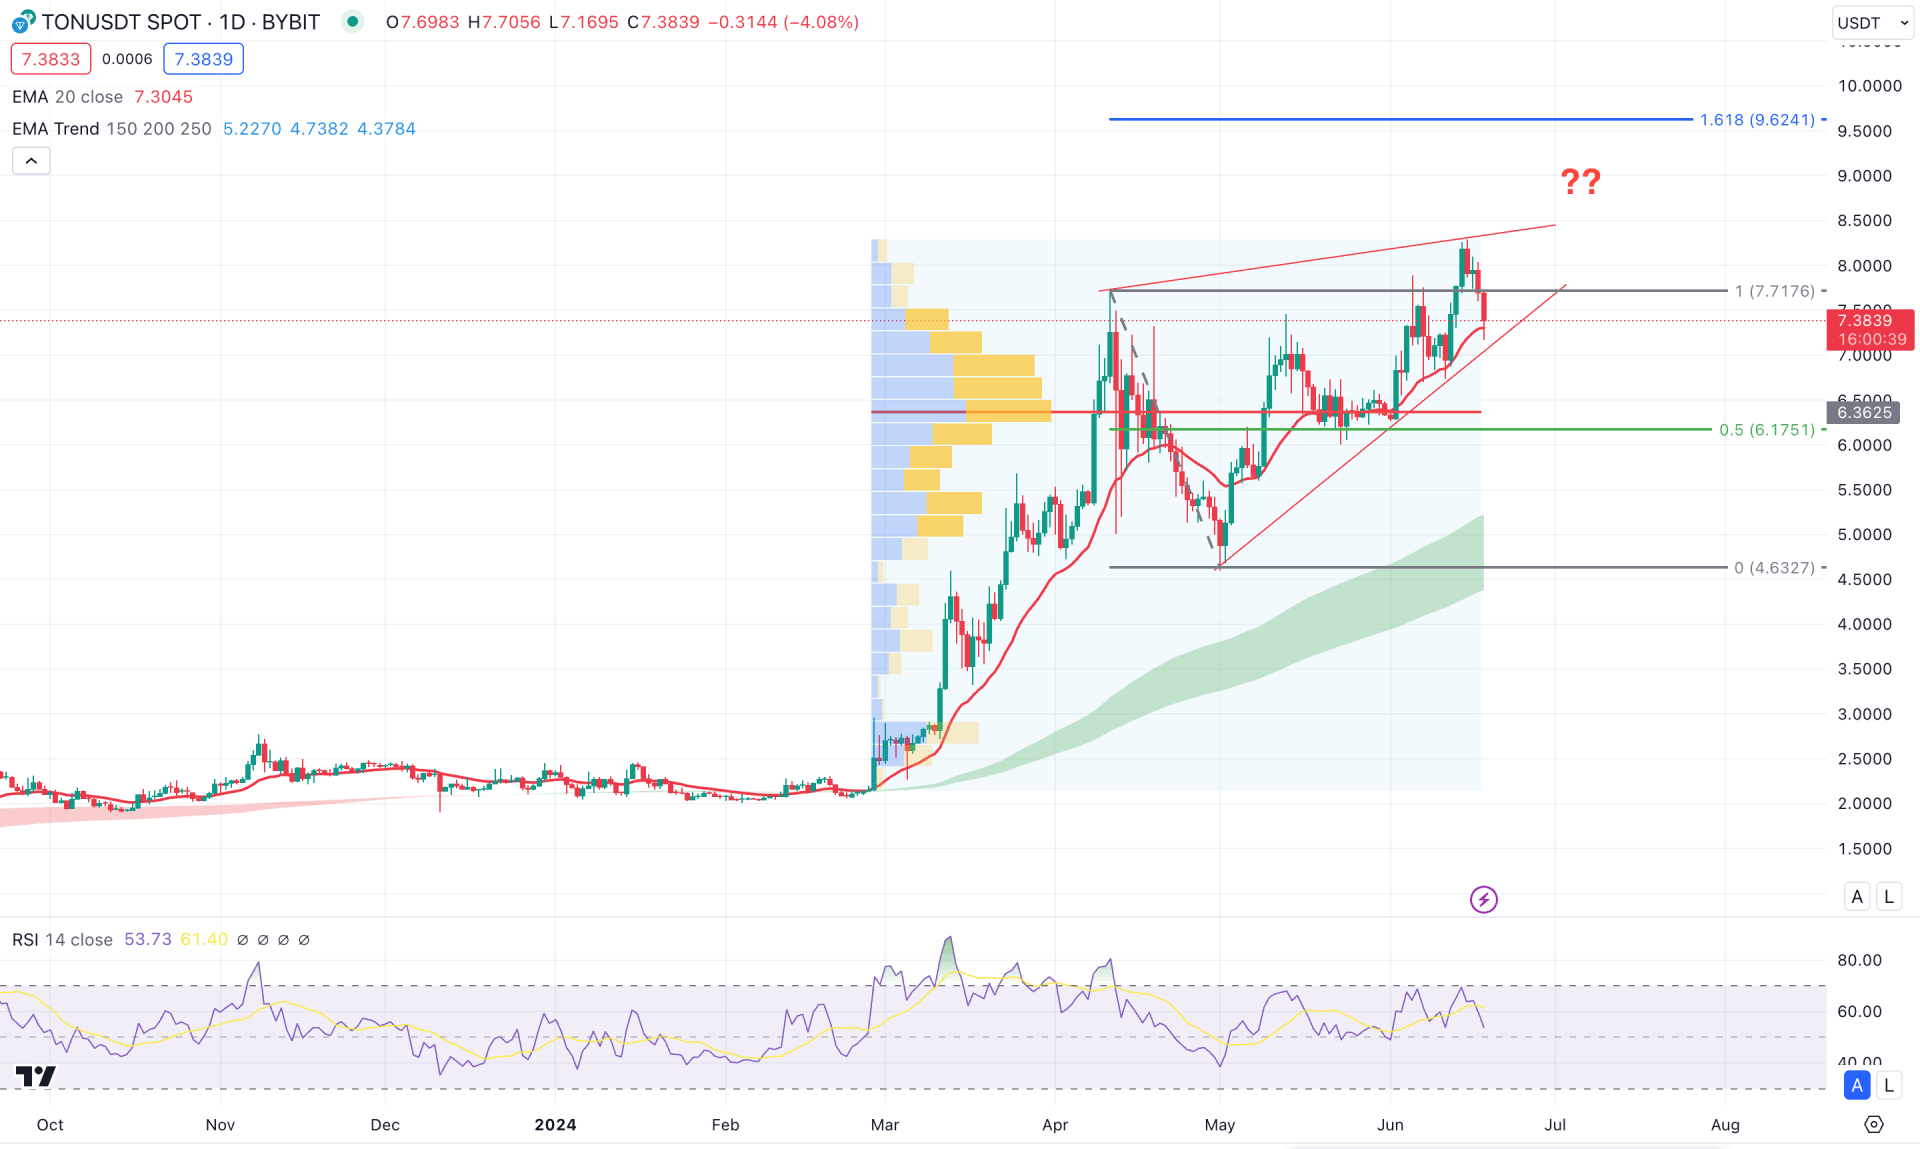
In the daily chart of TON/USDT, ongoing bullish pressure has been seen since March 2024, taking the price to the 7.771 level with a 282% gain. Moreover, the price made several lower highs within the bullish momentum, creating bases. In that case, a downside correction is potent in this pair, which needs a proper violation from near-term levels.
In the higher timeframe, the running monthly candle still trades bullish, where the most recent price failed to hold momentum above the May 2024 high. Moreover, the ongoing bearish candle is visible in the weekly price, which still remains as an inside bar. In that case, a downside continuation might come after having a solid break below the 6.7190 weekly support.
The higher volatility since April 2024 remains below the current price in the volume structure, suggesting that bulls are still active in the market. In that case, a downside correction is only valid once the recent price comes below the 6.3625 high volume line.
In the daily chart, the Moving Average wave for 150 to 250 MA remains stable below the current price with a bullish slope. In that case, a downside possibility could be limited as long-term traders are still bullish. However, the most recent price action shows a potential bearish possibility from the rising wedge pattern, where the dynamic 20-day EMA is the immediate support.
Meanwhile, the Relative Strength Index (RSI) hovers below the 70.00 line and has failed to break above this point for the third consecutive time since May 2024.
Based on the current daily outlook of TON/USDT, bears have a higher possibility of taking the price down as a mean reversion to the 5.0000 area. In that case, a valid rising wedge breakout with a daily candle below the 6.3625 high volume line could validate the long-term bearish possibility, which might lower the price toward the 5.0000 area.
On the bullish side, the current price still trades above the 50% Fibonacci Retracement level from 4.6327 low to 7.7176 high, which is a crucial premium zone. In that case, a failure to take the price below the 6.1751 Fibonacci Level could sustain the buying pressure, aiming for the 9.6241 Fibonacci Extension level.
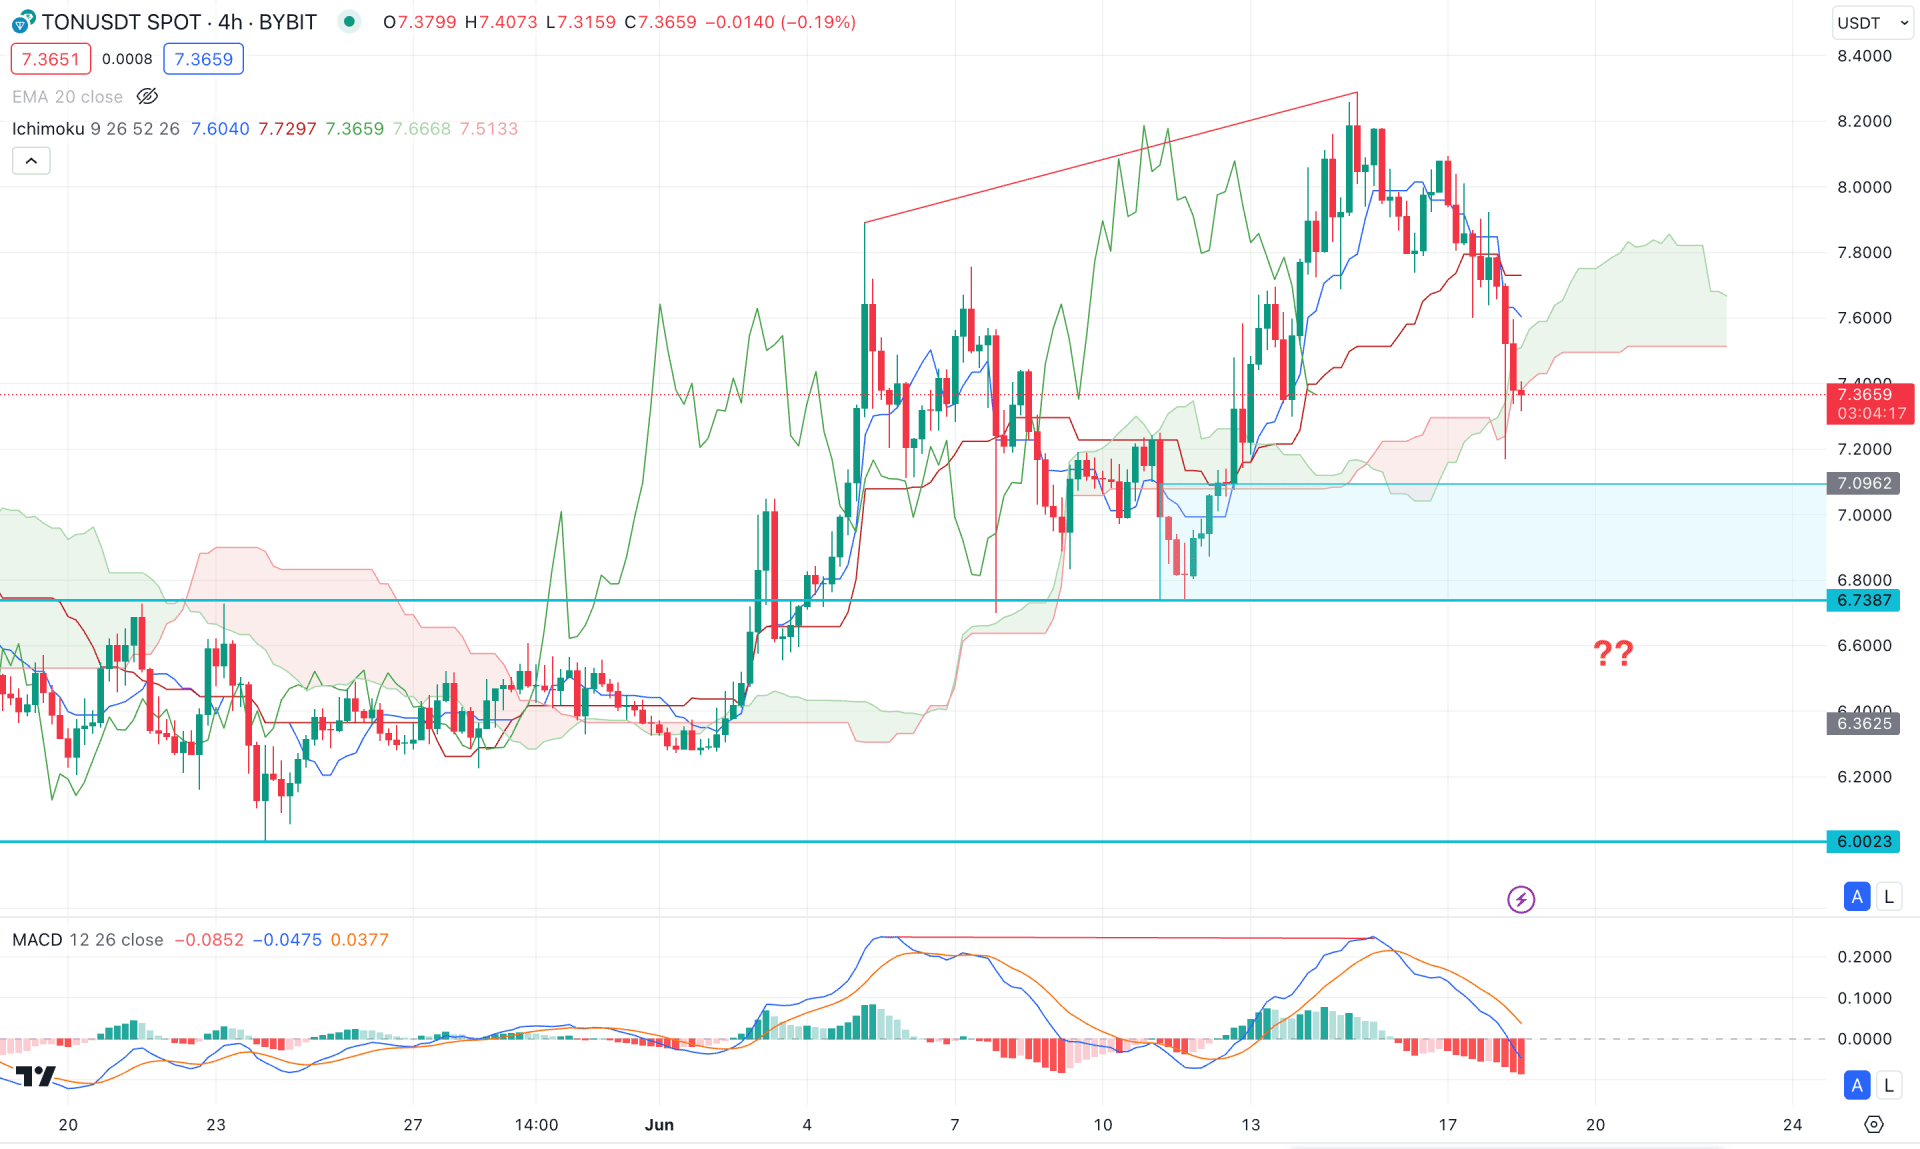
In the h4 timeframe, a bullish rally base rally formation is seen where the most recent price struggles to hold the momentum above the dynamic Cloud support. Moreover, the future cloud suggests a corrective momentum, where the Senkou Span A aimed lower, towards the flat Senkou Span B.
In the indicator window, the MACD Histogram reached the lowest level in a month, while the Signal line remained downwards at the neutral point.
Based on the H4 structure, the recent downside pressure might find a base at the 7.0962 to 6.7387 zone. A valid bullish reversal from this area with a stable market above the Kijun Sen level could activate the long signal, targeting the 8.4000 level.
On the other hand, the ongoing bearish pressure with an H4 candle below the 6.7000 level might invalidate the upward possibility and lower the price towards the 6.0000 area.
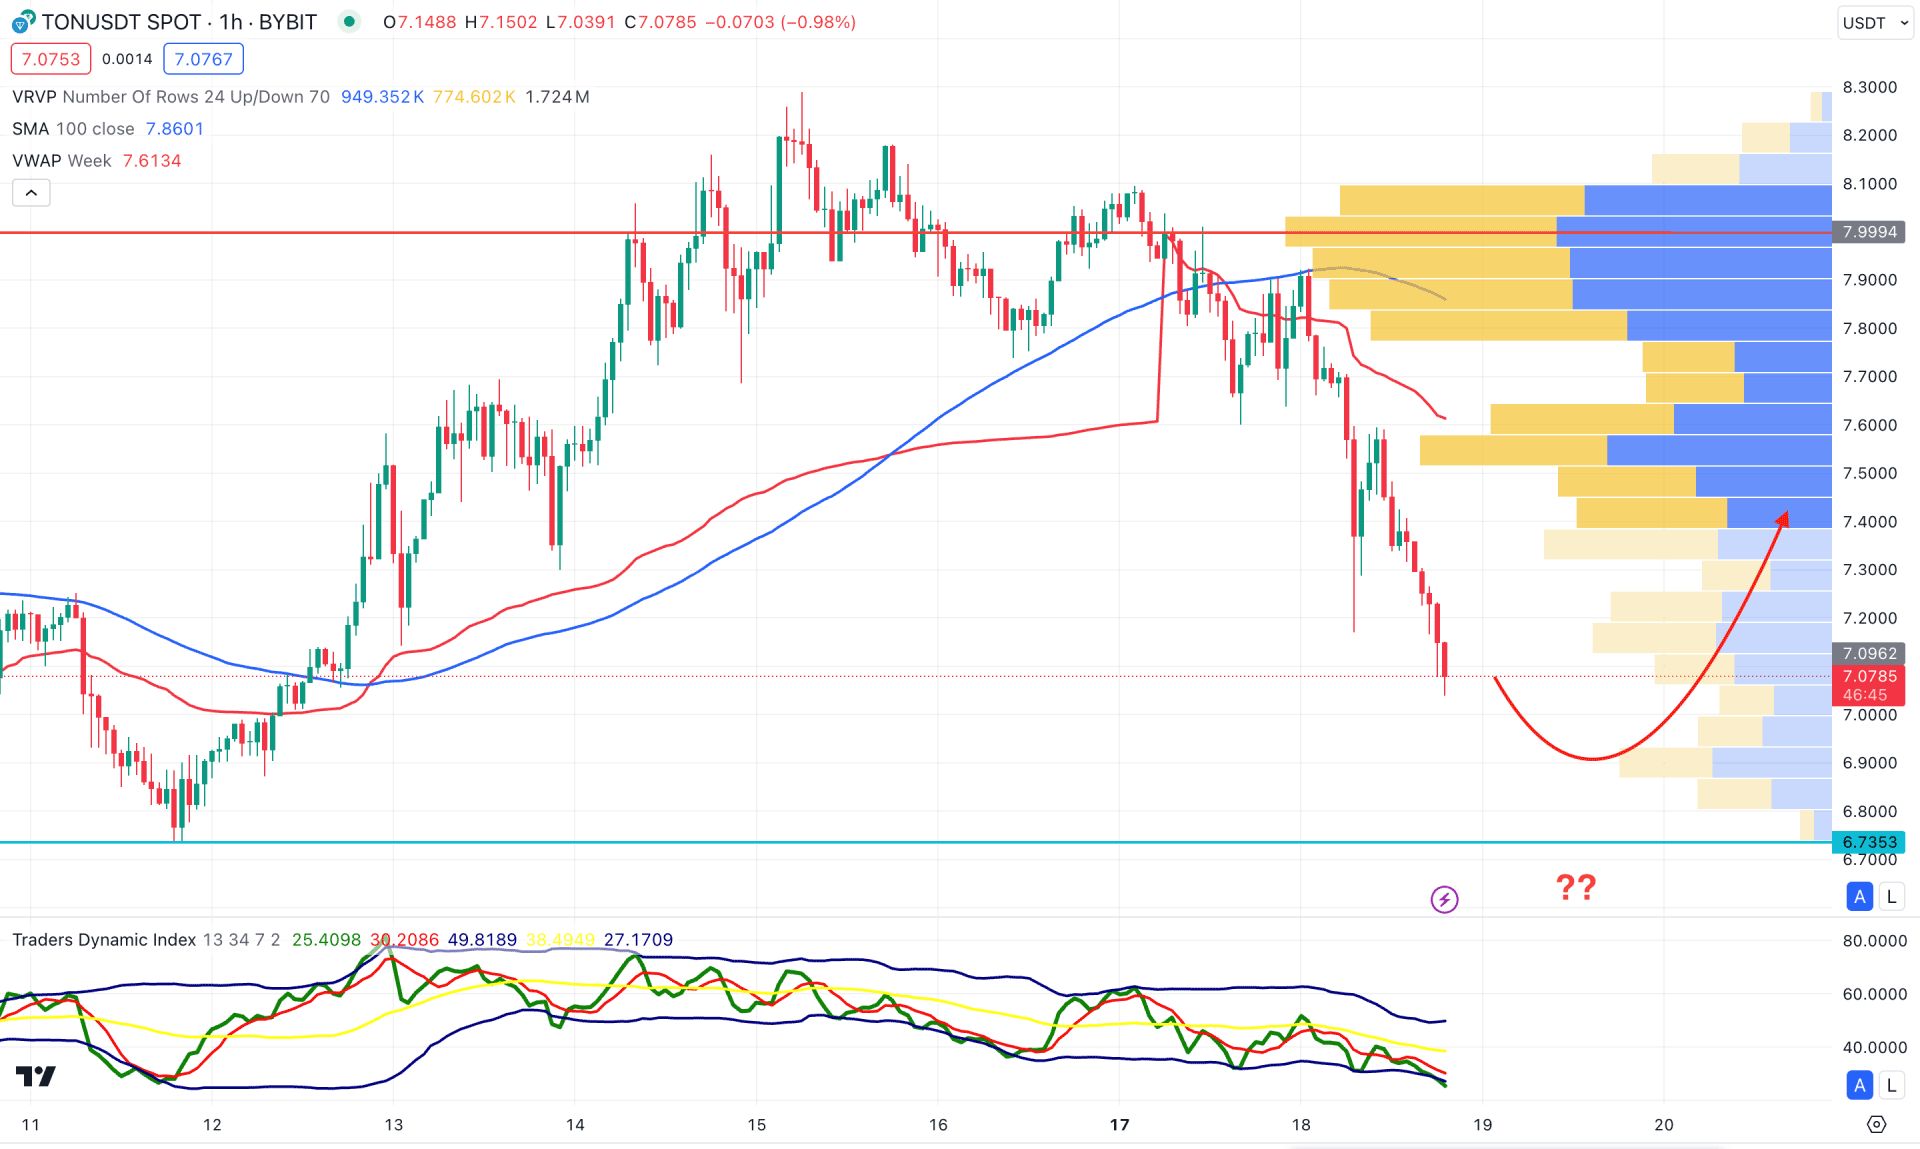
In the H1 chart, the recent price shows an impulsive bearish pressure from the top greeting a strong gap with the dynamic 100 SMA line. Meanwhile, the weekly VWAP level is above the current price, and working as a crucial resistance.
In the secondary window, an active bearish pressure is visible as the Traders Dynamic Index (TDI) reaches the lower band area. However, a solid bottom has not yet been formed as no significant buying pressure is visible in the price chart.
Based on the H1 structure, a considerable upward correction is pending, where the main aim would be to test the 100 SMA line before exiting the downside pressure.
Moreover, any extended downward pressure with a bullish exhaustion from the 6.7353 support level might alter the current structure at any time.
Based on the current market structure, TON/USDT is more likely to extend the bearish pressure after having a valid wedge breakout. However, the ongoing buying pressure is valid as long as the current price hovers above the wedge support.


