

Published: November 17th, 2026
TJX Companies (TJX) is expected to report growth in both revenue and earnings this week; analysts expect revenue to reach $15.8 billion, up 4.6% from the same quarter last year.
The consensus earnings estimate stands at $1.33 per share, unchanged over the past 30 days. This would reflect a 3.9% improvement from the year-ago quarter. TJX has also demonstrated a strong track record, delivering an average earnings surprise of 7.4% over the last four quarters.
The company's upcoming results are expected to reflect continued consumer demand for affordable, value-driven products and the strength of its off-price retail business model. Management noted that the quarter began on a positive note and forecast comparable sales growth of 2-3%. Revenue was projected to range between $15.6 billion and $15.8 billion, indicating annual growth of 3-5%.
TJX's HomeGoods, Canadian and international divisions are also expected to have contributed positively. It may have benefited from solid sales across decorative, seasonal, and everyday household categories. Meanwhile, customer engagement in Canada, Europe and Australia is likely to have supported international operations. Better merchandise execution at Marmaxx, highlighted by management at the start of the quarter, could also have helped strengthen sales.
In addition, cost management initiatives and operating efficiencies could have provided support to margins. TJX had forecast an adjusted pretax profit margin of 12.3-12.4% and adjusted earnings per share of $1.30-$1.32 for the quarter.
Despite these positive factors, rising fuel and freight expenses remain potential challenges. Management projected an adjusted gross margin of 32.1-32.2% for the third quarter, indicating a year-over-year decline of 40-50 basis points.
Let's see the full outlook of this stock from the TJX price analysis:
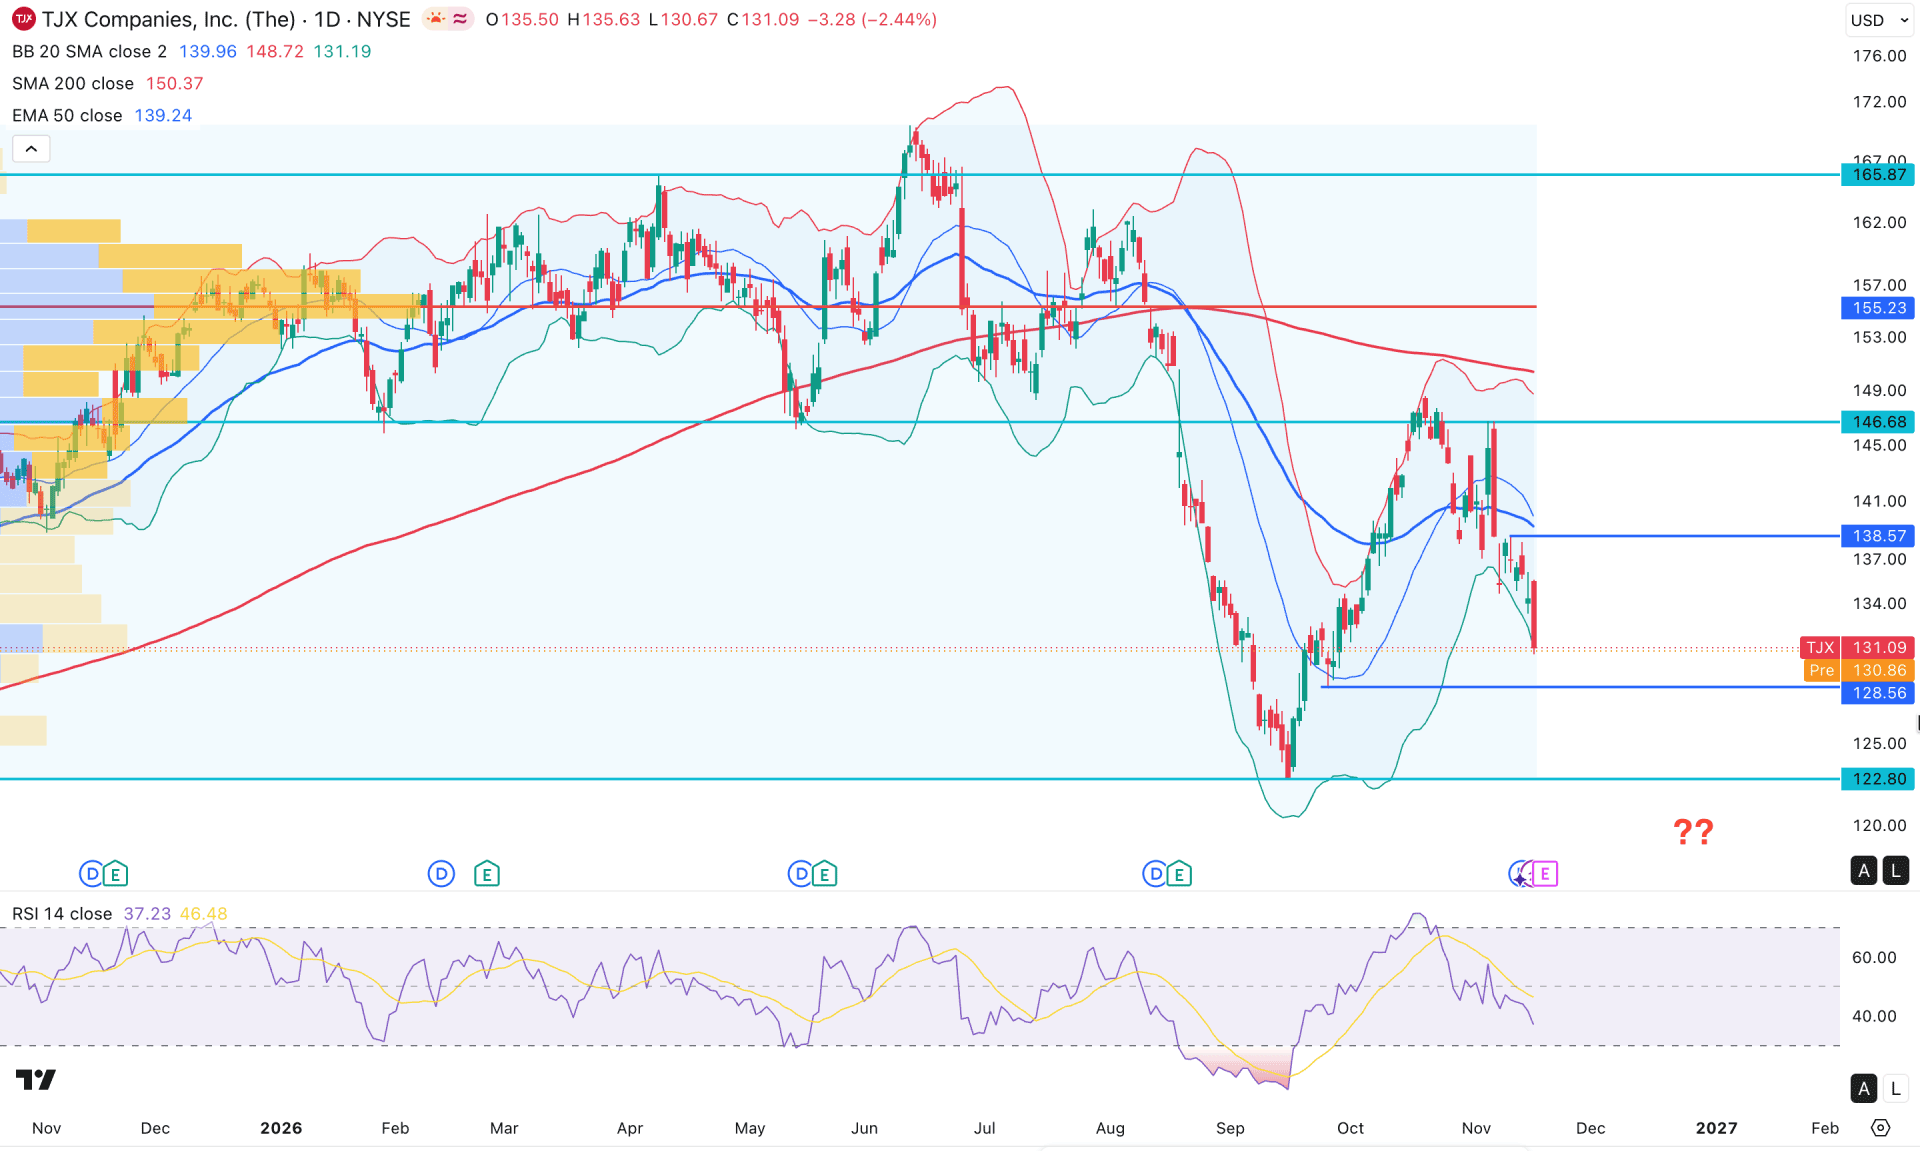
In the daily chart of TJX Companies stock, the ongoing market pressure is bearish that came with a valid retest at the 146.68 event level. Primarily, the price is heading lower by creating multiple swing lows, which is signaling a downside continuation.
Looking at the monthly timeframe, the stock price is heading up for many years where the recent downside correction from the all-time high level is insignificant. However, the running monthly candle is bearish with a new swing low formation below the October 2026 high, signaling selling pressure. The weekly timeframe shows a similar structure where consecutive five candles are visible after a minor bullish recovery.
In terms of volume, the most significant level since September 2025 is at the 155.23 level, which is above the current price. Moreover, the high volume line has come with a consolidation at the all-time high area, signaling a possible bearish activity at the premium trading zone. Primarily, the price is trading below the high volume line with no significant high volume activity at the 122.80 swing high, signaling bearish pressure on buyers.
In the main price chart, the 200-day SMA and 50-day EMA are above the current price and having a bearish slope. Primarily, the price is trading below the crucial dynamic resistance line, signaling an active selling pressure in the market.
On the other hand, the most recent price is testing the lower Bollinger Bands line with the gap between lower and middle Bollinger Band Lines. Moreover, Bollinger Bands levels have expanded, creating a minor bullish correction possibility. However, the entire structure remains bearish as long as it hovers below middle Bollinger Bands resistance line.
In the secondary indicator window, the RSI rebounded its position after testing the 70.00 level. Currently, the line is hovering below the 50.00 neutral line with no sign of an upward movement.
Based on the overall market structure, TJX price is trading within a bearish structure where the immediate support level to look at is 128.56 level. On the bullish side, a liquidity grab from 128.56 area with a bullish daily close above the 138.57 level could be a high-probability long opportunity targeting the 155.23 level. However, an extended downside move could grab significant liquidity from 122.80 swing low before rebounding the trend.
In that case, the ongoing selling pressure is bearish as long as the price hovers below 138.57 level, where the ultimate target would be to test the 122.80 key support level.
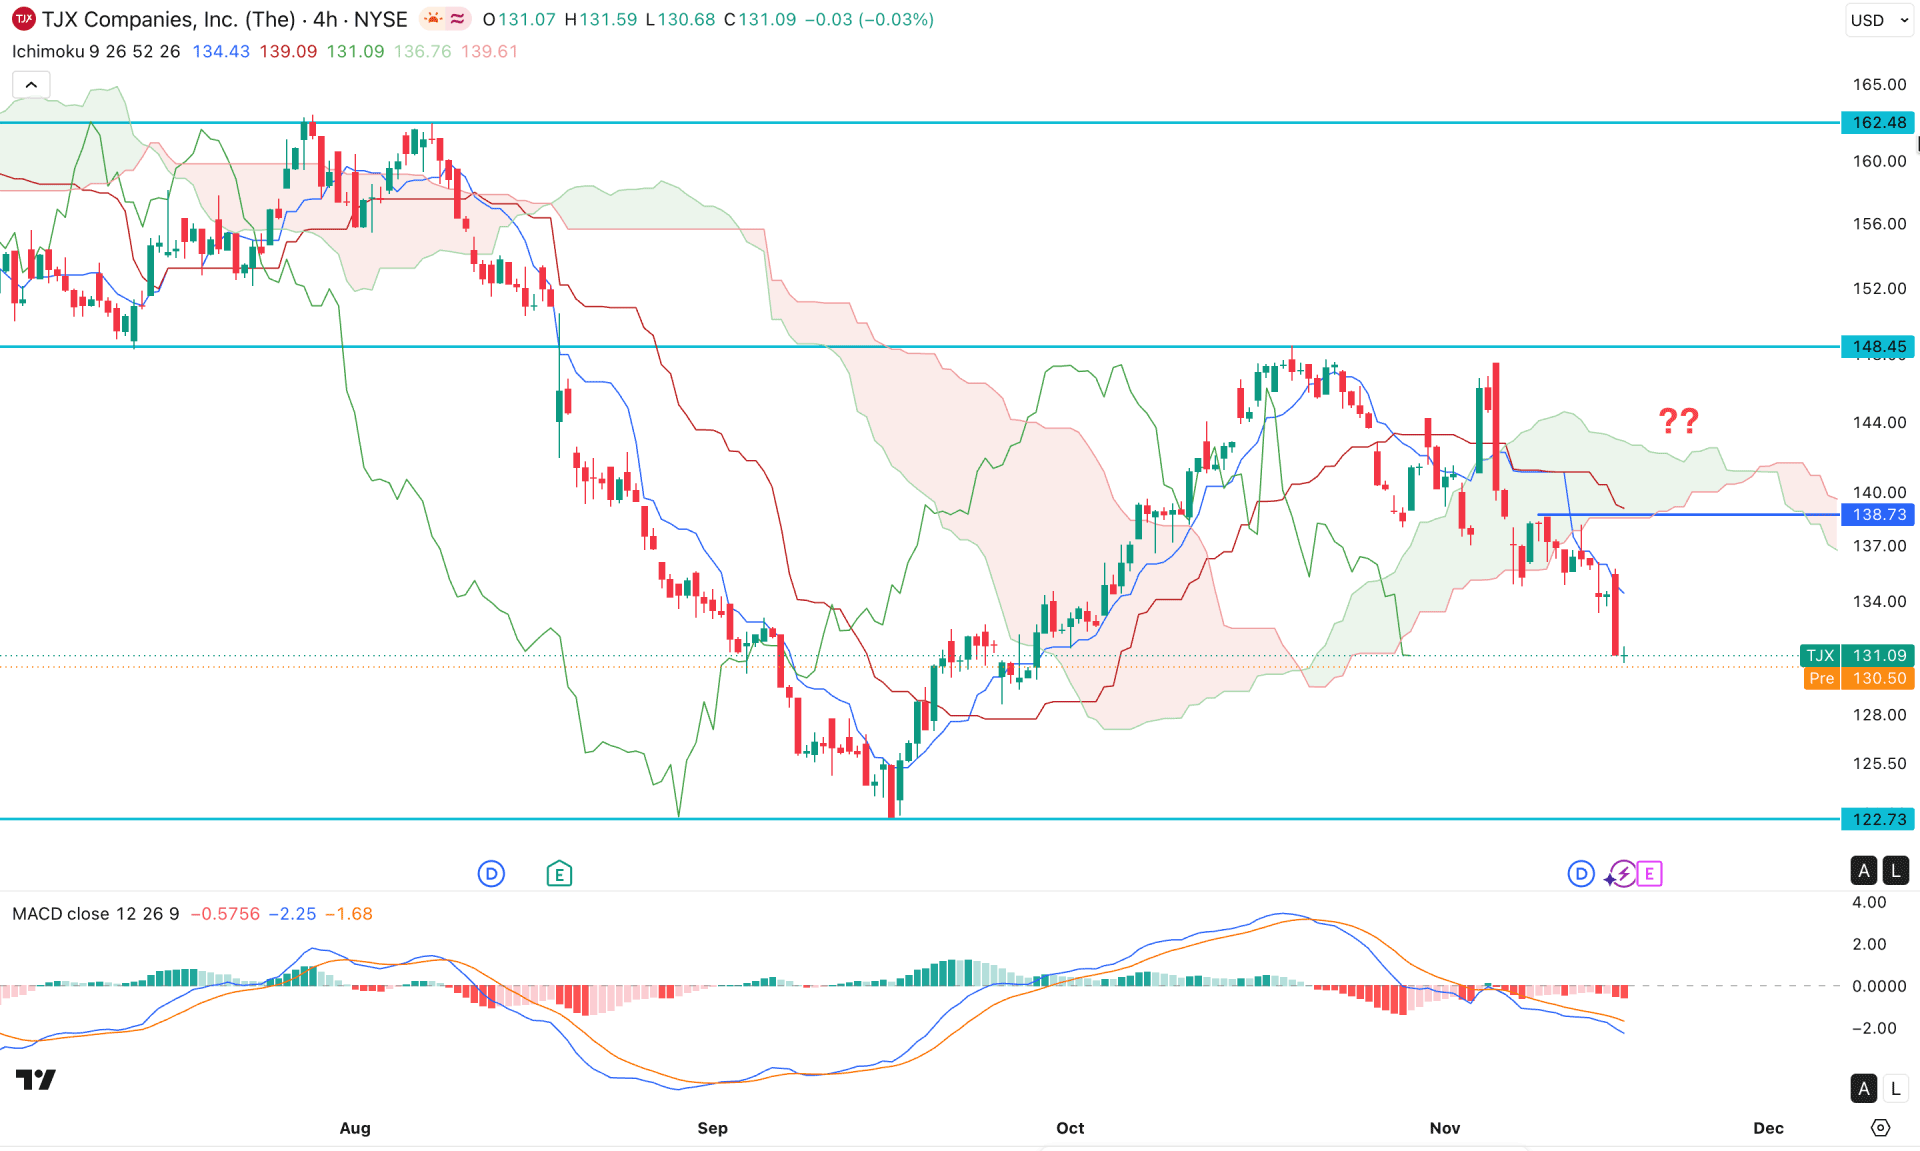
In the four-hour timeframe, TJX is trading within a bearish trend phase. The ongoing downside pressure is valid below the Kumo cloud resistance. The price keeps moving lower with a bearish break below the Kumo cloud, though a minor bullish correction is pending.
In the future cloud, the market position is bearish as the cloud resistance flipped the position taking the Senkou Span A below the Senkou Span B.
In the indicator window, the MACD histogram remains bearish for consecutive 14 days, signaling an active selling pressure in the market. However, the signal line has reached the bearish peak from which a bearish downward extension could form.
Based on the four-hour market structure, the recent selling pressure could find a relief as a mean reversion where the Kijun-sen resistance level is above the near-term swing high. However, as long as the price remains below the cloud resistance, the immediate support level to look at is 122.73 level.
An alternative approach is to find an immediate bullish rebound above the 138.73 level with a consolidation above this line that could increase the possibility of creating a new swing high above the 148.45 resistance level.
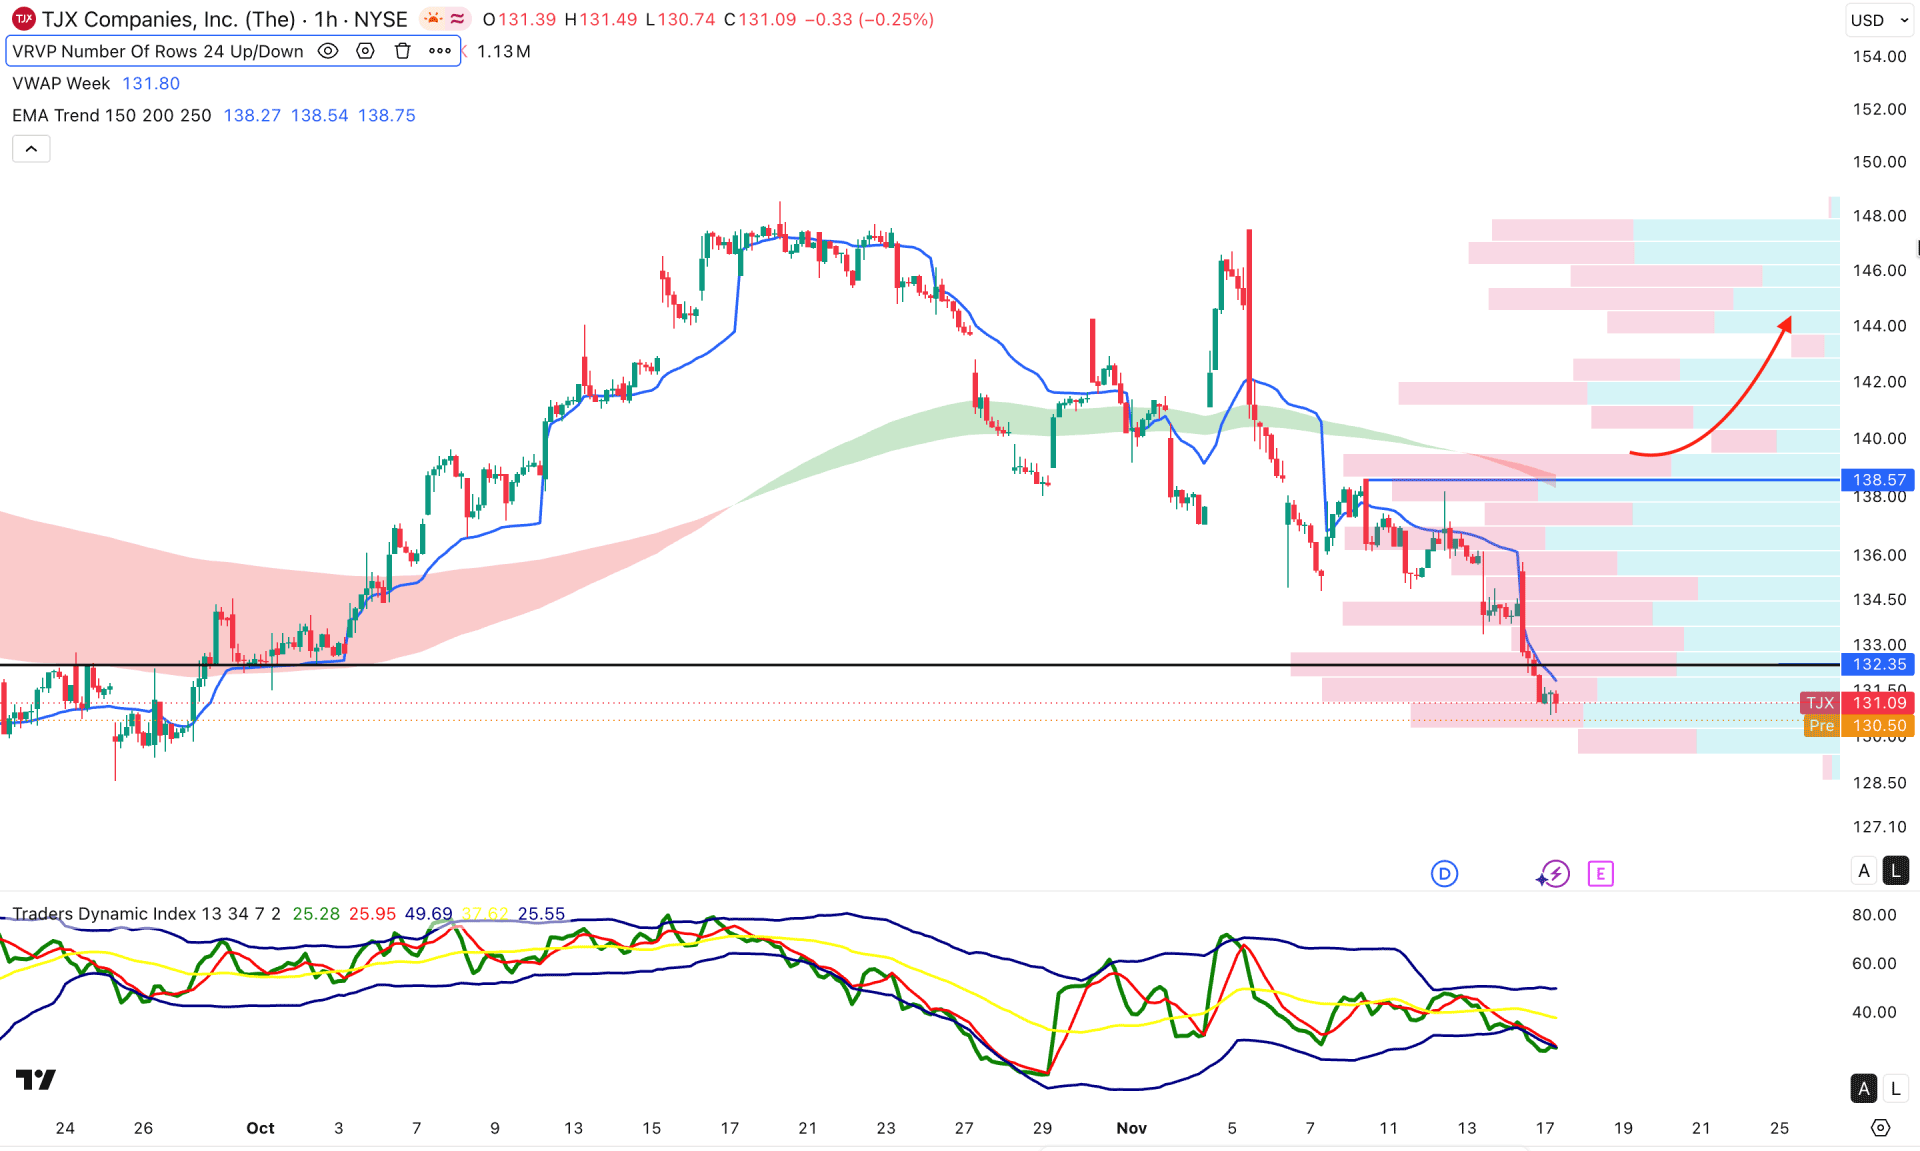
In the H1 timeframe of TJX, an extended bearish continuation is visible as the current price is below the 132.35 high volume line. Moreover, the weekly VWAP level is closer to the current price with a gap between the recent price and the EMA.
The main price shows a mixed structure where the gap with the current price and VWAP line suggest a possible bullish recovery. The Trader's Dynamic Index is showing a possible bullish rebound as the recent line rises from the bearish peak.
Based on this market structure, the ongoing downside pressure is valid as long as the price remains below the EMA wave. An immediate bullish rebound with the recovery above the 138.57 level could increase the possibility of testing the 148.00 area.
The alternative approach is to find a downside continuation after testing the weekly VWAP resistance level where the ultimate target would be to test the 128.00 psychological line.
Based on the overall market structure, TJX is trading within a possible downside continuation as the ongoing bearish trend came with a valid trend reversal. As the long-term market trend is still bullish, investors should monitor the intraday downside pressure from a valid bottom formation that could signal a possible recovery point.


