Published: September 28th, 2023
ThorChain is at the vanguard of the blockchain industry, offering an extensive suite of services that includes cross-chain lending, liquidity provision, aggregation, settlement, and seamless swaps. This platform empowers users to effortlessly engage in asset exchanges, borrowing, and earning opportunities with their native assets, such as Bitcoin, USDT, and Ethereum.
The total value locked (TVL) within the ThorChain ecosystem has surpassed $223 million, placing it as the thirteenth largest blockchain network according to data compiled by DeFi Llama. It surpasses notable chains such as Cardano, Acala, Fantom, Celo, and Algorand.
ThorChain also claims over $117 million in total liquidity, a user base of over 78,4k unique swappers, and an astounding total volume of over $13.8 billion. These metrics indicate substantial network growth despite the ongoing crypto market difficulties.
Moreover, ThorChain has maintained its token-burning practice. To perform token burning, tokens are placed in an inaccessible wallet, effectively removing them from circulation. Recent data reveals that cumulative token burning has surpassed 900k in the past few months, demonstrating the platform's dedication to increasing token scarcity and value.
Thorchain (RUNE) would be a great option if you are keen to invest in cryptocurrencies. Let's see the upcoming price direction of this token from the RUNE/USDT technical analysis:
In the daily price of RUNE/USDT, the overall market direction is bullish in the daily chart, which is supported by several bullish price patterns. In that case, the ideal trading approach in this pair is to seek long trades as long as it trades above the near-term critical levels.
In the monthly chart, the current price is trading at the important discounted zone, supported by a strong bullish monthly close. Moreover, the weekly time frame shows a bullish re-accumulation, which could result in a new higher high formation with impulsive pressure.
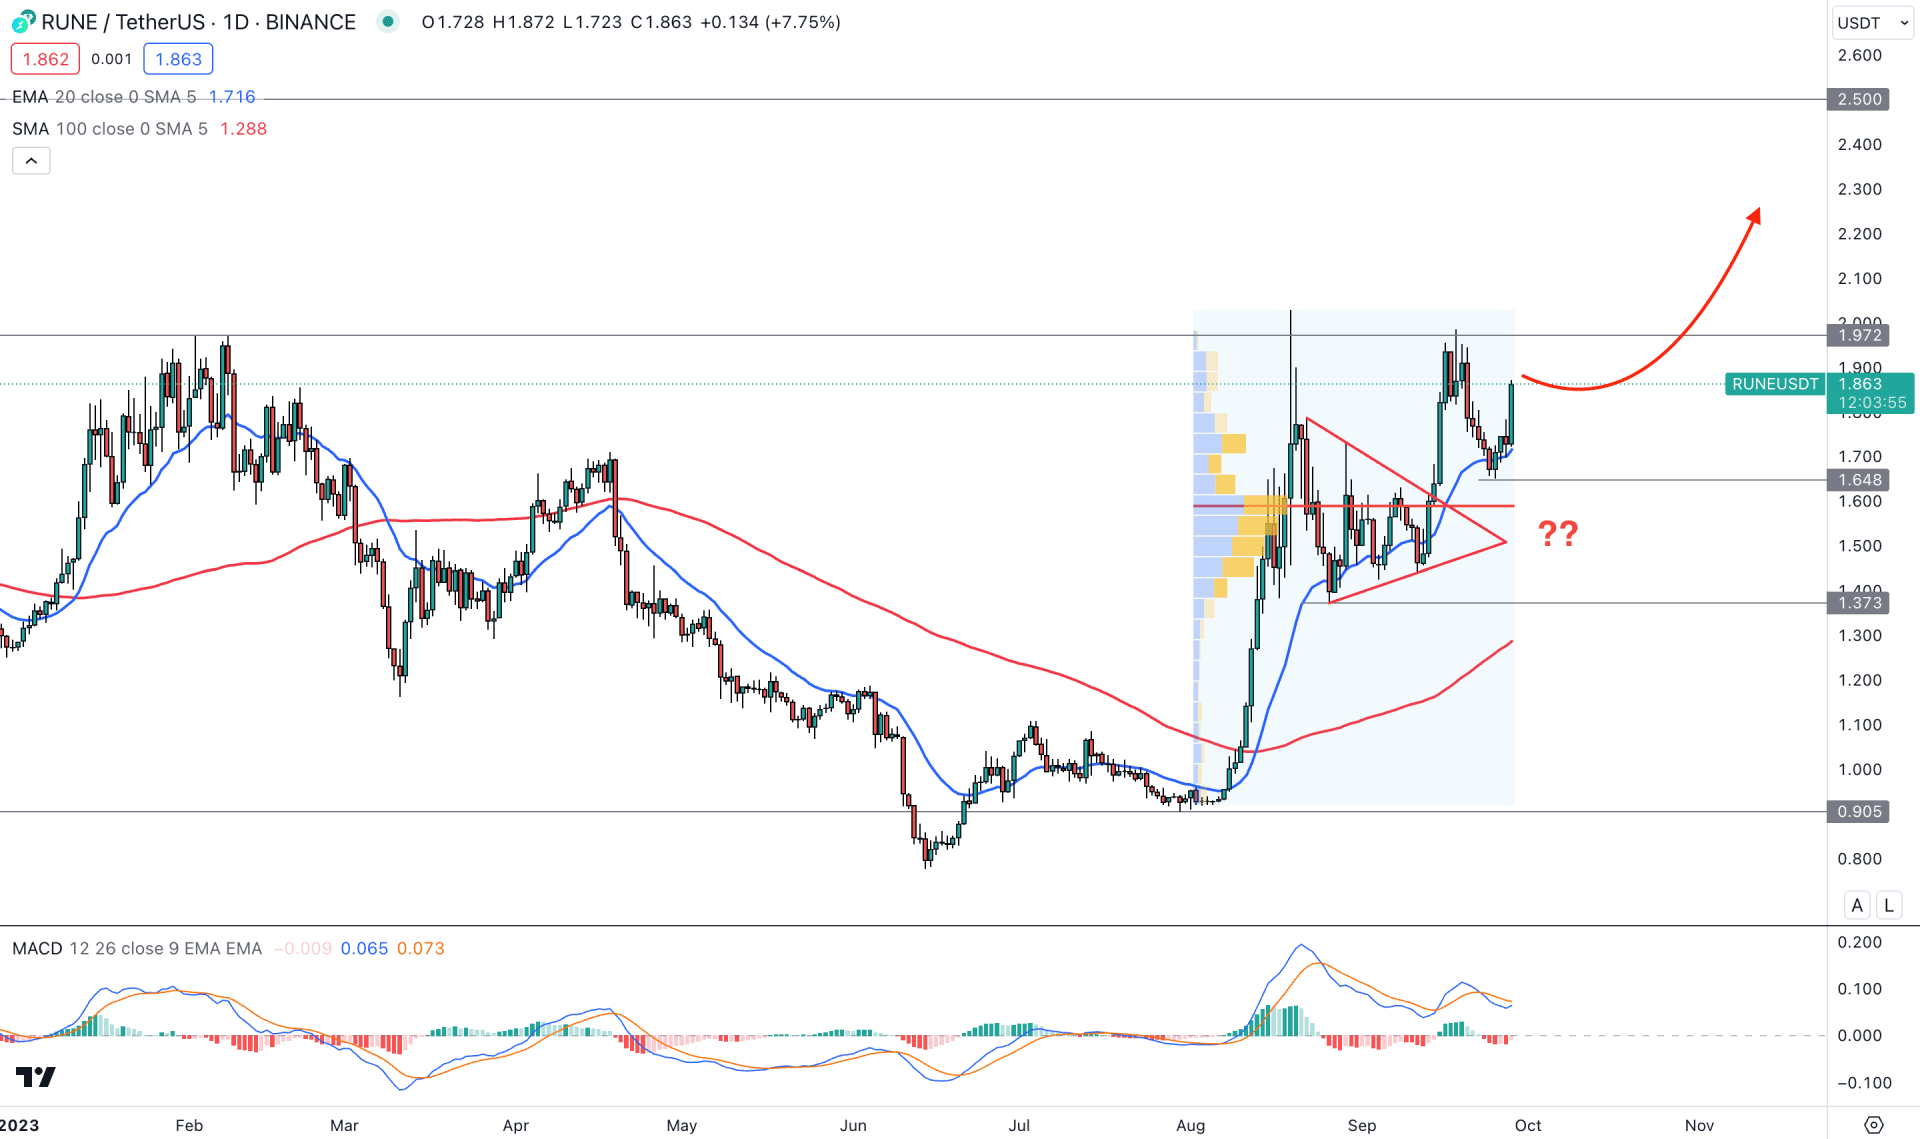
In the volume structure, the most active level since the 1 August 2023 low is at the 1.588 level, which is just below the current price. As the current price trades above this critical level, we may expect the buying pressure to continue in the coming days.
In the daily price, the overall market pressure is bullish as it trades above the 1.648 event level with a bullish pennant breakout. Moreover, the dynamic 20-day EMA worked as strong support at the 1.6480 level, which could work as a confluence of support to bulls.
In the secondary window, the overall market pressure is also bullish, as the current MACD signal line is above the neutral level with no sign of a divergence.
Based on the daily market outlook, a strong liquidity zone is present above the 1.972 level, which could be the primary target of the bull run. In that case, investors should closely monitor the intraday price chart, which could signal a bullish opportunity, targeting the 2.500 level.
On the bearish side, a bearish pressure with a daily candle below the 1.373 level could indicate the first sign of a bearish pressure, which could lower the price towards the 100-day SMA level.
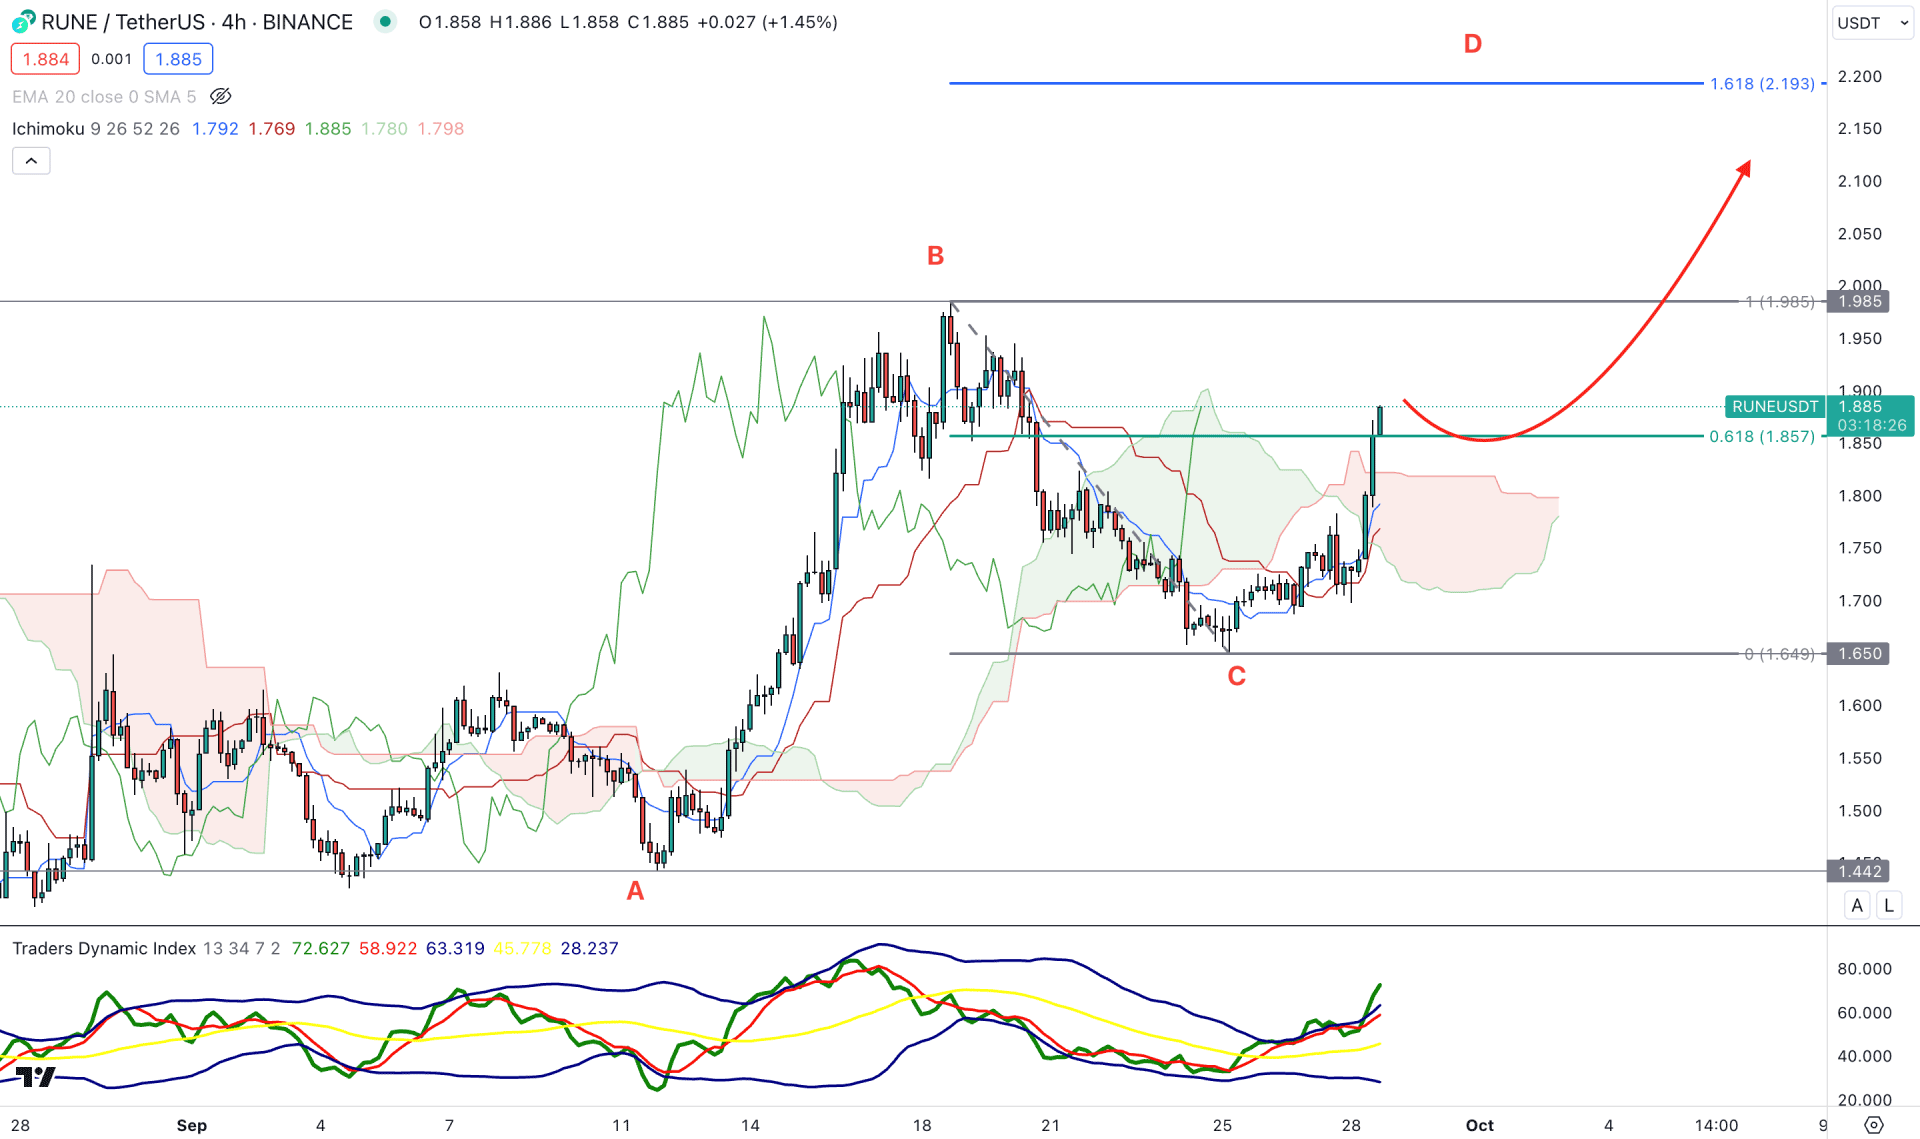
In the H4 chart, the overall market trend is corrective, but the recent bullish recovery with an impulsive pressure indicates a trend change. In the broader structure, A potential “ABCD” pattern is visible, where point D is at the 2.193 level, which is the 161.8% Fibonacci Extension level from the 1.985 high to 1.650 low.
In the market structure, the Ichimoku Cloud is below the current price, while there is a gap between the price and the dynamic Kijun Sen level.
In the indicator window, the TDI level is at an overbought level, which is a sign of a pending downside correction in the market.
Based on the H4 outlook, a bullish trend continuation opportunity is valid as long as the price trades above the 1.650 support level, which could increase the price toward the 2.200 level.
On the other hand, a bearish pressure with an H4 close below the 1.650 level could lower the price towards the 1.442 support level.
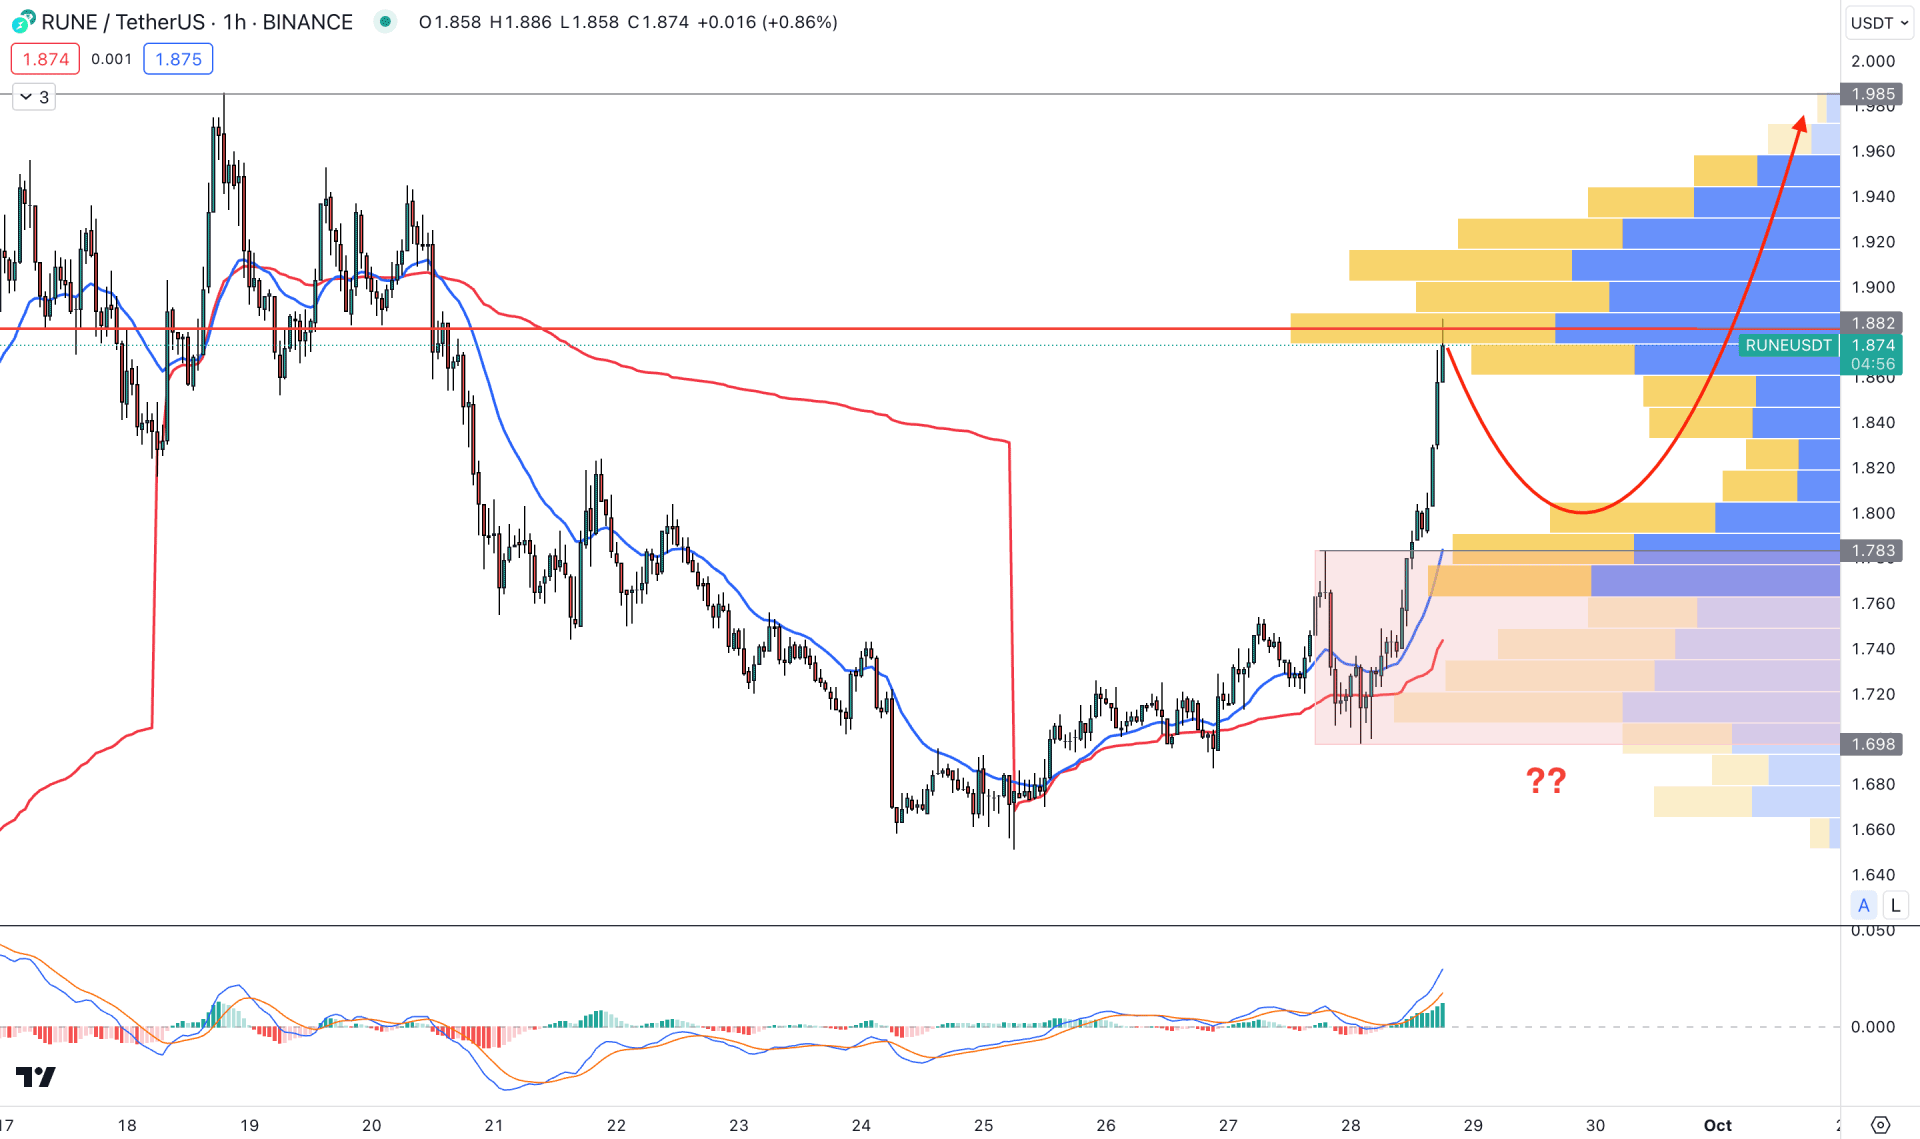
In the overall market outlook, the existing impulsive bullish momentum is questionable as the current Visible range high volume level is at 1.882 level. Moreover, the gap between the current price and dynamic 20 EMA has extended, which could result in a bearing possibility as a mean reversion.
In the indicator window, the current MACD Histogram is bullish, while the MACD signal line is at the overbought level.
Based on the current outlook, a bearish correction and bullish rejection from the 1.783 to 1.698 area could increase the price towards the 1.985 level. However, any bearish rejection from the current trading zone,1.882 to 1.985, could be a short-term bearish opportunity.
Based on the current market outlook, RUNE/USDT is trading within a strong, bullish pressure with more room to move upside. In that case, any short-term bullish opportunity from the near-term support areas could be a decent trend trading signal.