
Published: December 17th, 2020
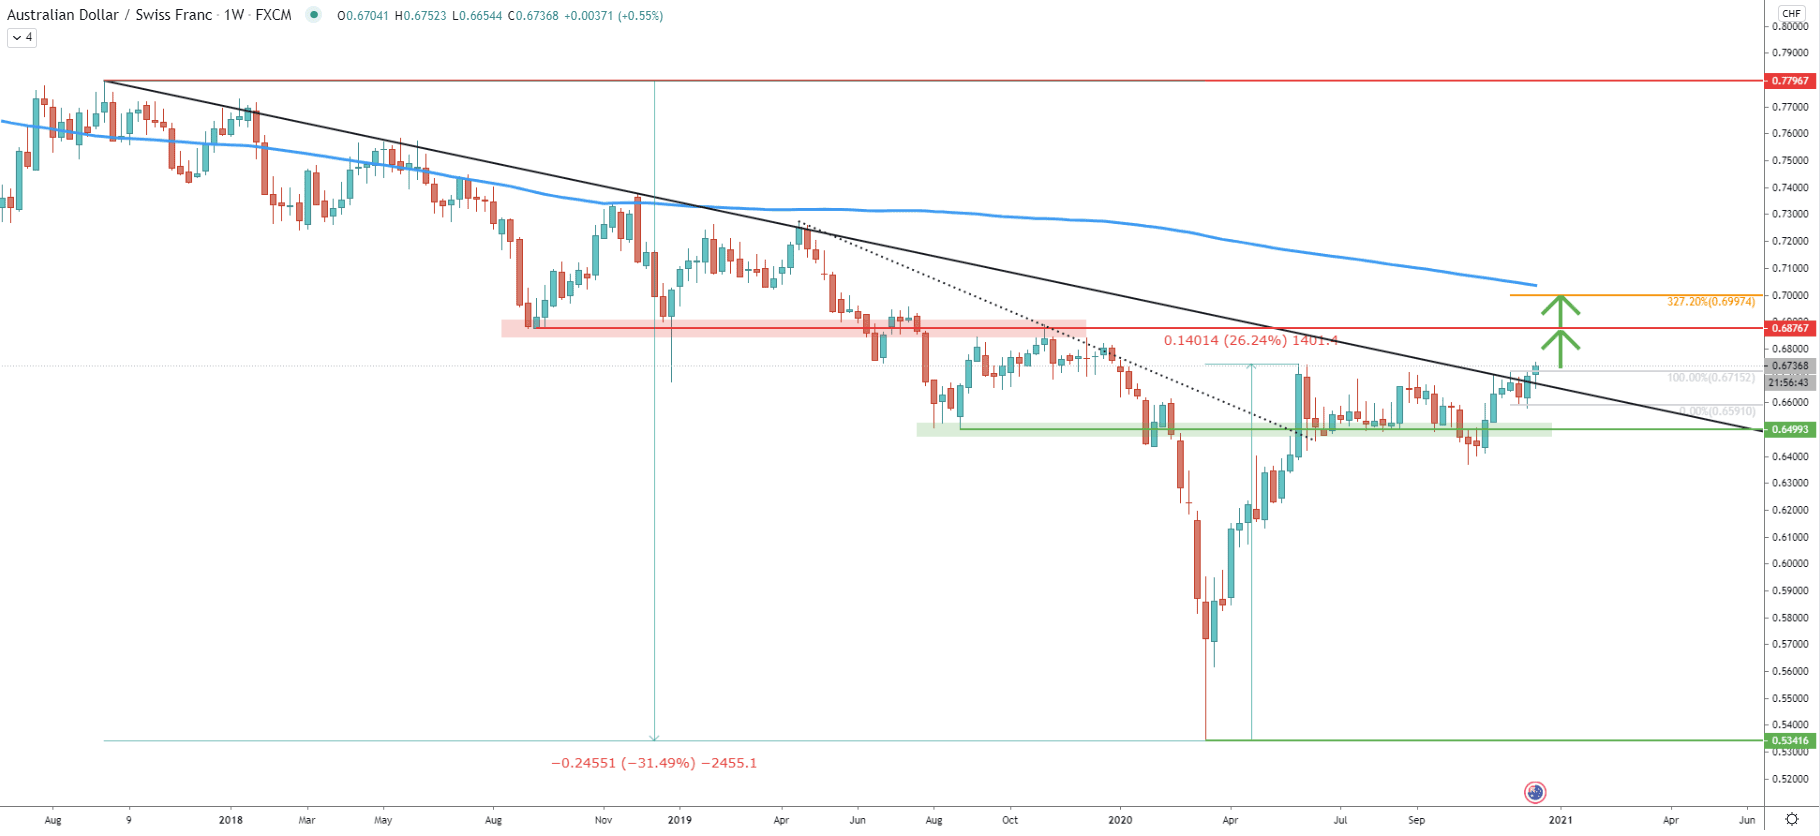
On the weekly chart, AUD/CHF has been trending down consistently since August of 2017. Price has declined by 31.49%, which equals 2455 pips over the course of 3 years. However, at the beginning of this year, AUD/CHF bottomed out, while testing the 0.5341, after which the price rapidly started to recover. Up until now the AUD/CHF has recovered 26.24% which took only 3 months. Nonetheless, during the past 3 months consolidation phase was ongoing, but today, it could have come to an end.
It can be seen, that the downtrend trendline got broken, with a clear daily close above. This is the moment many bulls were waiting and perhaps now it is the time to act. AUD/CHF might rise towards one of the resistance levels, with the first being near the previously formed supply/demand zone. The second and the key resistance is at 0.7000, which is an extremely strong psychological level. It is also confirmed by 327.2% Fibonacci retracement level and corresponds to the 200 Exponential Moving Average.
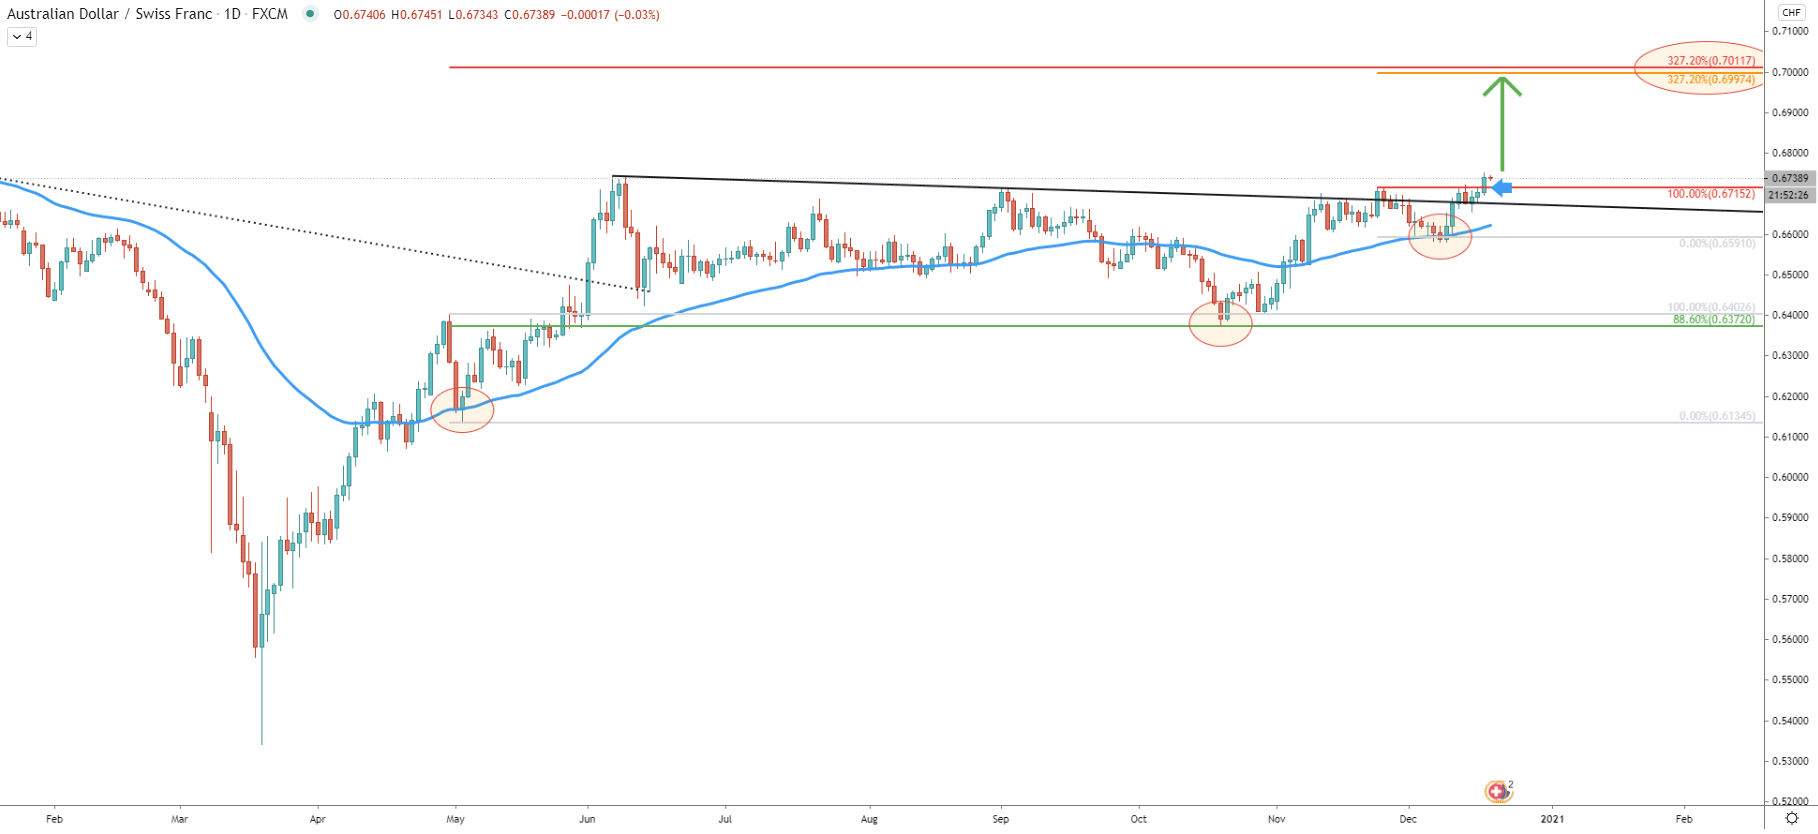
On the daily chart yet another downtrend trendline got broken, with a confirmed breakout occurred just today. Prior to that, the price rejected the 88.6% Fibonacci support at 0.6372, went up, and rejected the 50 EMA near 0.6590. The higher highs and higher lows pattern are in place, and considering today’s’ break above the previously formed high as well as the downtrend trendline, bulls are clearly attempting to take complete control.
On this chart, the key resistance is now confirmed by two Fibonacci retracement levels. The first being 327.2% as per the weekly chart, and the second is also 327.2% Fibs, both of them were applied to corrective waves down where the EMA got rejected.
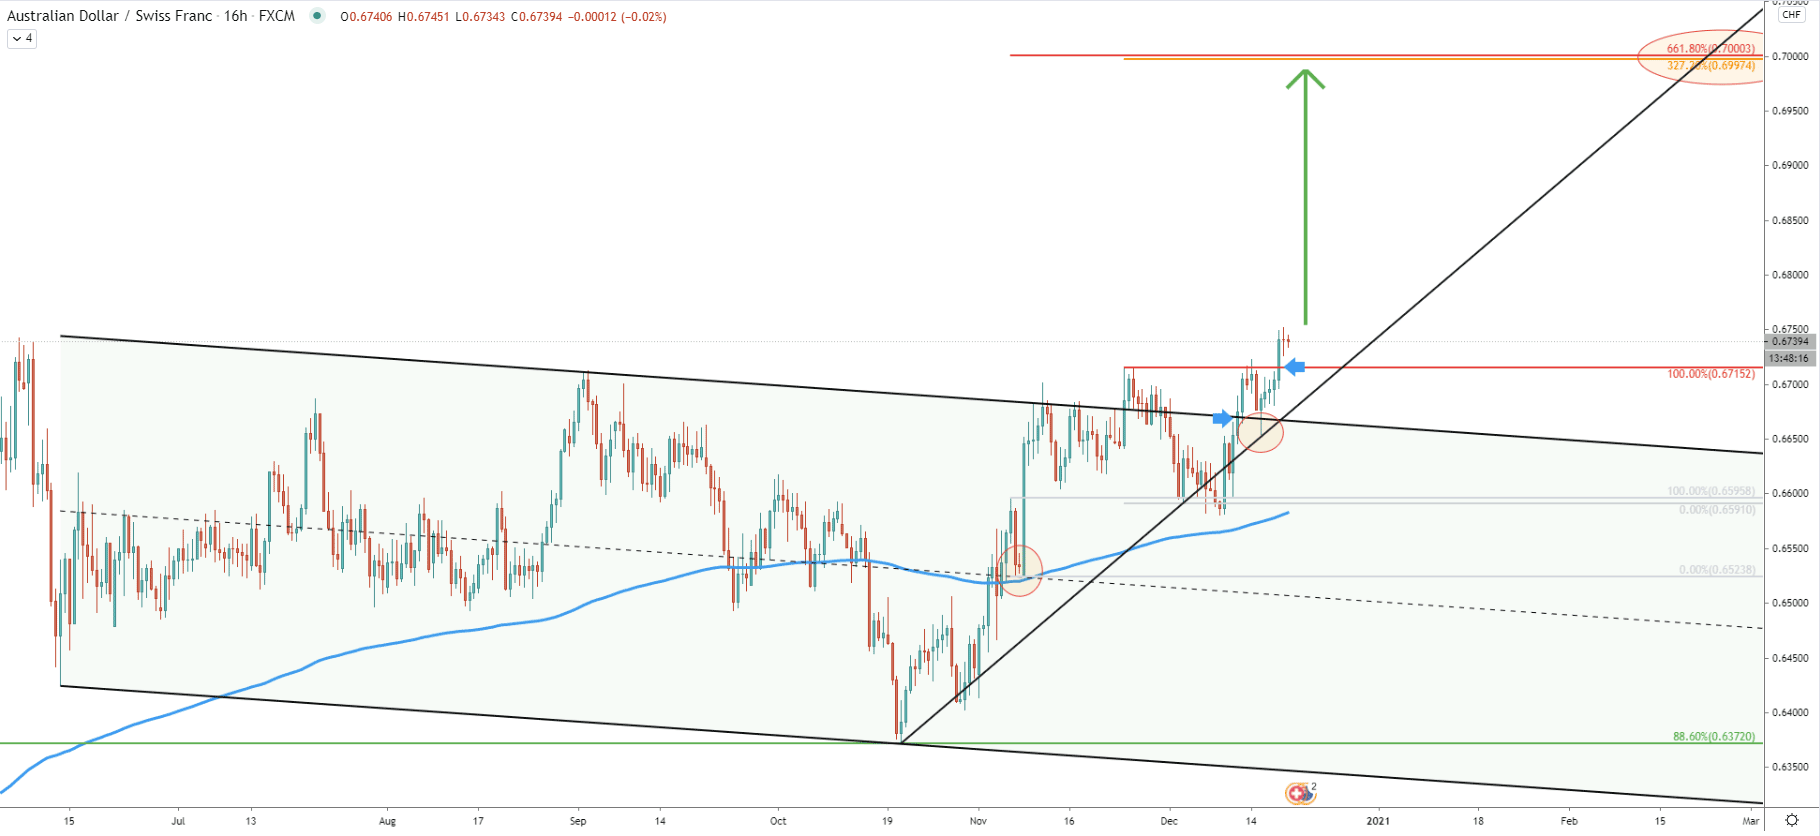
Here it can be seen that AUD/CHF broke the descending channel prior to which it rejected cleanly the 200 EMA on the 16-hour chart. Fibonacci retracement indicator was applied to the pullback where the price bounced off the EMA. And now there are 3 Fibonacci retracement levels confirming the 0.7000 as the potential key technical resistance. It can also be seen that after the break above the channel, the price corrected down and rejected the simple uptrend trendline, indicating the validity of the bullish trend.
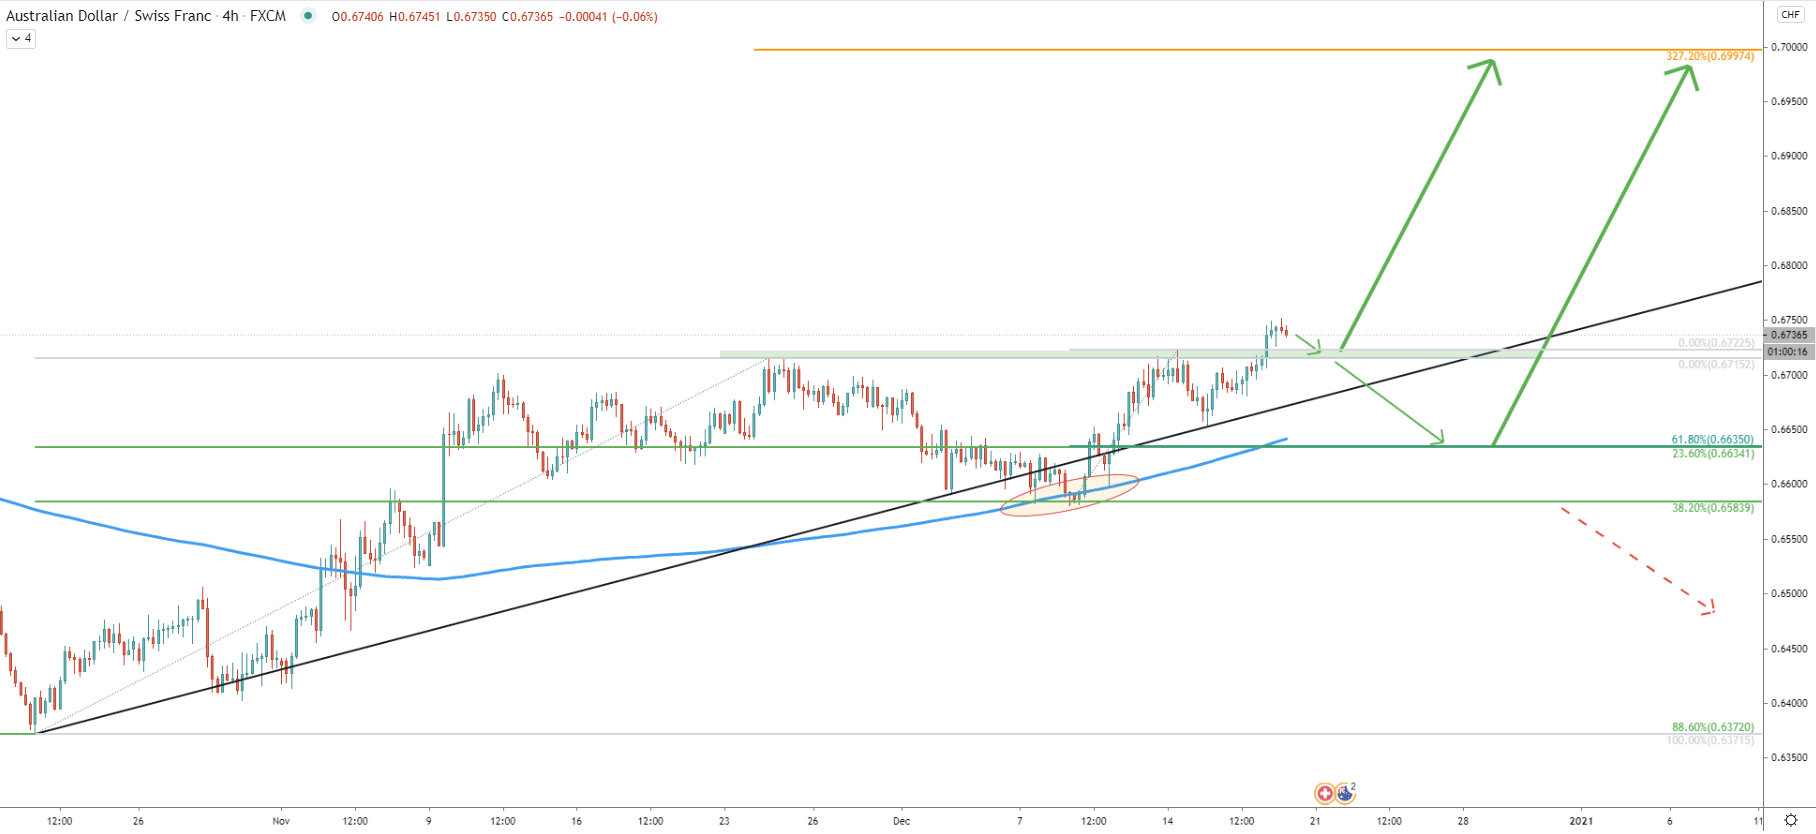
Even though the trend is bullish, the correction down can take place. On this chart, there are two support levels, where the nearest one is at 0.6722, which was the previously produced high. If the price will break and close below this level on the daily chart, further correction is likely to take place. It might result in a price decline towards the 0.6635 support, which is confirmed by two Fibonacci retracement levels as can be seen on the chart. And finally, the price might re-test the 0.6583, which is the lowest support that must be respected in order for AUD/CHF uptrend to remain valid.
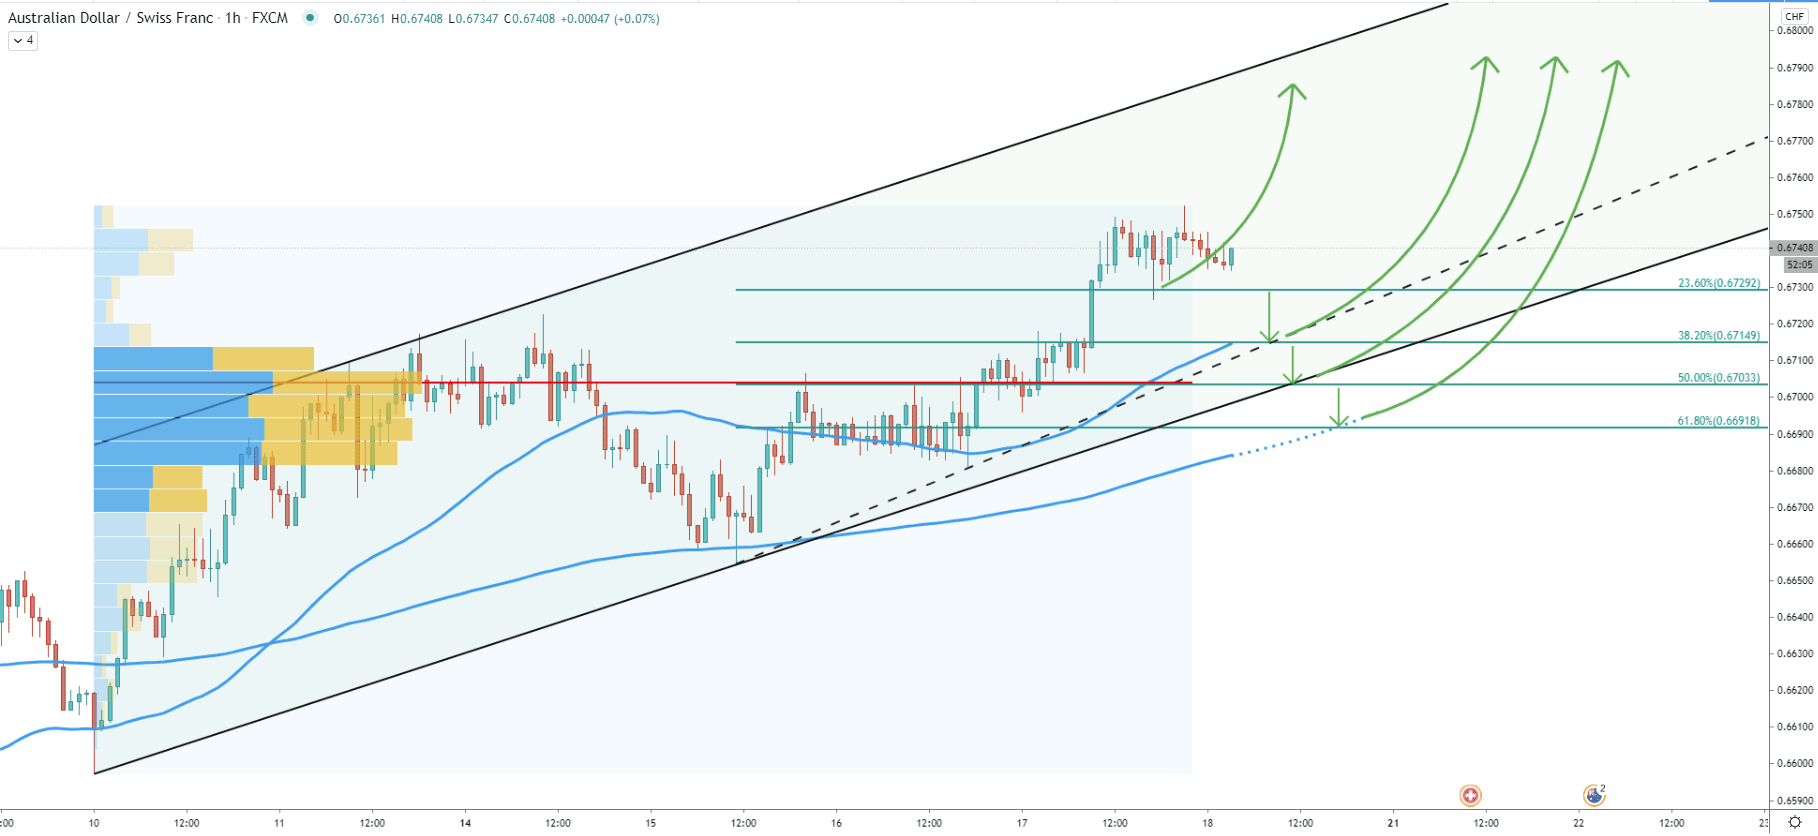
On the hourly chart, there is a more detailed few as to how far the price might decline if the correction will take place. Here we have 4 levels, based on the Fibonacci applied to the last wave up. The 0.6714 seems like a very strong demand level because it corresponds to the uptrend trendline as well as 50 EMA. Then goes the 0.6700 psychological support, corresponding to the bottom of the ascending channel as well as the 50% Fibs. Anf finally, there is 61.8% Fibs, which corresponds to the 200 EMA.
It is possible that AUD/CHF will correct towards one of these levels, although the current moment is what bulls have been waiting for during the past 3 months. This means that if the trend is bullish, there won’t be much of a pullback.
After 3 months of consolidation, AUD/CHF is showing signs of life. Price broke above the previous, downtrend trendline as well as the descending channel. At the same time, multiple support levels were rejected consistently. This might result in a strong uptrend starting from this or next week.
As per the weekly, daily, and 16-hour chart, the key resistance is based at 0.7000 psychological level and is confirmed by 3 different Fibonacci retracement levels.
As per the 4-hour chart, only break below the 0.6583 support, which is the 38.2% Fibs, will invalidate the bullish forecast. This will be the break below the previously formed low, which seems to be the key support.
Support: 0.6722, 0.6715, 0.6700, 0.6692, 0.6635
Resistance: 0.6876, 0.7000


