Published: February 10th, 2021
The cryptocurrency market is skyrocketing. Along with Bitcoin, many altcoins are experiencing a substantial price increase by 100% and even 1000%. But on the other hand, some altcoins, such as Ripple are not able to produce a new higher high. In this analysis, we’ll dive into the price action of the XRP/USDT and what to expect during the next couple of weeks.
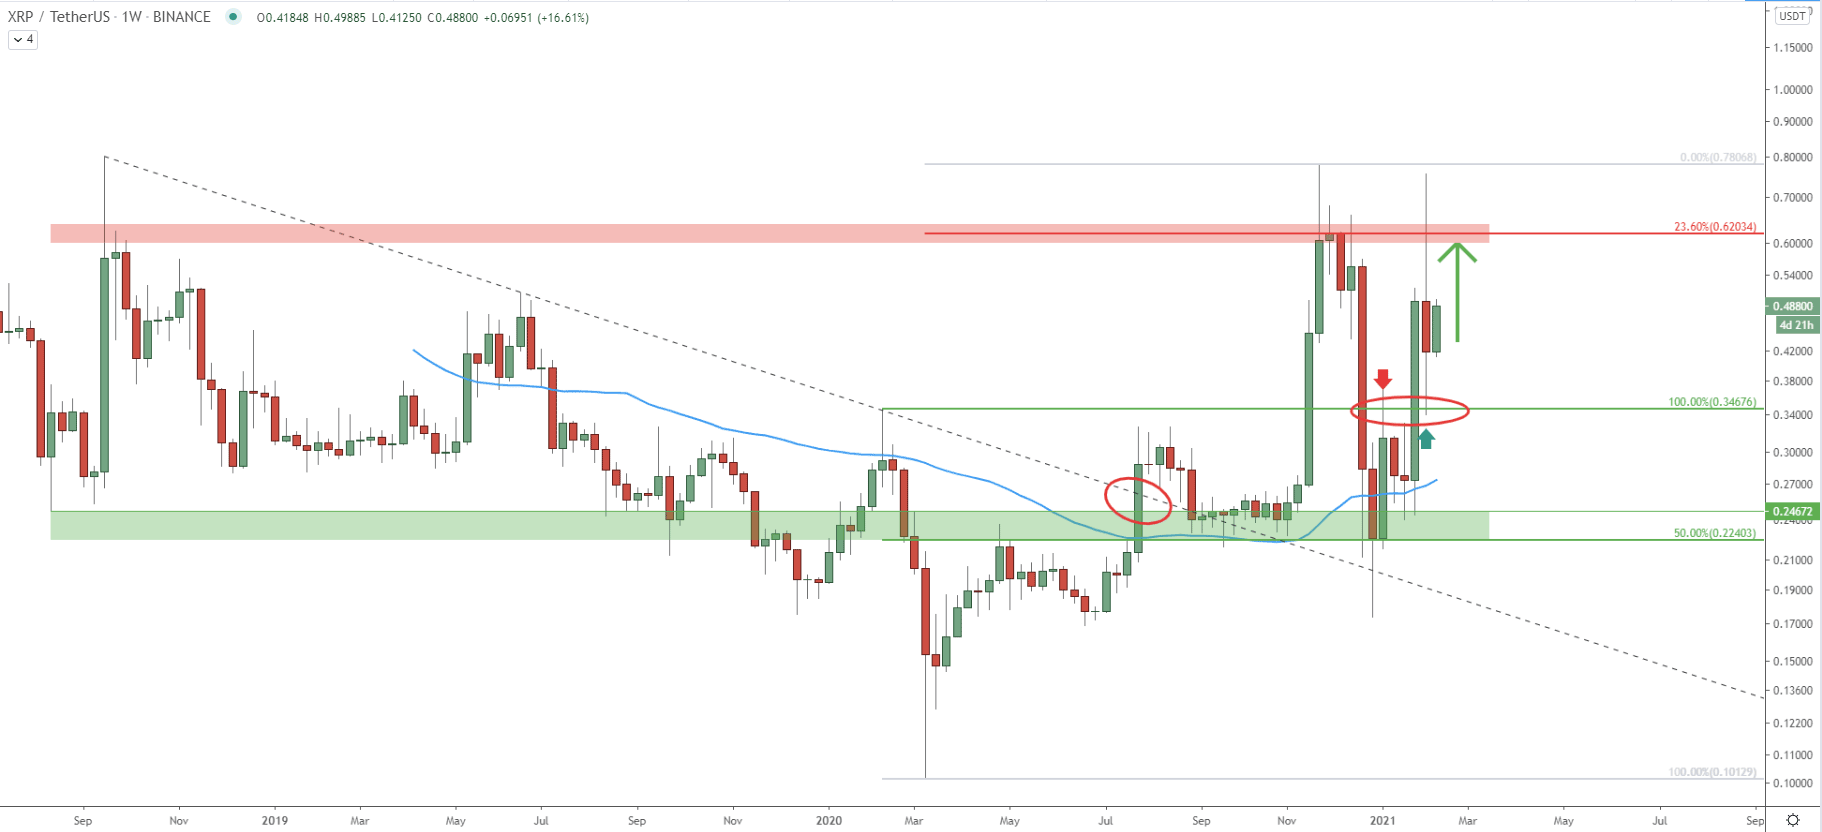
On the weekly logarithmic chart, XRP has reached the low at 0.10 after which it went up and broke above the downtrend trendline, along with the 50 Exponential Moving Average. After the breakout, the price has tested and rejected 0.78 high, which is a previously formed resistance. However, on the strong pullback, towards the 0.22 support area, price rejected the 50% Fibonacci retracement level along with the 50 EMA. This was a second bounce o this demand zone, suggesting the validity of bullish pressure.
During the past month, XRP/USDT has been rising steadily, and considering how strongly the 0.22 support area has been defended, the upside momentum is likely to continue. At the very least XRP/USDT should be re-testing the 0.62 resistance area, which is confirmed by a 23.6% Fibonacci retracement level as can be seen on the chart.
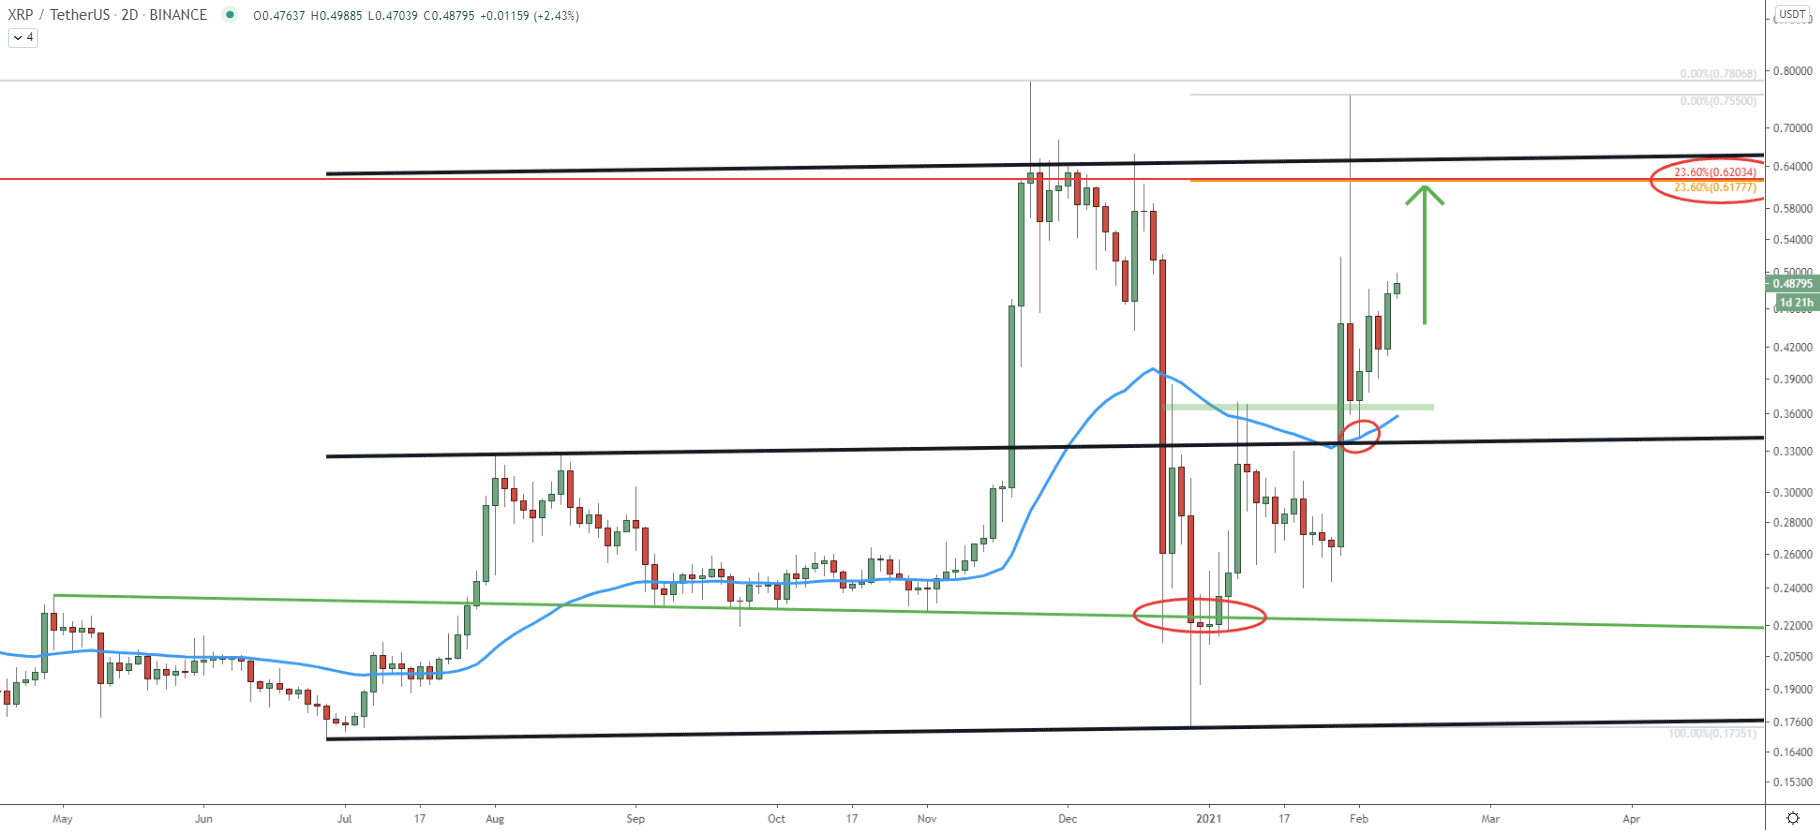
On the daily chart, the price has established an uptrend, due to the higher highs and higher lows being produced. The previously established low near 0.22 support, hasn’t been broken. Spikes were produced below and rejected the support trendline. After this, a strong upside move followed and the price broke above the 50 EMA as well as the resistance near 0.36. The resistance became the support and got rejected along with the 50 EMA, which clearly acted as the demand area. Right now price is heading north and should continue rising towards the 0.62 resistance area. On this chart, this resistance is confirmed by two Fibs, both of which are 23.6% retracement levels. Besides, the upside resistance also corresponds to the top of the extended ascending channel, making it a strong supply area.
If this area will get broken, further upside potential will become very high, and the price could be on the rise towards at least 1.00 psychological resistance.
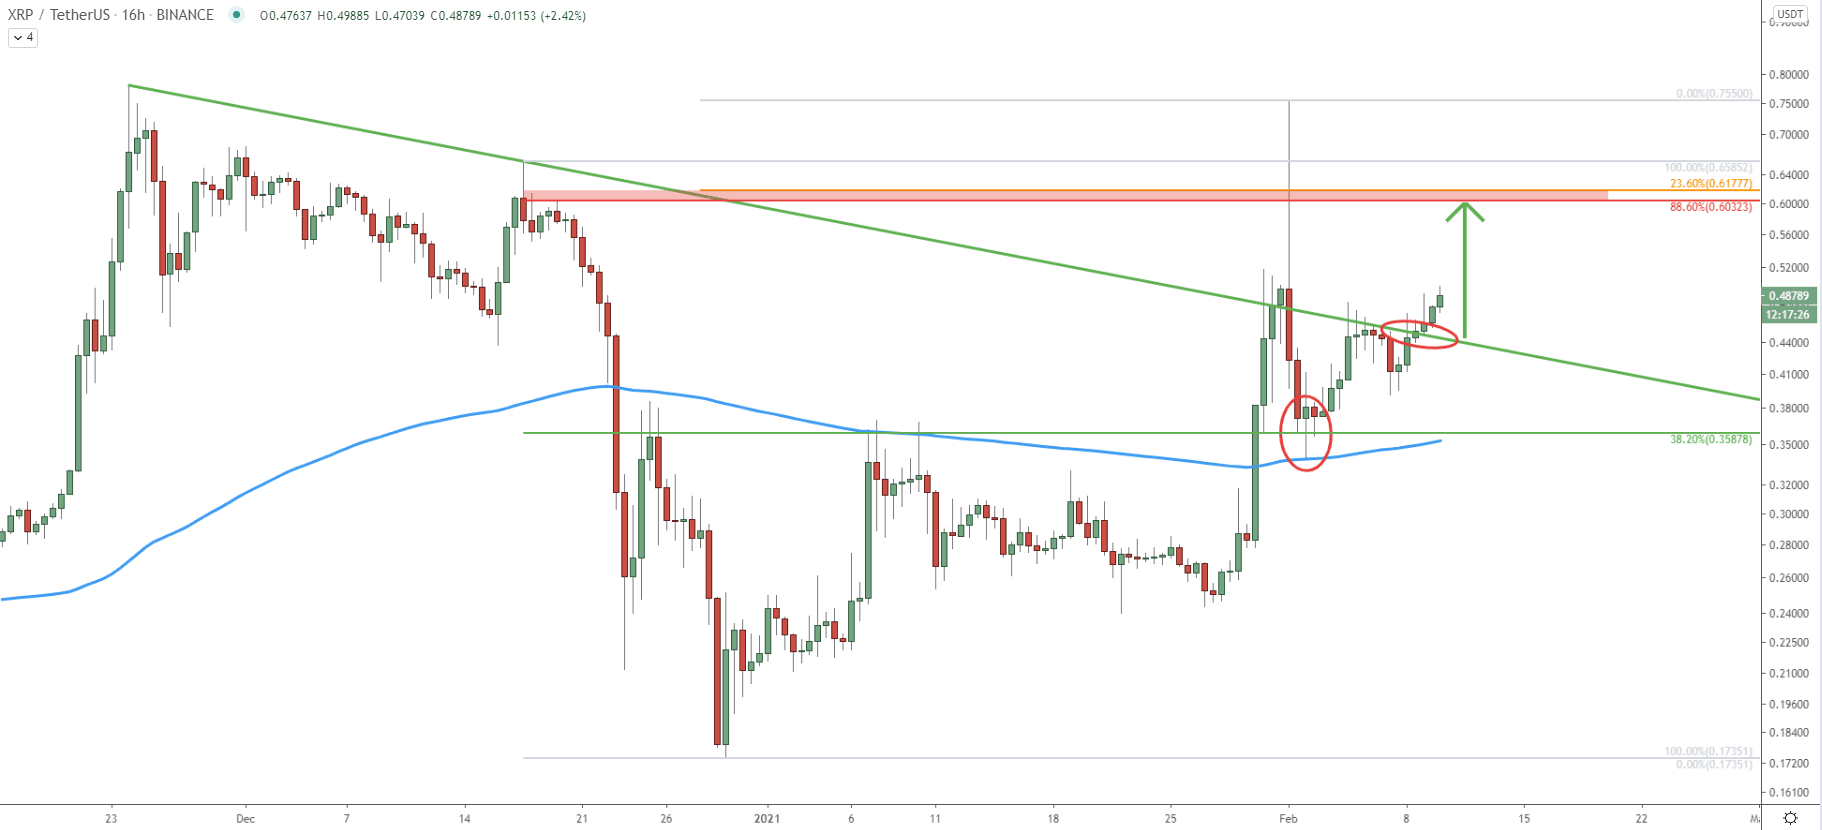
The most recent price action shows that after the price bounced off the 38.2% Fibs at0.35 as well as the 200 EMA, it went up and broke above the downtrend trneldine. This might suggest that buyers are finally ready to push prices higher once again. On this chart, the previously mentioned resistance area corresponds with yet another Fibonacci retracement level. This time it is 88.6% Fibs applied the last strong wave down. It will be very important to watch whether this resistance will be broken or rejected when/if reached. Because it will most likely show the clue signs for the further price action of the Ripple against the USDT.
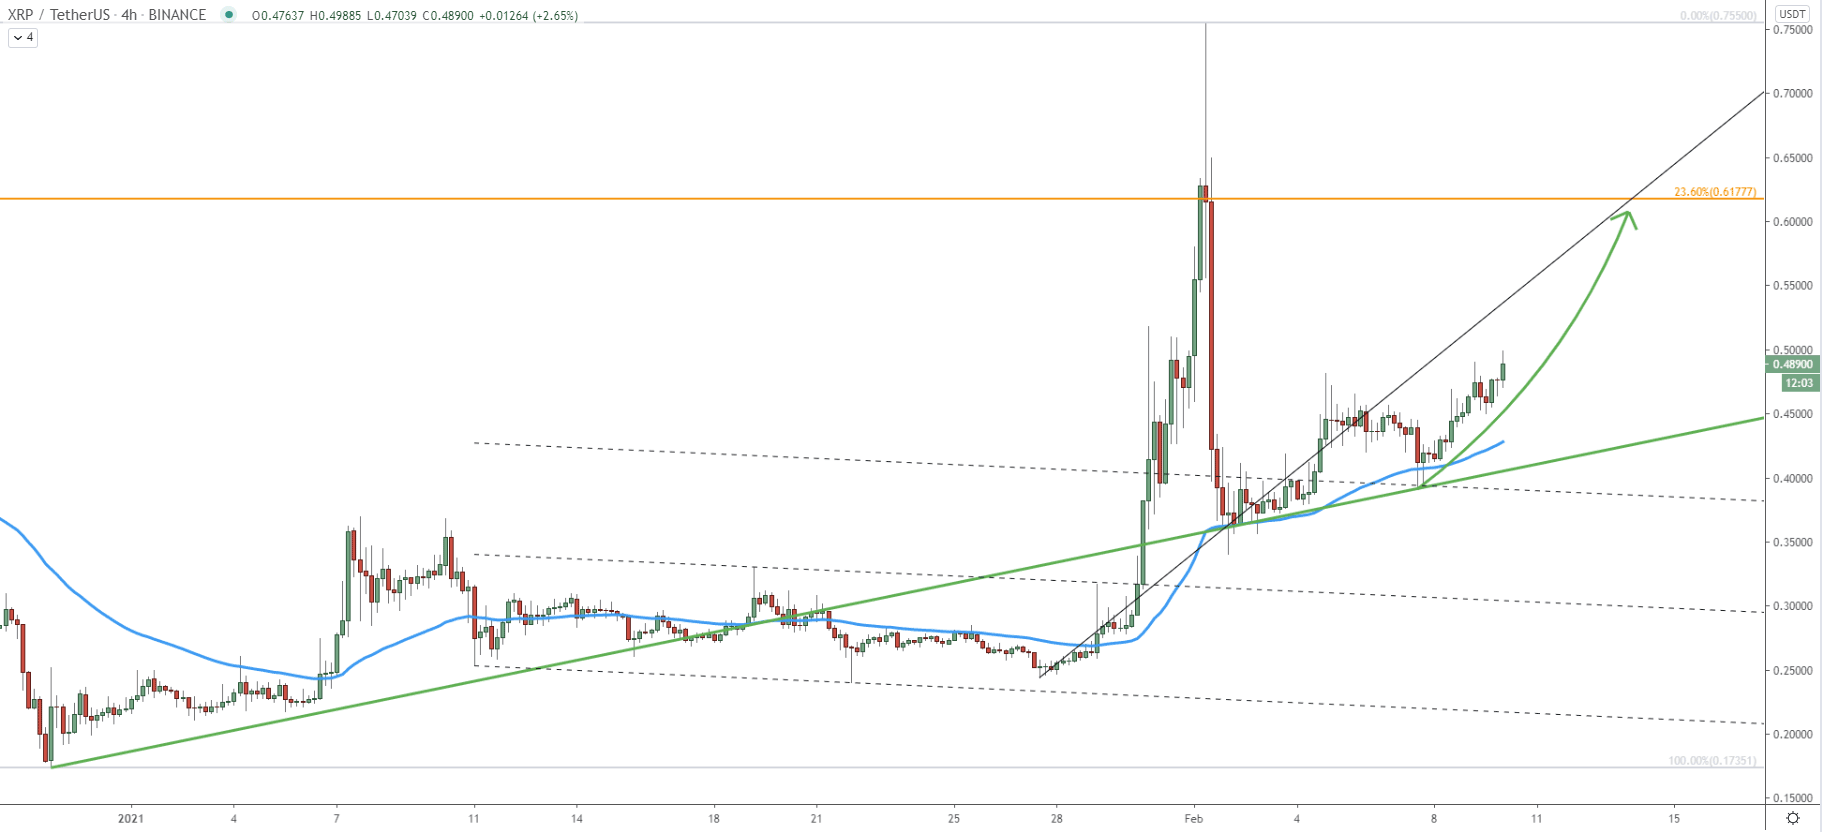
In the above 4-hour chart we can see that the price is trending up, but what is most important is that there were two bounces off the average price uptrend trendline, which is green on the chart. At the same time price bounced off the 50 EMA wise as well as the top of the extended descending channel, which has acted as the support. While the short term consolidation can be expected, the price remains strongly bullish. Based on the upside resistance and the Fibonacci level crossing, XRP could be rising quite rapidly and test the 0.62 resistance area by the mid of this month.
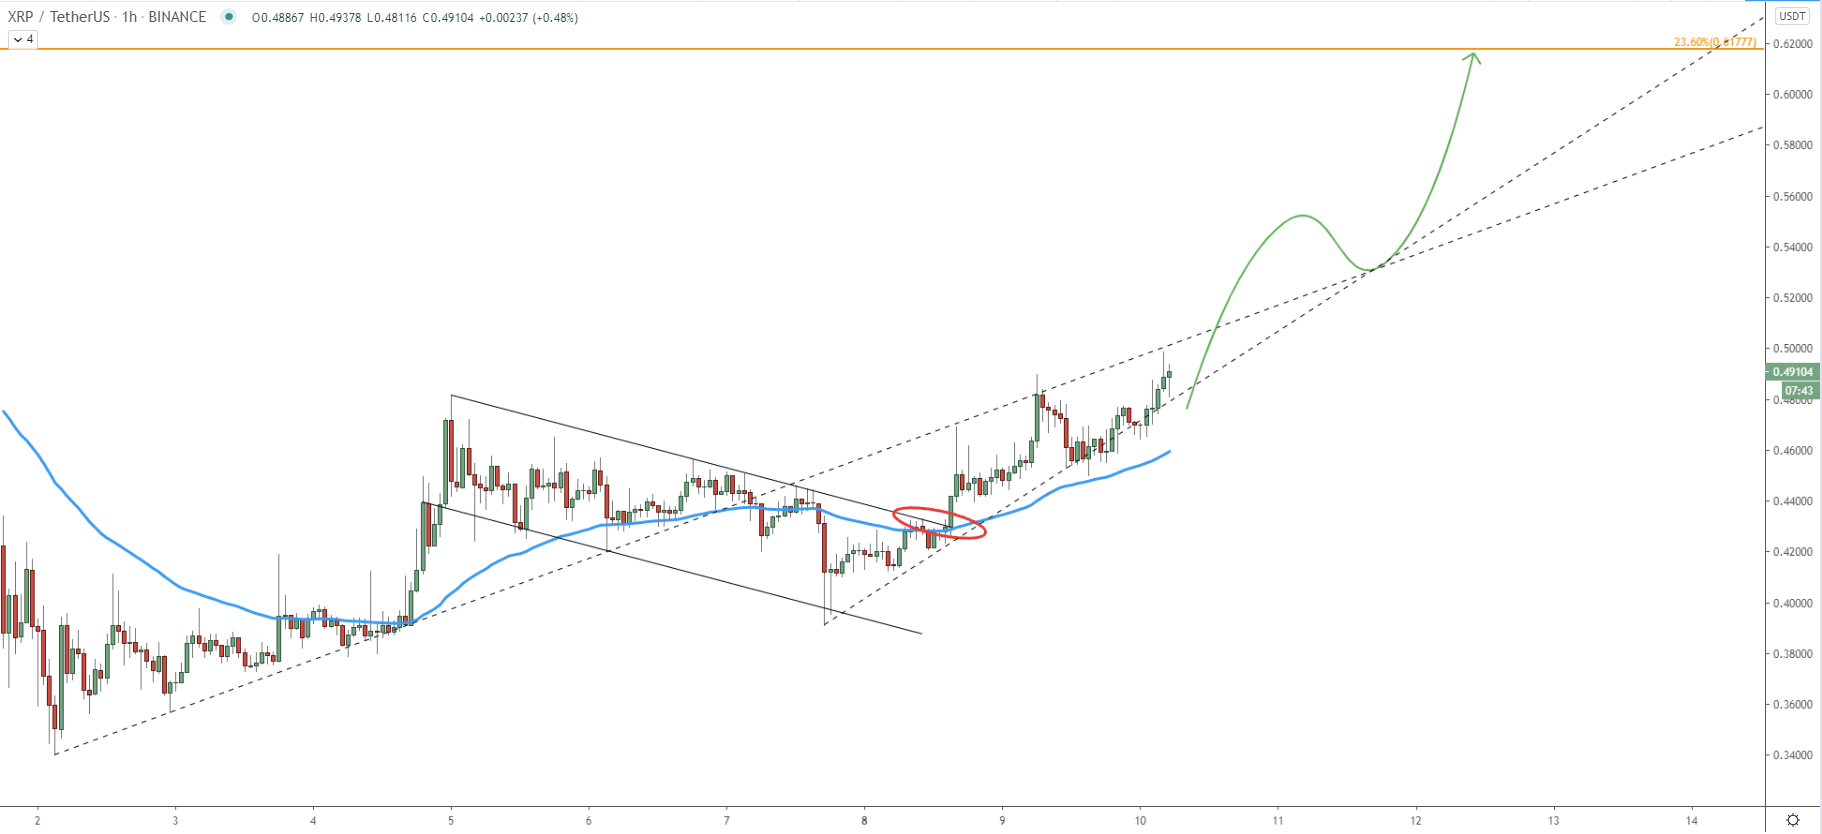
Finally, on the hourly chart, XRP/USDT price formed a bullish flag pattern. Price broke above the flag as well as 50 EMA, validating the continuation of an uptrend. Nonetheless, currently, the price remains below the average-price uptrend trendline, which certainly must be broken for the price to test 0.62 resistance. Also, the simple uptrend trendline is being rejected and as long as the daily closing price remains above the 0.45 support, the Ripple trend will remain bullish. Perhaps in the medium term, the crossing of the two trendlines near the 0.53 area, could be acting as the support and yet another demand area.
The Ripple trend seems to become bullish on the small timeframes. Nonetheless, while analyzing the weekly chart, price is still trapped between the support and resistance areas. It is likely, that with the current short-term uptrend, XRP/USD will continue to rise towards the previously established resistance.
As per the weekly and daily charts, the key resistance is located at 0.60-0.63 area, which is confirmed by 3 different Fibonacci retracement levels and corresponds to the top of the ascending channel.
On the hourly chart, the price has bounced off the uptrend trendline at 0.45. As long as the daily closing price remains above this level, the trend will be bullish. But the daily break and close below, will immediately invalidate the bullish outlook and XRP/USD can be expected to move lower or at the very least initiate a consolidation phase.
Support: 0.45, 0.37
Resistance: 0.50, 0.63


