Published: October 14th, 2020
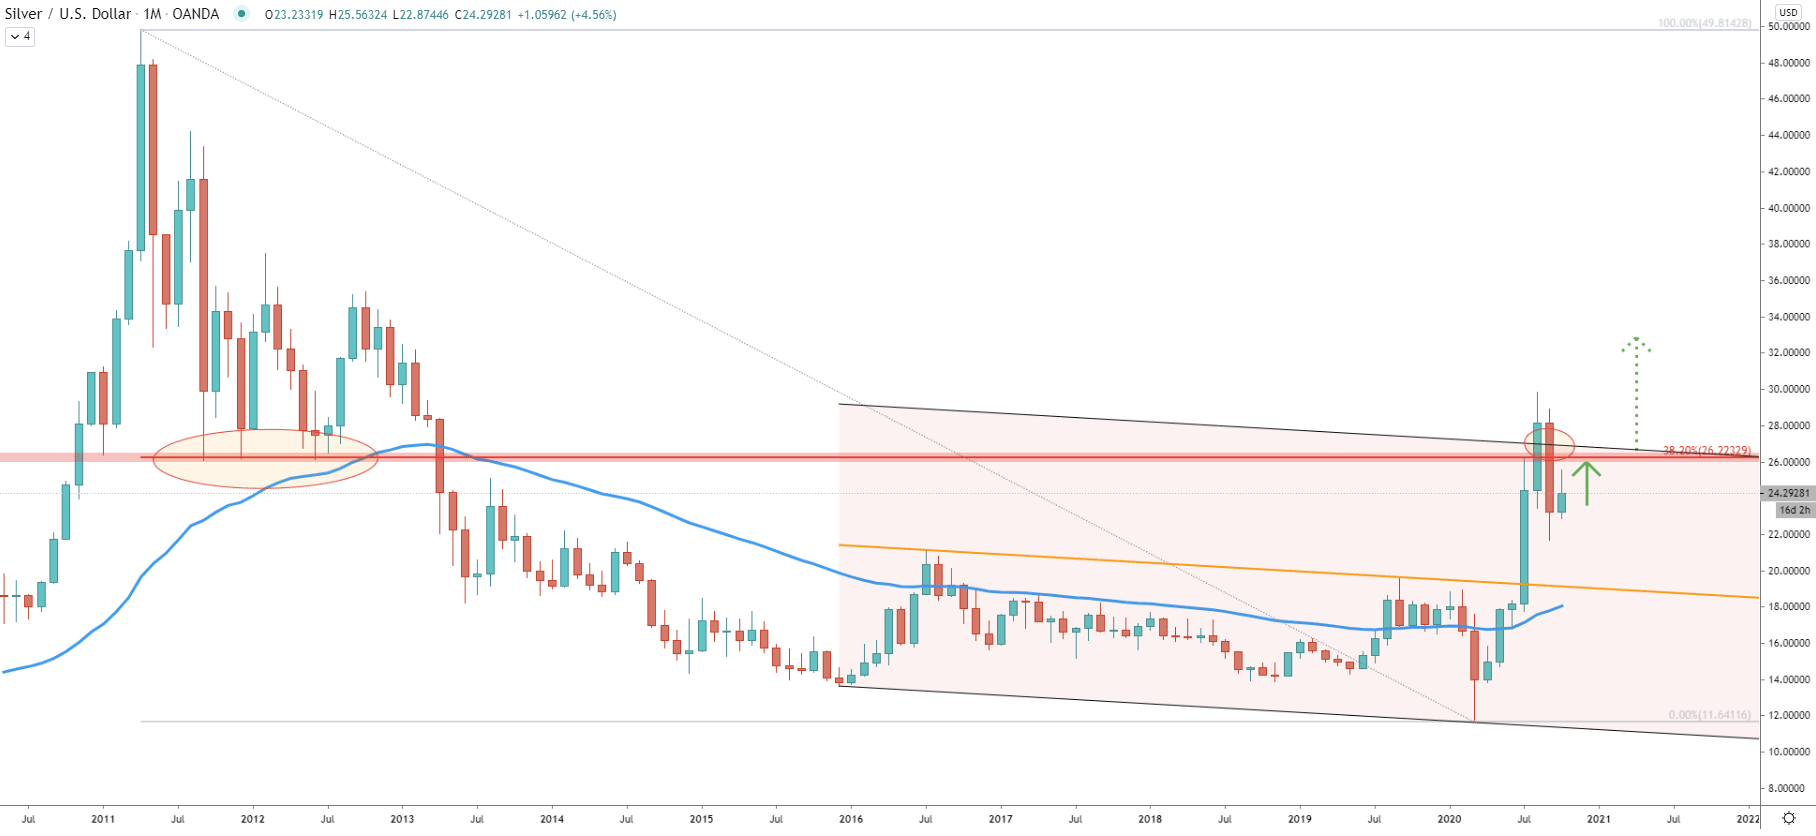
To show the big picture of the Silver price action, we’ll start by observing the monthly chart. In July this year, there was a very strong bullish candle which has rejected in the break above the descending channel. What is more important is that price managed to break even above the upper trendline of the extended descending channel, suggesting a very bullish price action in the coming months.
Nonetheless, in this analysis, we’ll look at the nearest level of resistance which obviously must be penetrated in order for the Silver to continue rising. Based on the previous demand zone, the nearest resistance is located near the 26.20 area, which also corresponds to the 38.2% Fibonacci retracement level. This price has been broken already, with the monthly close above. This suggests a very bullish outlook for XAG/USD, but certainly, there could be some resistance at the 26.20 area, before/if the price will continue to rise exponentially. In the following charts, we’ll dive into the importance of this resistance area.
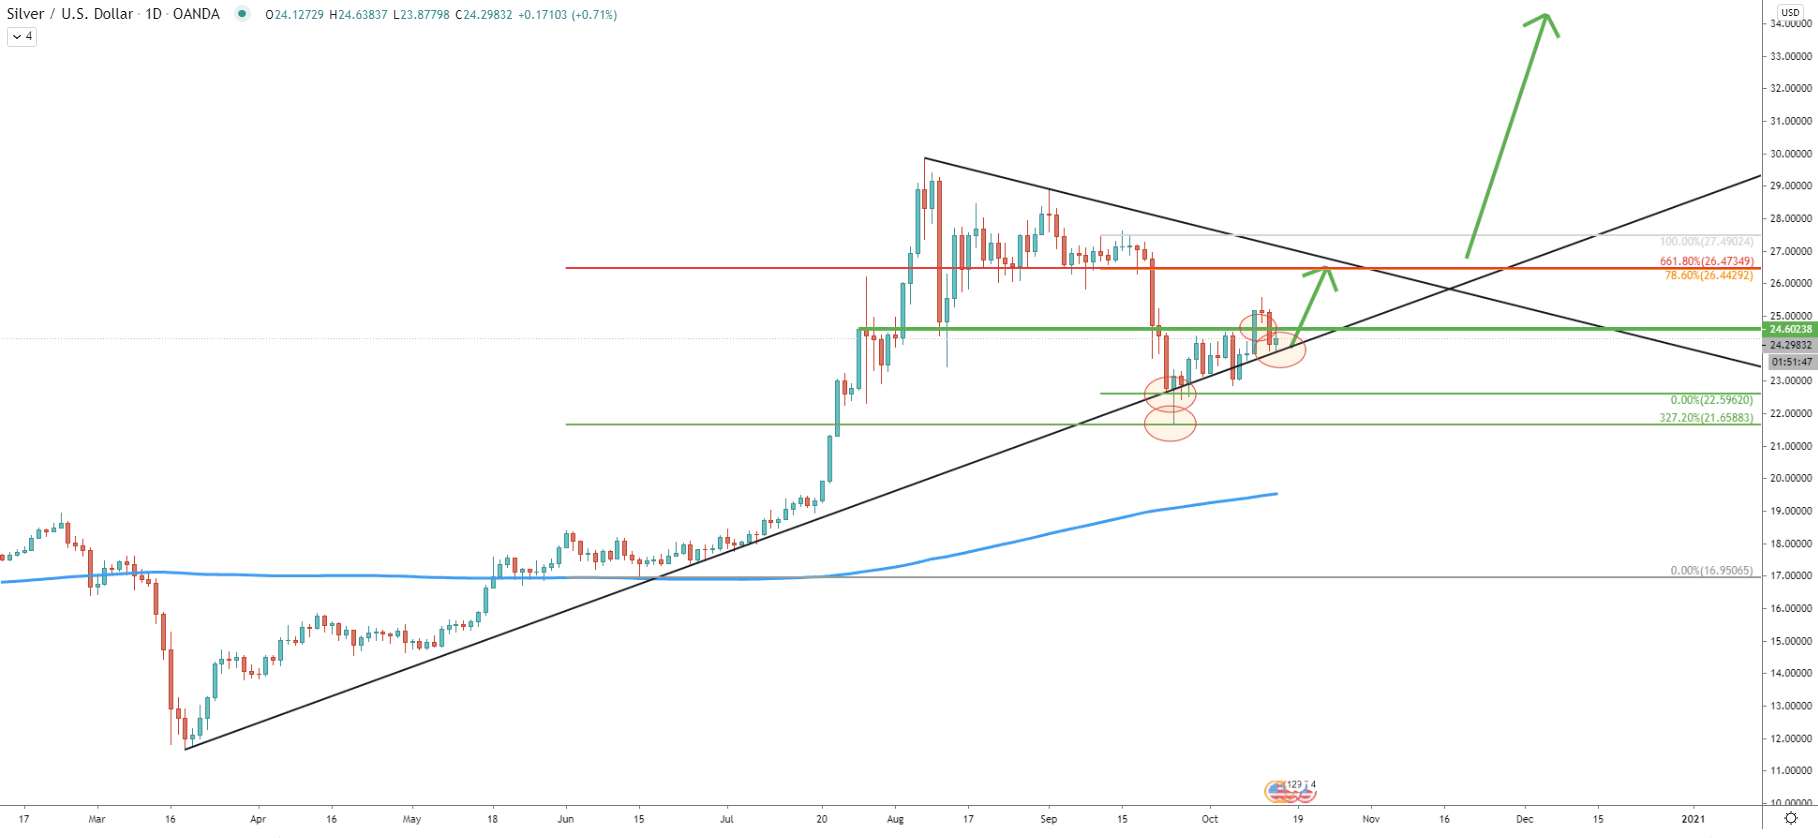
Silver continues to trend up while rejecting the uptrend trendline. First, it was rejected back on September 24, with a big spike below the trendline. What is interesting is that this spike just touched and cleanly rejected 21.65, which is 327.2% Fibonacci applied to the corrective wave down where XAG/USD rejected the 200 Exponential Moving Average.
Today Silver yet again rejecting the uptrend trendline, which could suggest the starting point of yet another upside move. In regards to the nearest resistance, on this chart, we’ll get more precise on it. There are two Fibonacci retracement levels, 661.8%, and 78.6%, both of which are pointing out to one level, and this is 26.40. This price also corresponds to the downtrend trendline and could be the key resistance before the potential consolidation phase will begin.
Back in September, at the point where previously discussed support at 21.65 was rejected cleanly, the price also rejected the 200 Exponential Moving Average. In addition, XAG/USD has tested the very bottom of the descending channel and bounced off it. Since then price has been on the consistent rise, producing higher highs and higher lows. This growth resulted in the break above the downtrend trendline suggesting a very bullish scenario. Considering the current pullback and the rejection of the uptrend trendline, buyers could be jumping on board and investors filling their bags with silver for the long term.
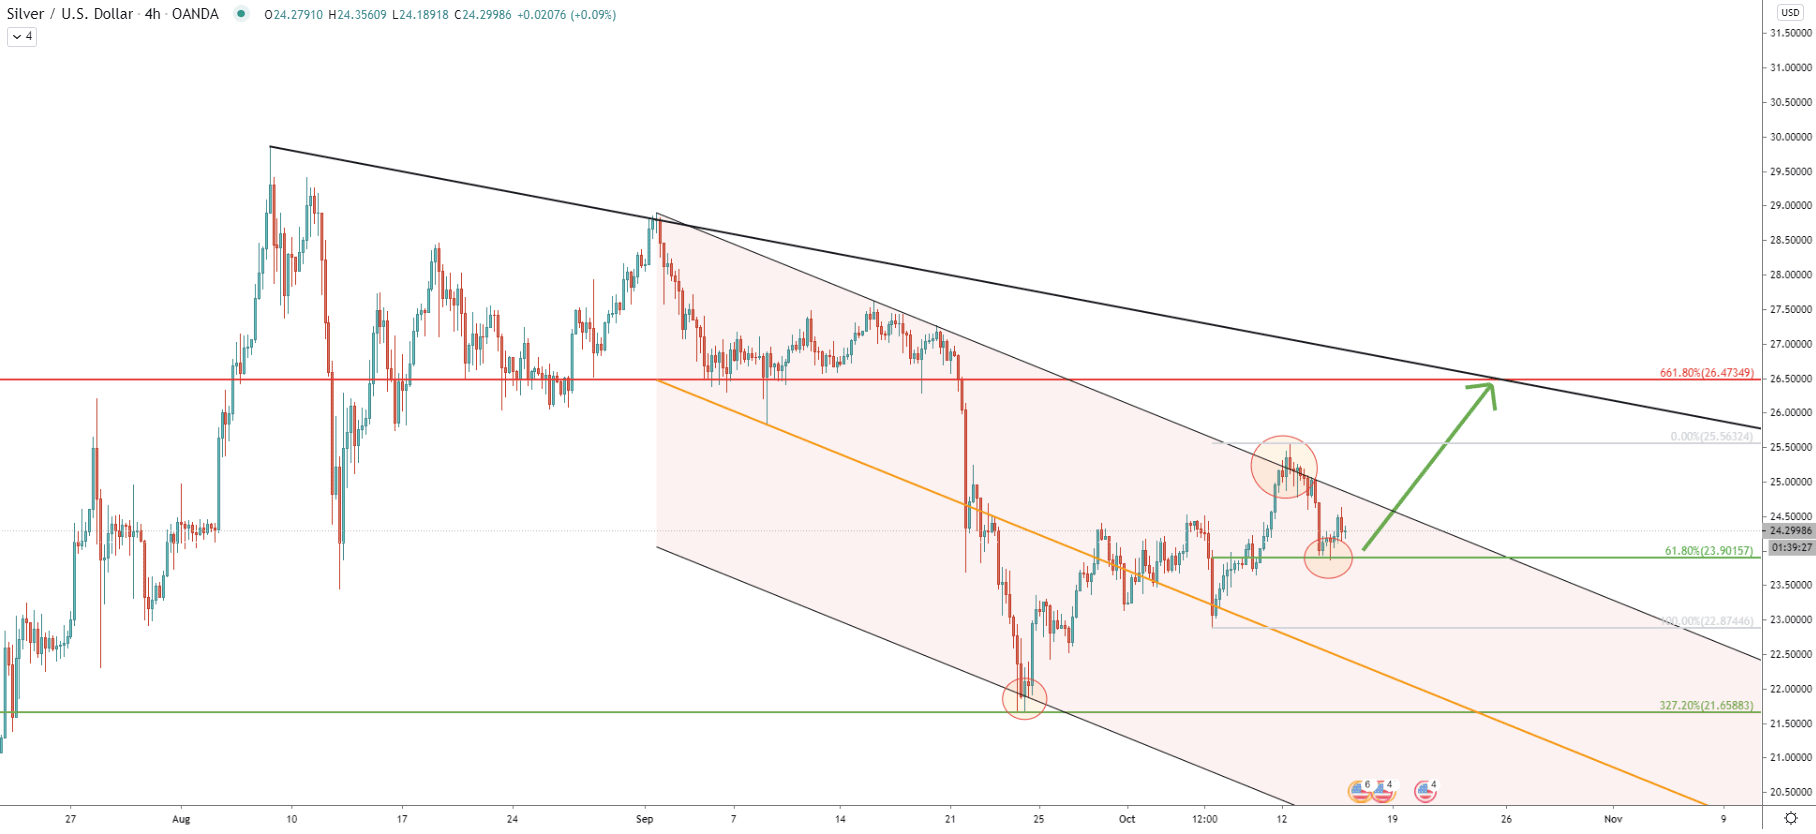
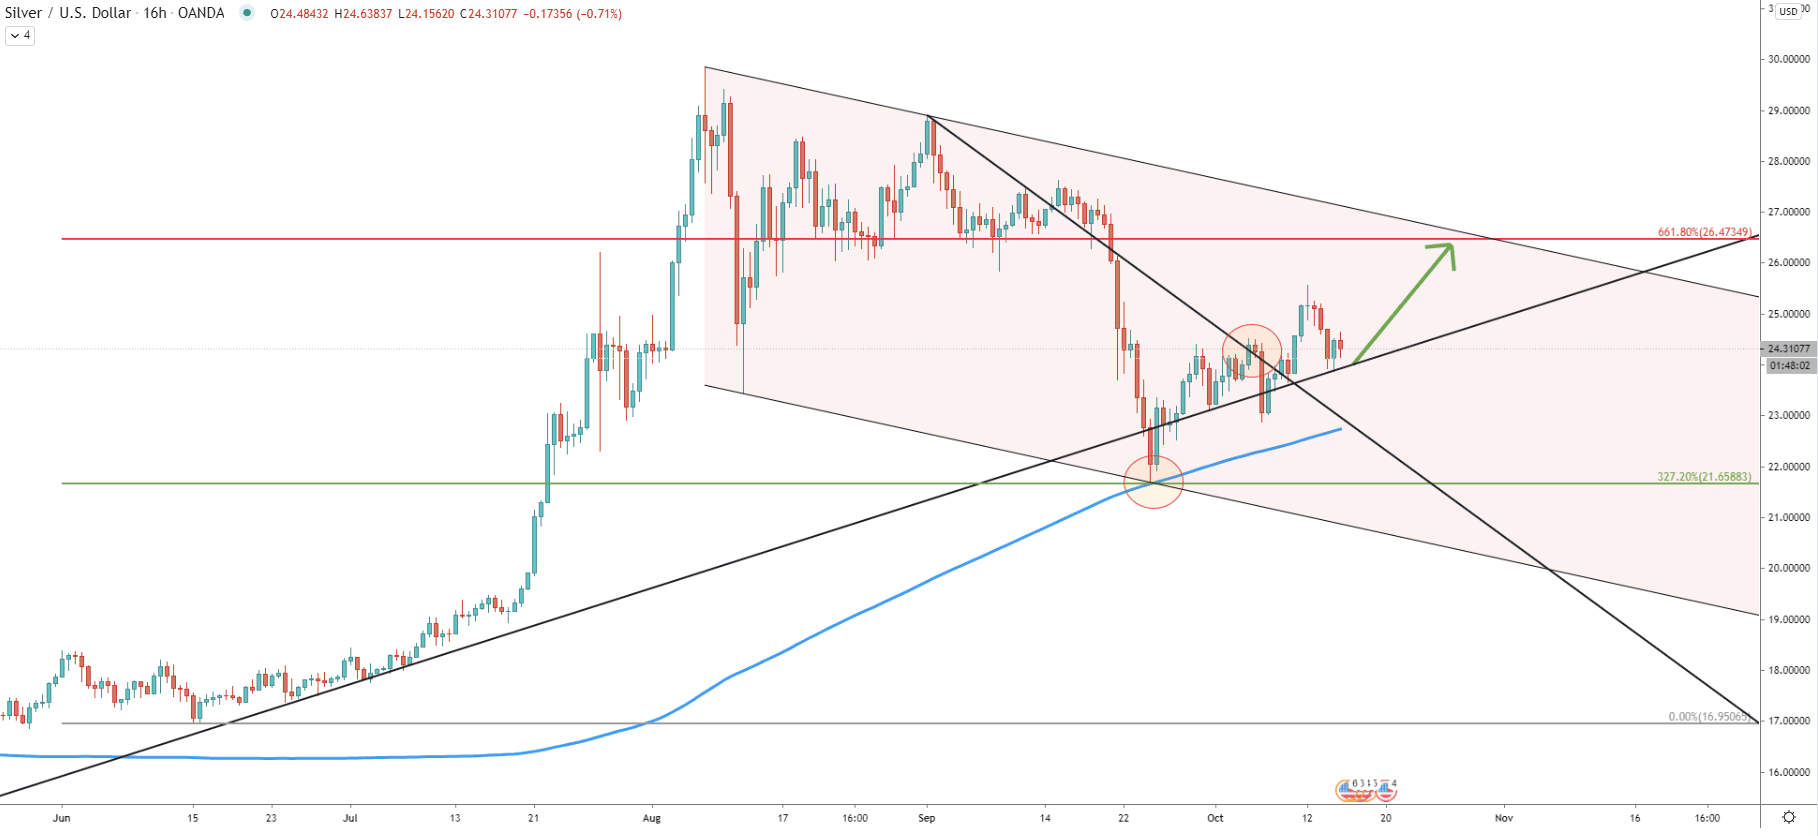
Yet another channel, this time descending. Yet again, on September 24 price has reached and rejected the bottom of the extended descending channel, after which it started to move up. While rising, it broke above the downtrend trendline or the upper trendline of the descending channel, suggesting further growth potential. The current corrective wave down was stopped by 61.8% Fibonacci retracement level at 23.9, which yet again validates the uptrend. The current price action is all in favor of the uptrend continuation, but obviously, if 23.9 support will remain to be respected.
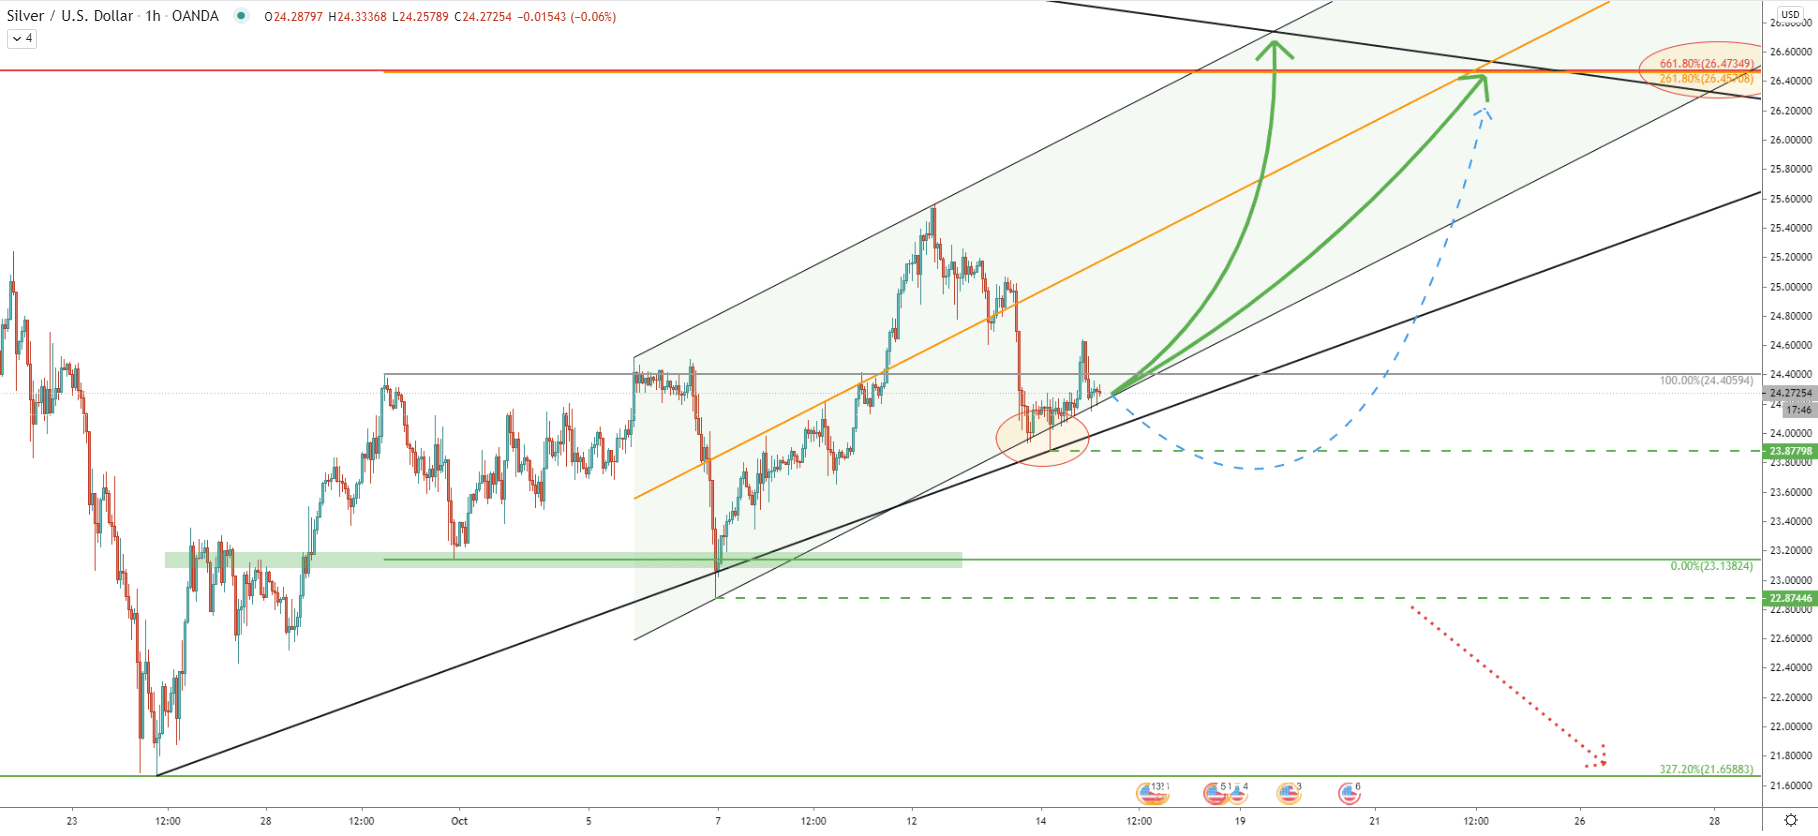
On the hourly chart, Silver is already trending within the ascending channel. Today price has reached and rejected the bottom of the channel as well as the uptrend trendline at the same time. The resistance is now confirmed by another Fibonacci retracement level, this time with the 261.8% Fibs applied to the corrective wave down where 23.13 support and the double bottom has been formed.
While the price could start moving up from this point onwards, there is also a probability that it will attempt to break below the 23.87, which is the most recent low. But only a daily break and close below could initiate further consolidation, although will not invalidate the bullish outlook.
The price action on Silver is getting extremely bullish on multiple timeframes. This might be the beginning of a strong rally, or at the very least can result in a strong upside wave.
The key resistance level is located at 26.45, which is confirmed by 3 different Fibonacci retracement levels and corresponds to the downtrend trendline.
As per the hourly chart, only a daily break and close below 22.87 support will invalidate Silver bullish forecast, In this case, the price might start range-trading or even move down to 21.65 support.
Support: 23.87, 22.87, 21.65
Resistance: 25.56, 26.45


