
Published: October 22nd, 2020
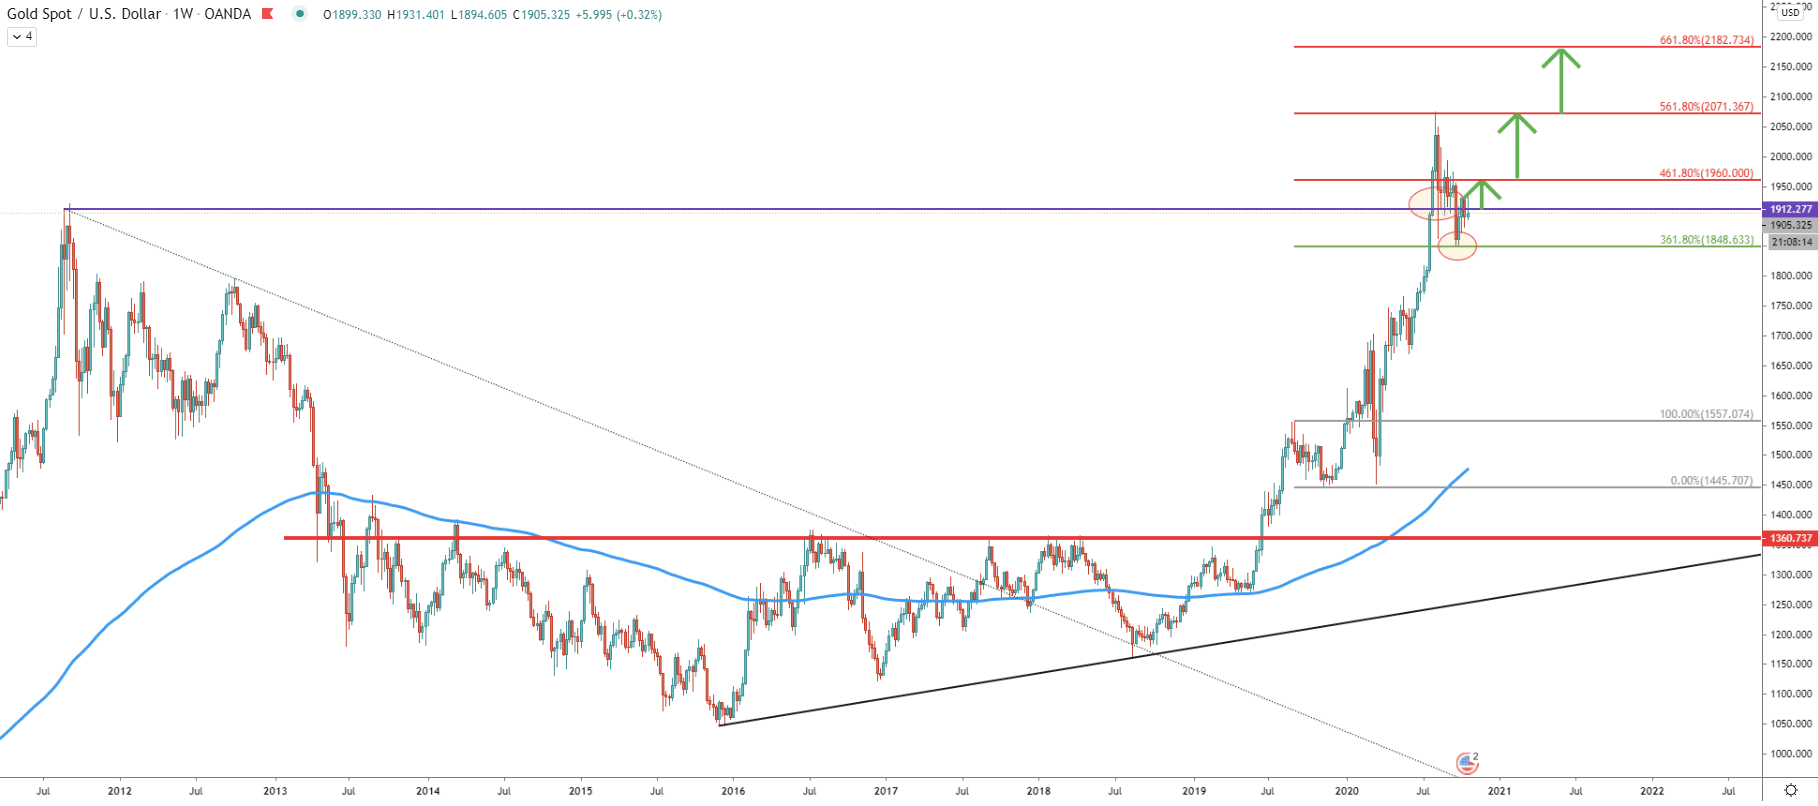
Since 2016 price of Gold has been rising, but only at the end of 2018, it went up exponentially. Price went up from 1200 up to 2070 in just a few years. This shows an extreme pace of the USD devaluation, which might not stop.
This year Gold has established a new all-time high, after breaking above the previously established resistance at 1912. Perhaps the time has come for yet another upside rally because the current correction could have come to an end. Fibonacci applied to the corrective move down after price broke above the 1360 resistance shows, that 361.8% Fibonacci support at 1848 has been rejected cleanly, suggesting a continuous buying pressure. The nearest resistance could be at 461.8% Fibs area, which is at 1960. But, if the price will continue to break above each of the resistance levels, the doors for the rally will be wide open.
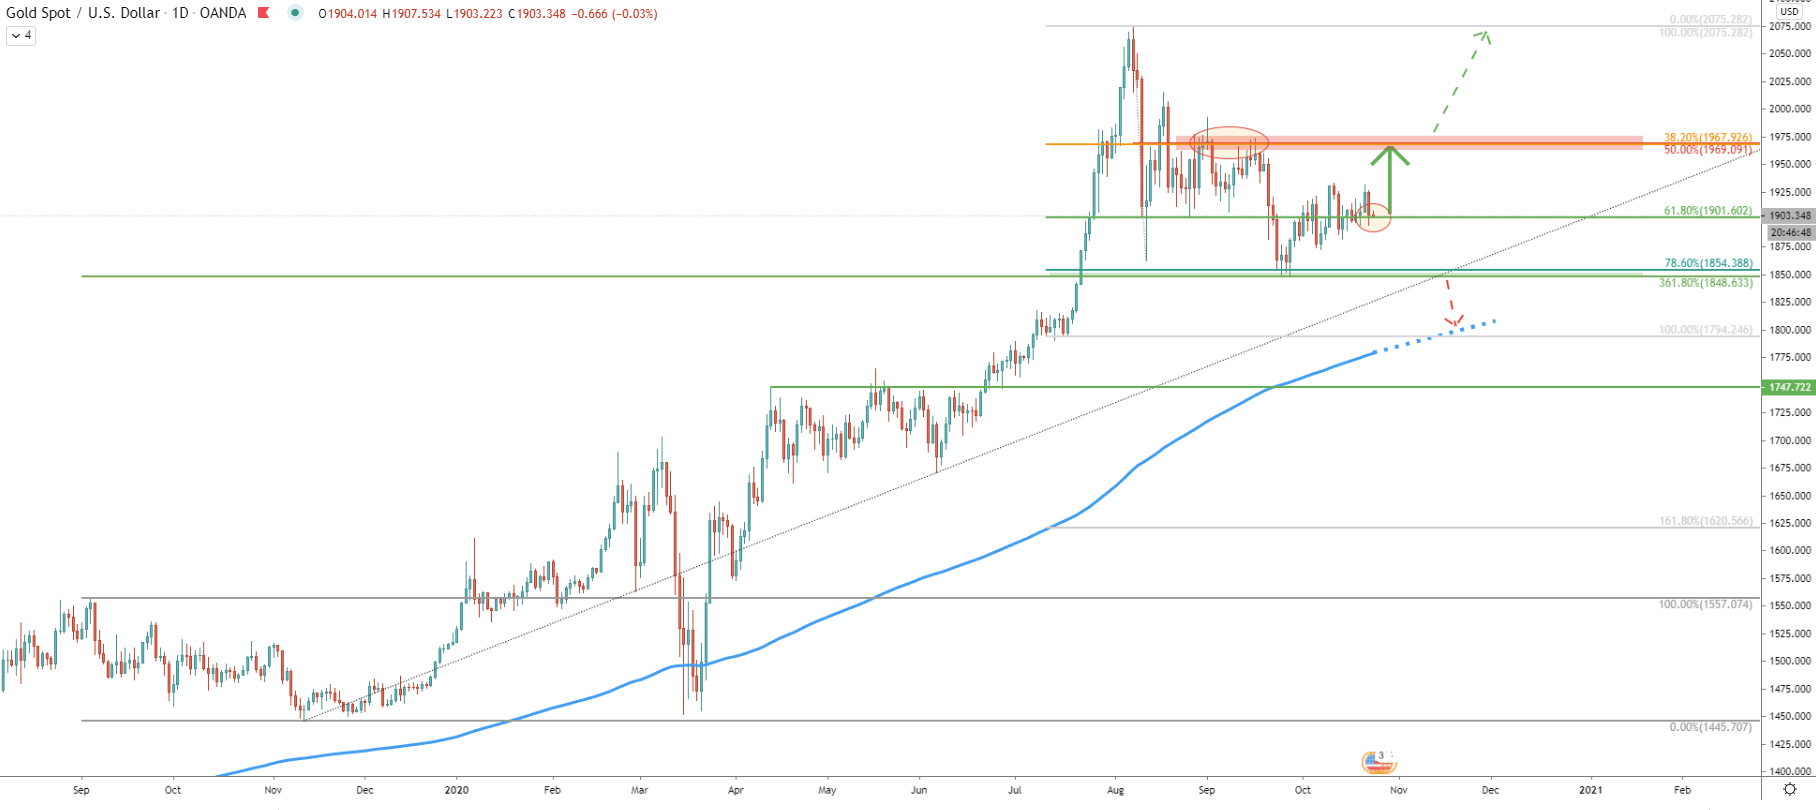
In the daily timeframe, the price of gold remains above the 200 Exponential Moving Average as well as the uptrend trendline. The support near the 1850 area is now confirmed by two Fibs, 361.8% as per the weekly chart, and 78.6% Fibs applied to the last upside wave. This Fibs also shows another support at 61.8%, which clearly corresponds to the 1900 psychological level. Today Gold is testing this support and so far it is being rejected. Therefore, as long as daily closing prices remain above 1900, XAU/USD should be expected to rise.
The resistance at 1970 area is also confirmed by two fibs, 50% and 38.2% as can be seen on the chart. Besides this support corresponds to the previously established resistance area.
On October 12 Gold broke above the simple downtrend trendline after cleanly rejecting the 200 Exponential Moving Average. Although then correction down took place and the price dropped towards 1885, where it rejected the 78.6% Fibonacci retracement level. The most recent price action shows the rejection of the 50% Fibs along with the downtrend trendline which is now acting as the support. Certainly, it seems that the time for an uptrend has come, but obviously, as long as the current support level is being respected. If this will be the case, XAU/USD should move up to 1969, which is now also confirmed by 227.2% Fibs applied to the current pullback.
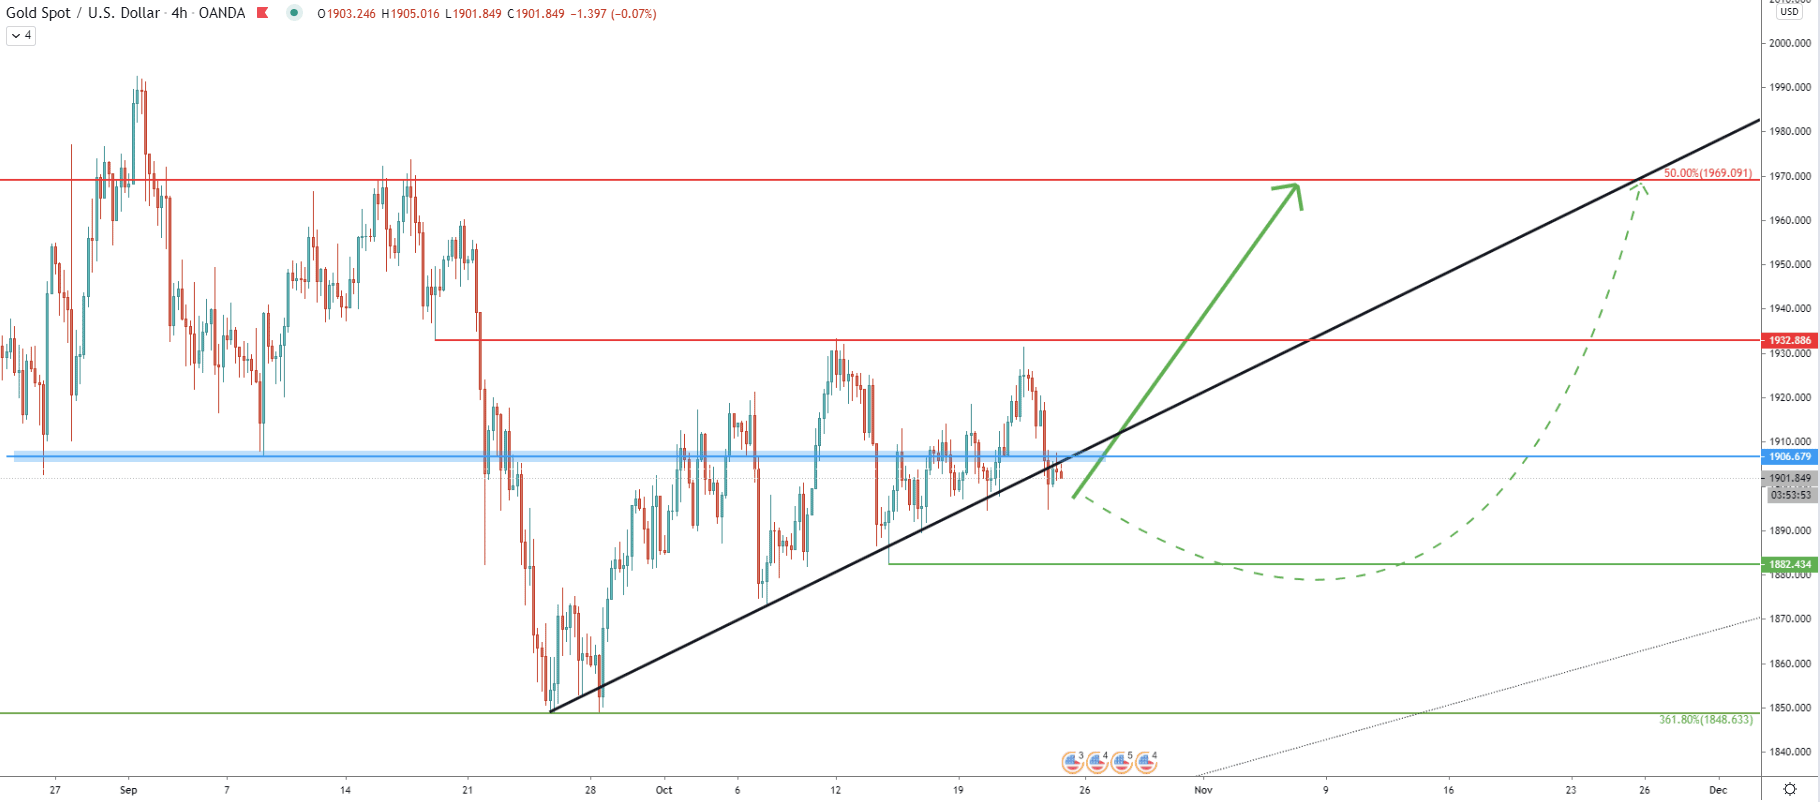
On the 4-hour chart, the uptrend trendline has been respected up until the current moment where the 4h closing price was just below the trendline. This might suggest that the price is not quite ready yet and prior to the uptrend continuation, there could be a stronger downside move. It could bring the price of golds towards the 1882 level, which is previously established support. If such a scenario will play out, it will be very important to see the rejection for 1882 in order to confirm the validity of an uptrend.
But at the same time, this could have been a false breakout and the price might start rising from this point onwards. But all-in-all, there is a minor resistance at 1906, which previously was the support. Buyers are likely to wait for a confirmed break above this level before stepping in.
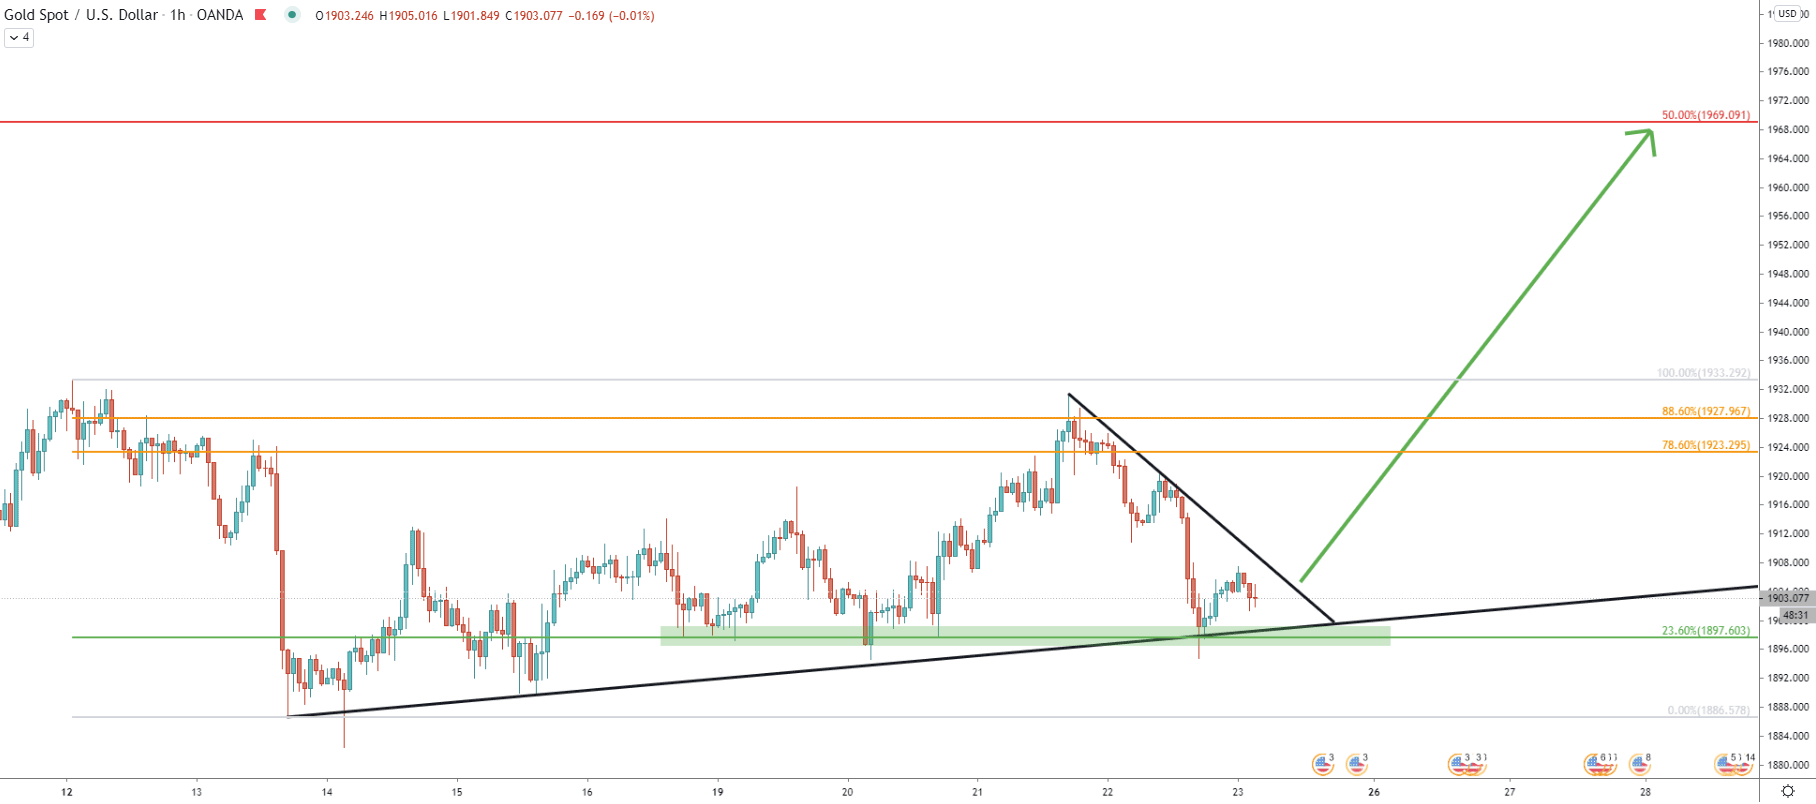
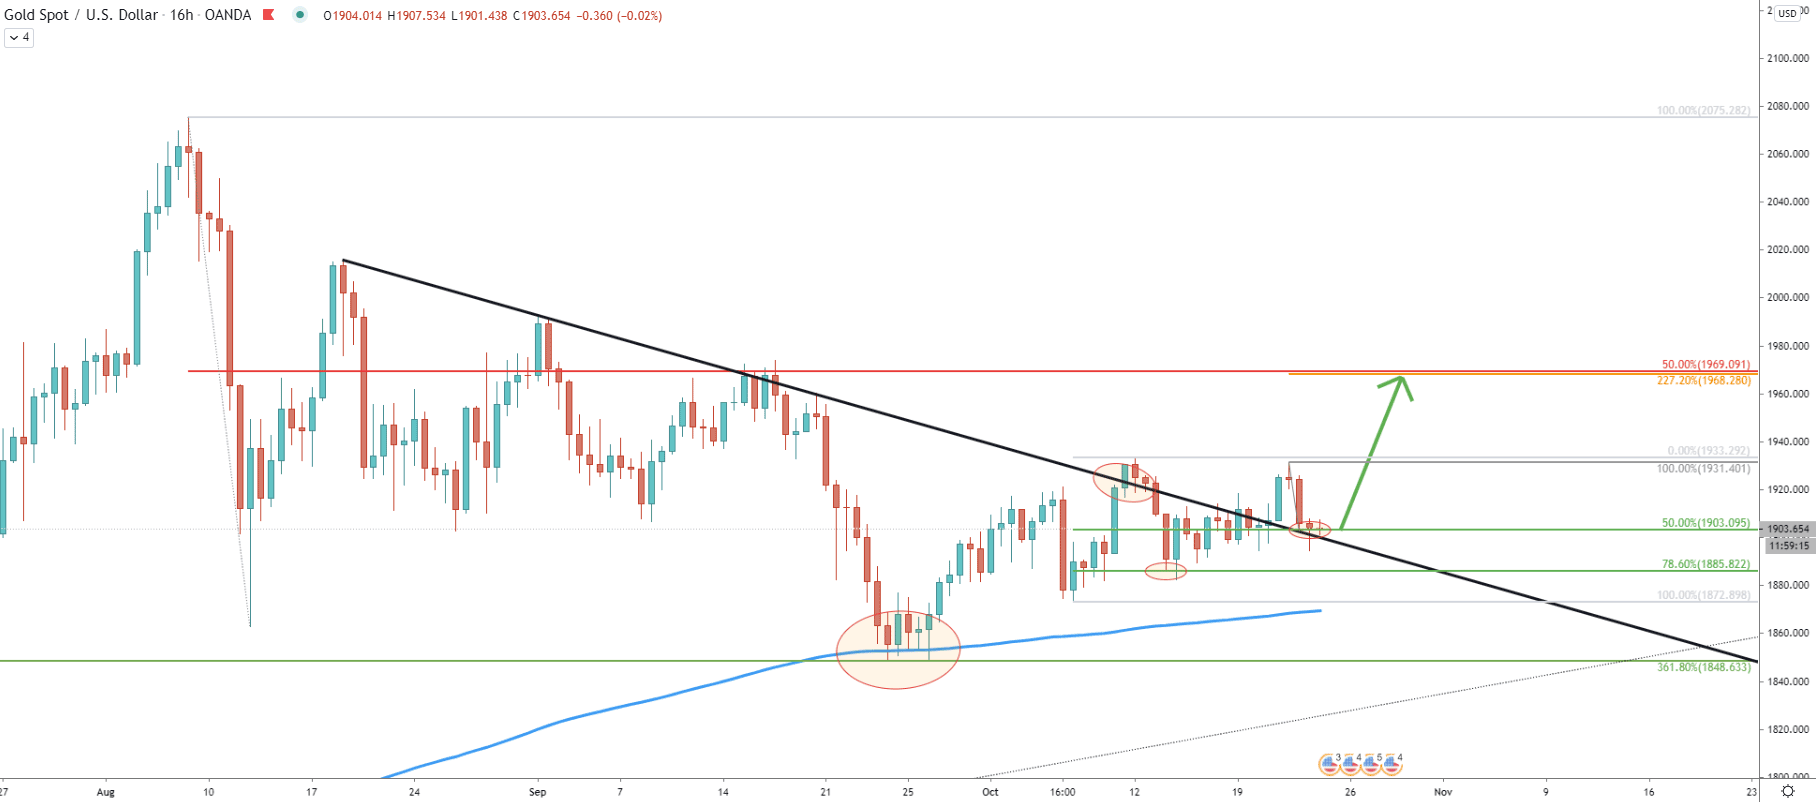
While on the 4-hour timeframe the uptrend trendline has been broken, on the hourly chart it clearly has been rejected. Along with the trendline, the 23.6% Fibonacci support at 1897 was also rejected today. This goes to show that most timeframes are in favor of the uptrend continuation, but only as long as the most recent low at 1984 holds. Break and close below this level will not completely invalidate the bullish outlook, but might result in a stronger downside correction towards 1882 support. At this stage, there is a downtrend trendline which must be broken, before/if the price of Gold will start rising. Therefore, right now it is a waiting time, but probably not for long.
Gold showing bullish signs on most timeframes, except for the 4-hour chart, where price broke below the uptrend trendline. Non the less, buyer pressure remains very strong and there are only a few minor confirmations needed for the uptrend probability to become much higher.
As per the weekly, daily, and 16-hour chart, the key resistance is located at 1969, which is confirmed by 3 different Fibonacci retracement levels and corresponds to the previously established resistance area.
As per the daily chart, break and close below 1848, will completely invalidate the bullish forecast. Then Gold is likely to initiate a consolidation phase or even drop towards the 1800 psychological level, which corresponds to the 200 Exponential Moving Average.
Support: 1900, 1982, 1848
Resistance: 1969, 2071, 2182