
Published: February 16th, 2021
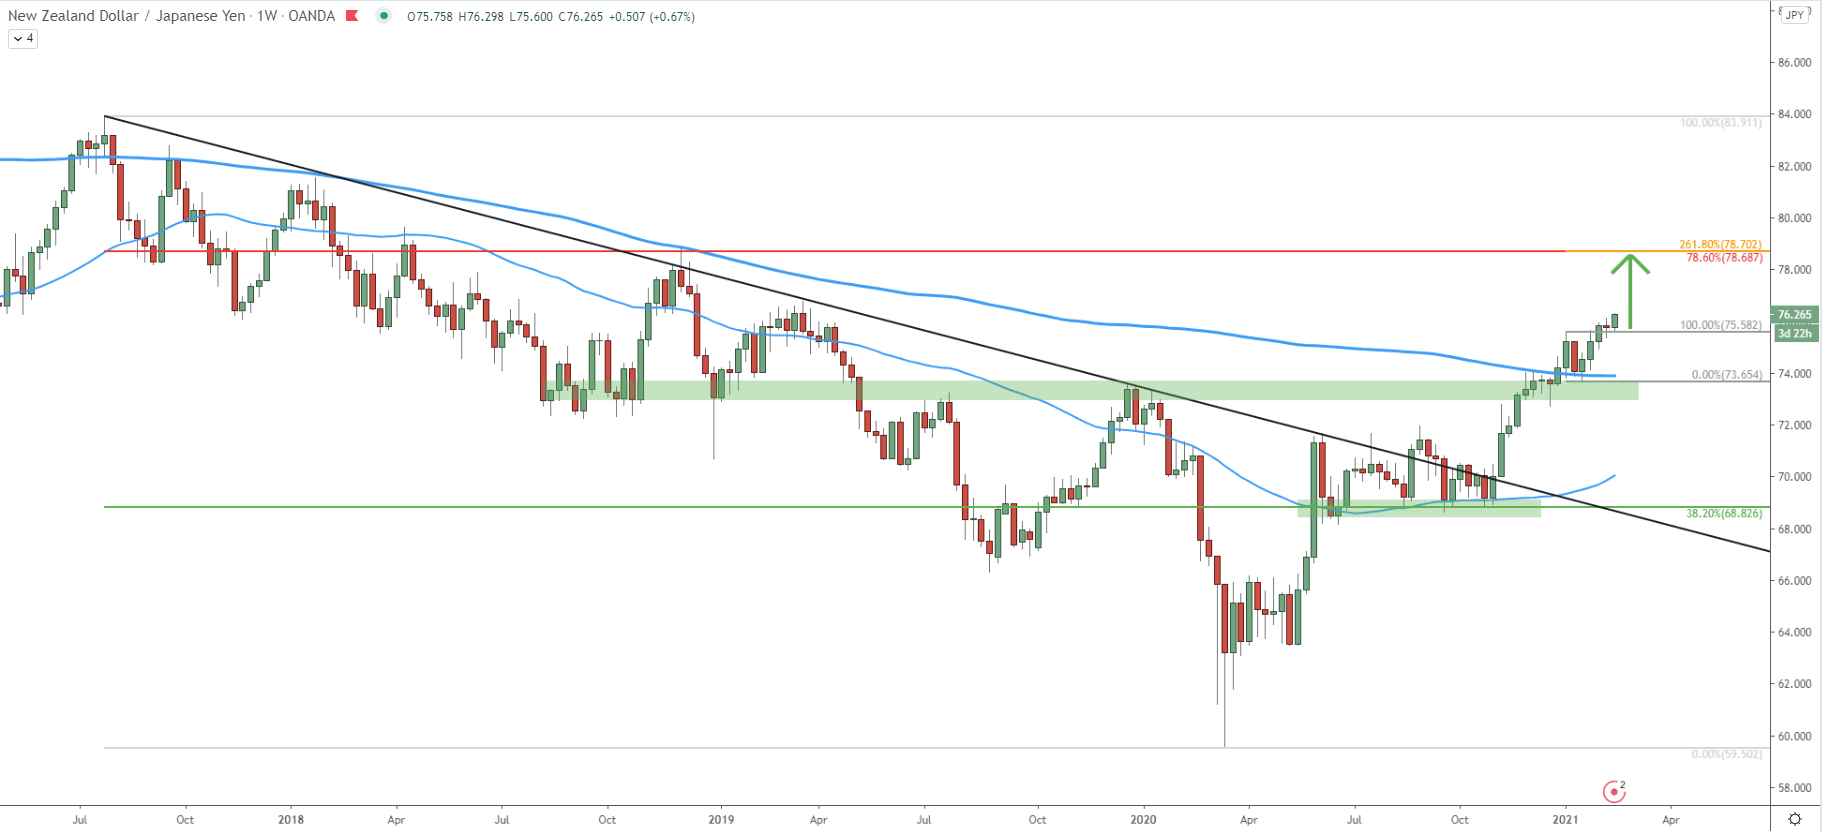
The weekly chart goes to show, that price is now on a steady rise and the uptrend seems to be the case for the long run. If we go back to the May-November 2020 price action, it can be seen that strong support has been formed at 68.82, which is a 38.2% Fibonacci retracement level as per the chart above. Along with the Fibonacci level, the 50 Simple Moving Average was also rejected multiple times. But then, the price struggled to break above the 71.50 resistance area, where the downtrend trendline was initially rejected.
However, in December 2021 there finally was a confirmed break above the resistance, although this time, the price was facing yet another resistance, which is the supply/demand area near 74.00. At first, it got rejected together with the 200 Simple Moving Average, showing that bears are still attempting to push the price lower. Nonetheless, in early January, after a confirmed break above the 74.00 resistance area, there could have been a final confirmation, that the long-term trend has turned bullish.
It seems that right now, bulls are in complete control, which should result in the continuation of an uptrend. While this might last for an extended period of time we should consider the nearest key resistance. Based on two Fibonacci retracement levels, the first strong obstacle for buyers could be located at 78.70, which is over 200 pips away from the current price.
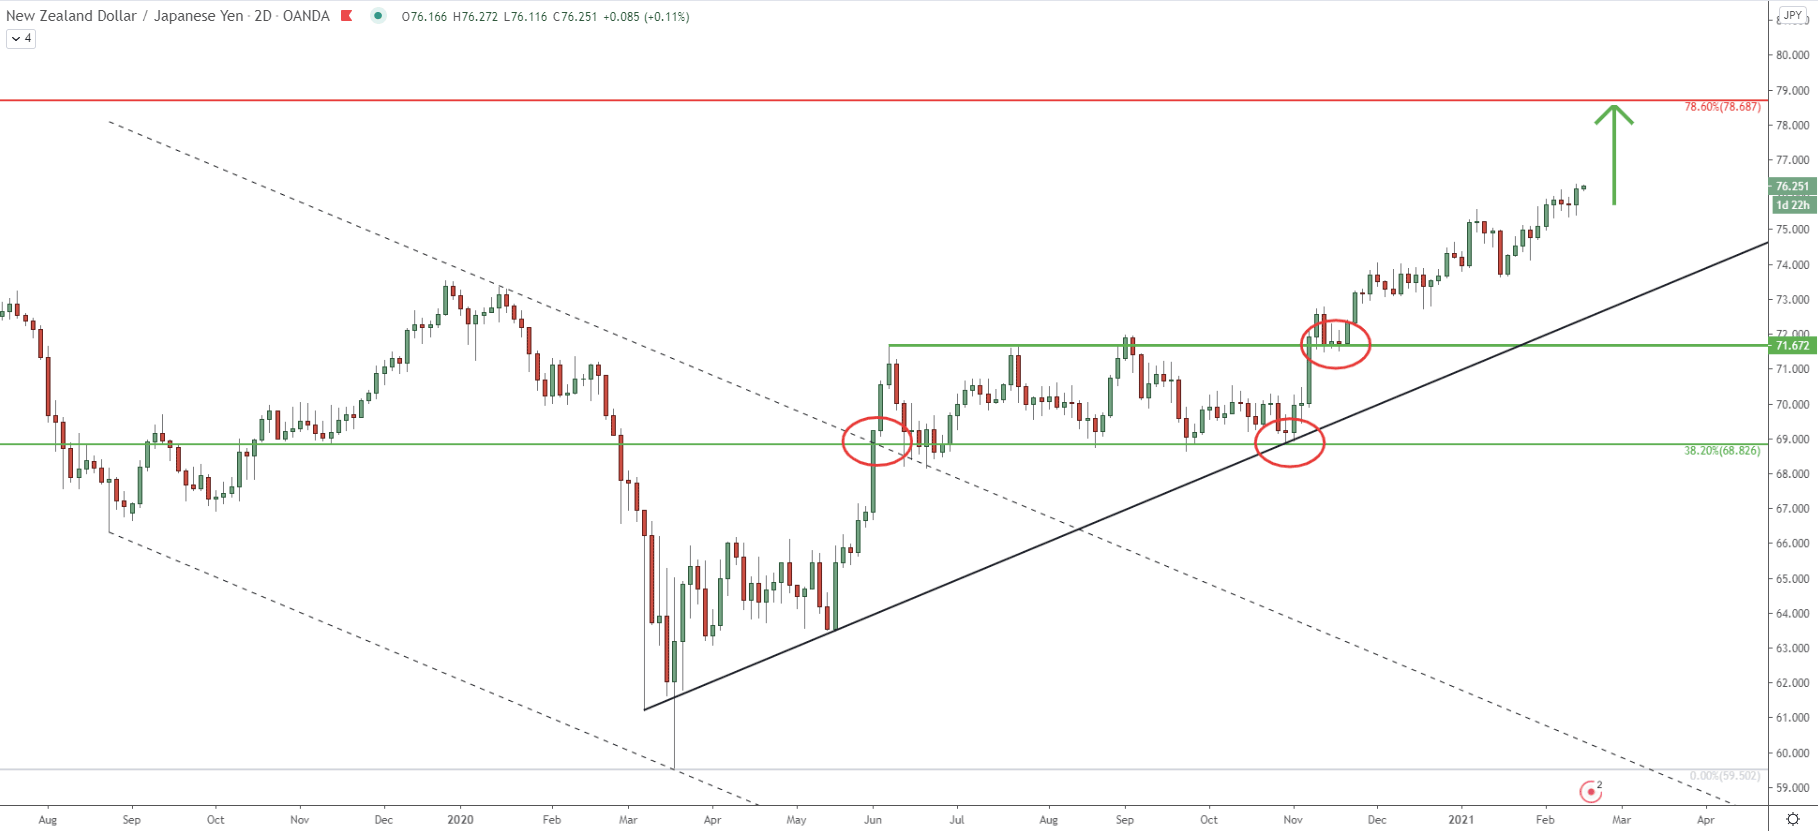
On this chart price broke above the descending channel, after which the consolidation phase took place. Price has been ranging between the 68.80 support and 71.60 resistance area for nearly 6 months. But right after the price bounced off the simple uptrend trendline, strong buying pressure pushed the price above the 71.60 resistance. It can be seen, that after the breakout, the price pulled back slightly and found support at 71.60. Then, obviously, the uptrend continued.
Right now, the uptrend is very consistent, although small pullbacks and/or corrections might take place. And this is exactly what buyers could be waiting for, an opportunity to get in the NZD/JPY buying opportunity while minimizing the risk.
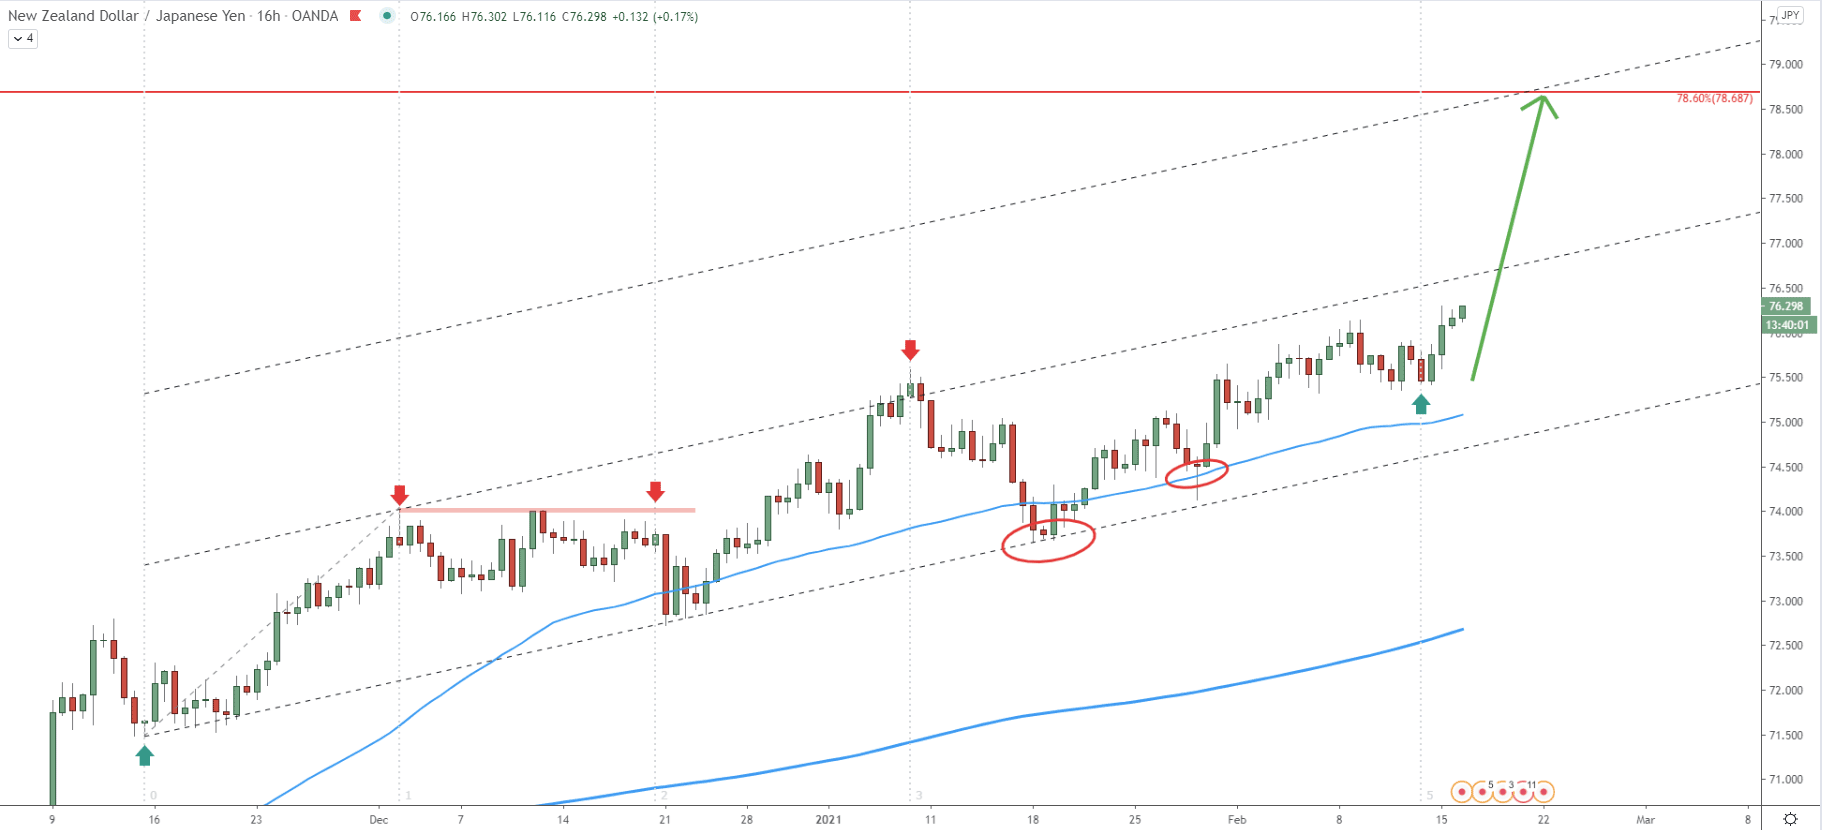
Price continues to move within the ascending channel while rejecting the uptrend trendline along with the 50 EMA. Based on the Fibonacci cycles indicator, it can be seen, that a new cycle has started a few days ago. Considering that since then price has been able to produce a new higher high, it would be reasonable to assume that this is now a bullish cycle. The current upside wave should bring the price towards the 78.60 resistance area, which on this chart, corresponds to the upper trendline of the extended ascending channel. This suggests, that the upside move can be relatively fast, and NZD/JPY is likely to test the resistance before the end of February.
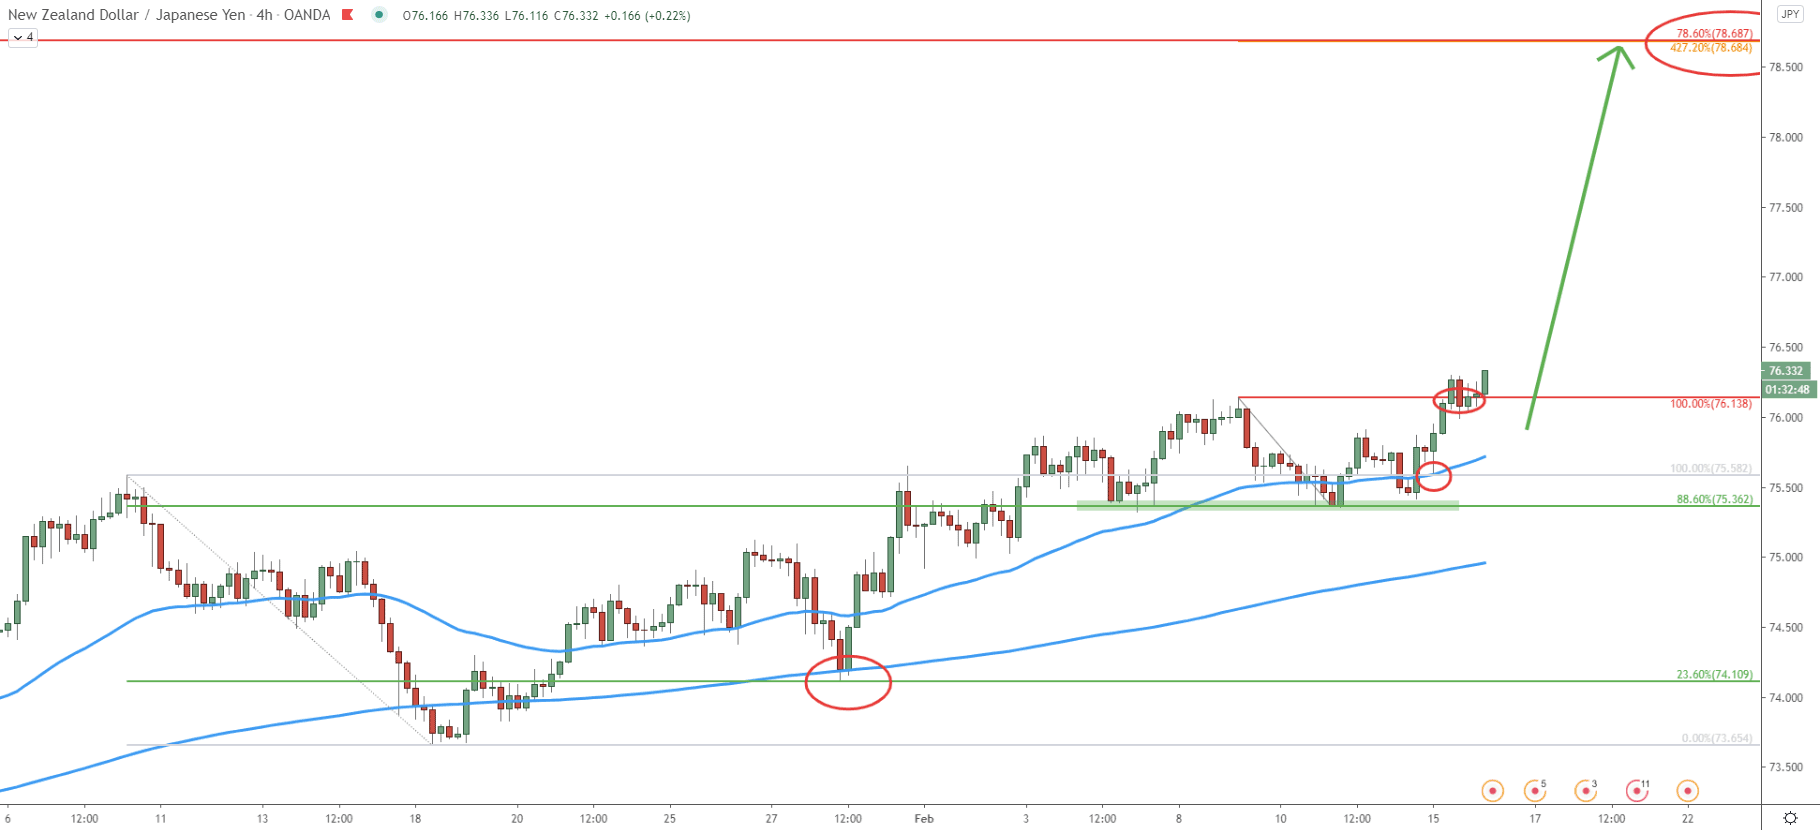
Based on the Fibonacci retracement indicator, applied to the previous corrective move down from 75.58 to 73.65, two support levels can be spotted. The first is 23.6% Fibs at 74.10, which got rejected along with the 200 SMA. Then the price went up, produce a new higher high, and started to form the support near 88.6% Fibs at 75.36. This support was rejected two consecutive times, and then after the bounce off the 50 SMA, it went up yet again. The previous high is broken and it seems that the uptrend continuation is just a matter of time. While the price might consolidate for a short period of time, it still can be expected to move towards the 78.60 resistance as long as 75.36 support is being respected.
On this chart, the key resistance corresponds to the 427.2% Fibs, applied to the pullback towards the 75.36 support. Therefore, now we have 3 different Fibonacci levels, which area all pointing out to the 78.60 being a key resistance area.
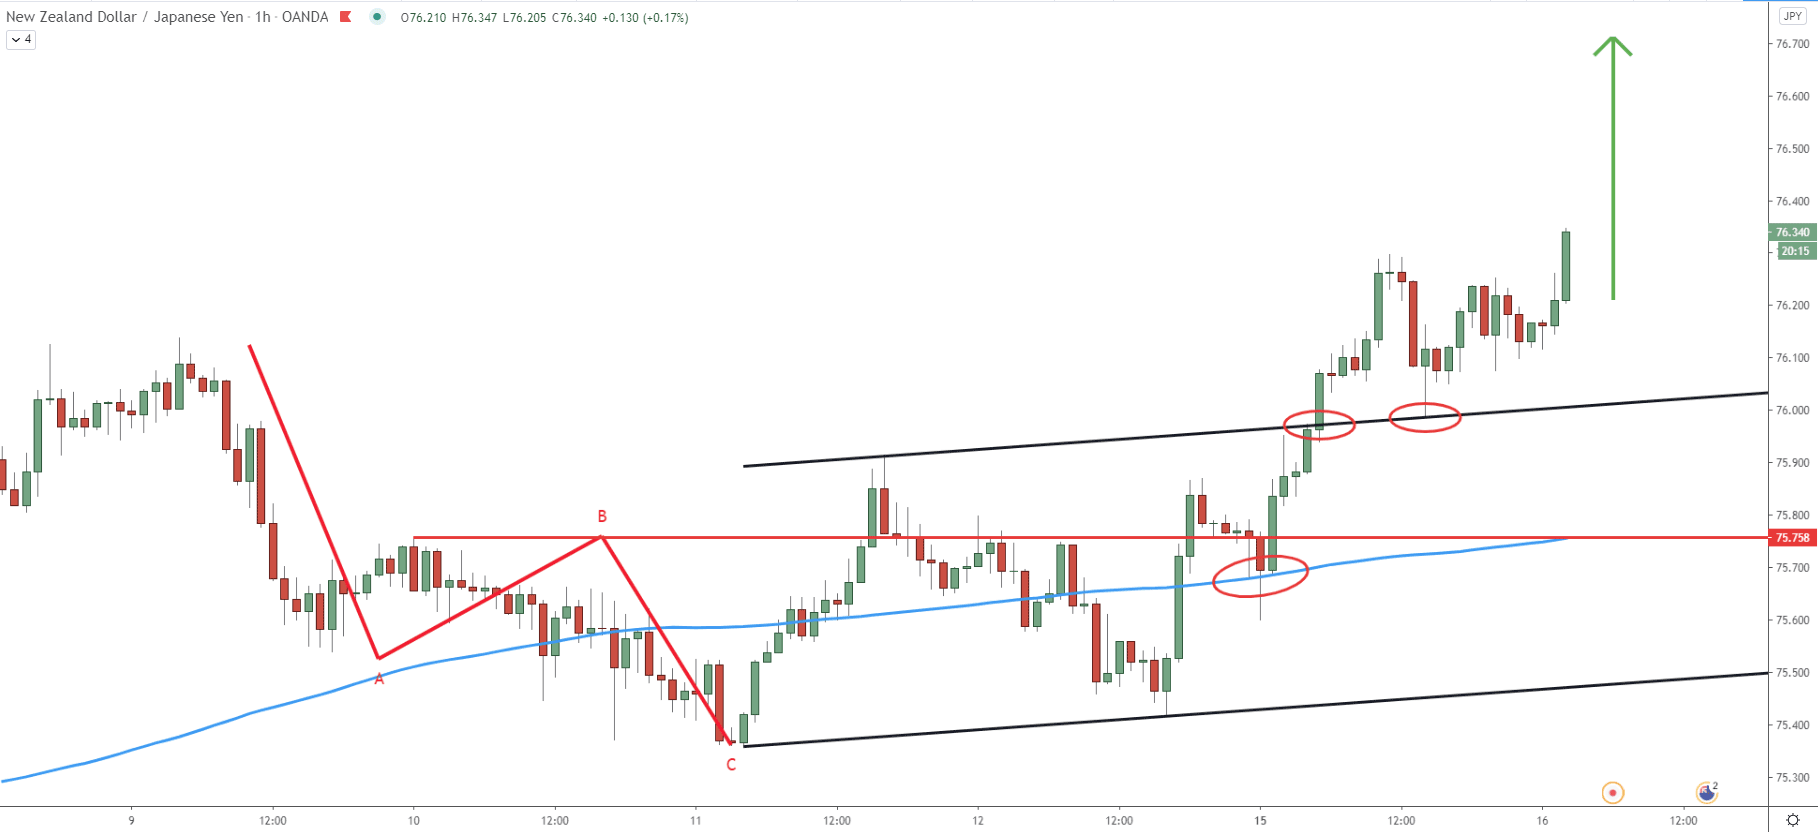
NZD/JPY has completed an ABC correctional pattern based on the Elliot Wave theory. The price broke above the B wave confirming the continuation of an uptrend. After short consolidation, the price rejected the 200 SMA and broke above the ascending channel. The most recent price action shows, that NZD/JPY corrected down, and found support at the upper trendline of the channel. Perhaps this was the beginning of the uptrend continuation and the very attractive price for buyers.
Price continues to show that support levels are being respected while higher highs are being printed. NZD/JPY has established a long-term uptrend, which should result in a further price increase by over 200 pips in the coming weeks.
As per the weekly, 2-day, and 4-hour charts, there are 3 Fibonacci retracement levels all pointing out to the 78.68 as being the nearest key resistance level. Obviously, this might be a strong profit-taking zone for buyers, which if rejected when reached, can result in a strong downside move.
As per the 4-hour chart, the key support, based on the 88.6% Fibonacci retracement level, is at 75.36. Daily break and close below this price will invalidate bullish outlook and in such scenario, a stronger corrective move down can be expected.
Support: 76.00, 75.50, 74.10
Resistance: 78.70


