
Published: June 16th, 2026
The Kroger Company (KR), a food and medicine retailer in the US, has a $38.6 billion market capitalization, runs a variety of food and drug shops, multi-department retail outlets, and more.
"Big-cap stocks" are generally defined as businesses with a market capitalization of $10 billion or more. Given its size and importance in the supermarket business, KR's market capitalization surpasses this level, placing it squarely in that group.
Despite its performance, KR's stock fell 17.8% since its 52-week record of $76.58 on March 12. Over the last three months, the stock has dropped 15.1%, falling short of the 9.9% increase in the S&P 500 Index ($SPX).
Furthermore, over time, KR has fallen behind the overall market. Over the last 52 weeks, the stock has gone down 4.8%, while the SPX has returned 23.4%.
As the earnings report approached, investors were skeptical about this stock with a neutral buy mode. A proper price prediction can be found from the KR multi-timeframe analysis.
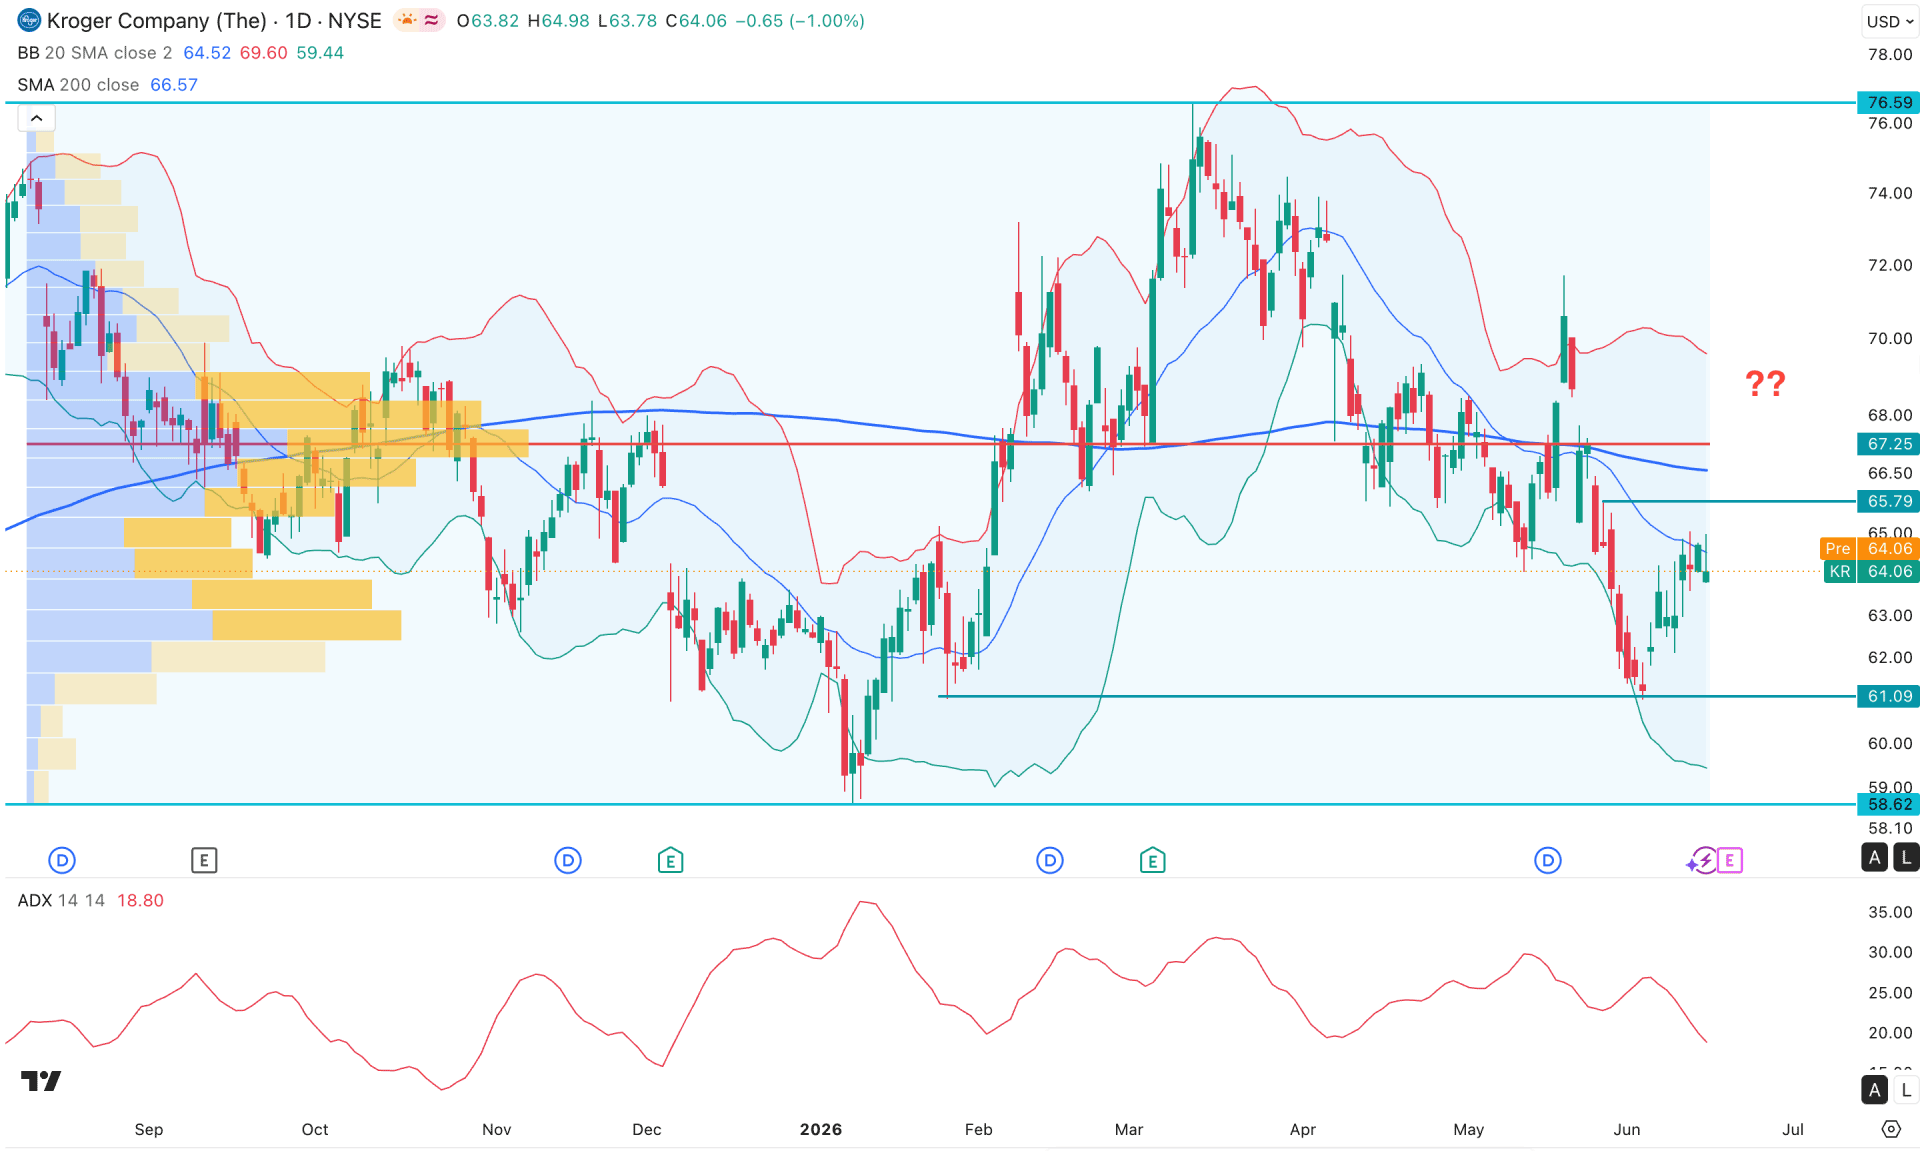
On the daily chart of Kroger (KR), the stock is trading in a discounted price area, with a minor bullish bounce from a static support level. However, the recent rebound is not sufficient to consider a valid bullish trend reversal. In that case, more confirmations are needed before taking a long order.
Before proceeding further, let's see how the price action is doing in the higher timeframe. In the monthly timeframe, two consecutive bearish candles are present, taking the price to the discounted area. However, the existing swing low of the 58.62 level is still protected, creating hope for bulls.
Moreover, the weekly timeframe shows a similar outlook, where the recent price is still trading within a continuation pattern, and the immediate support is marked at the 61.09 level. As long as the price remains above this area, a bullish correction is possible.
In terms of volume, sellers are dominating the price, as the largest activity level since August 2025 is above the current price. Moreover, a recent buy-side liquidity sweep with an immediate bearish reversal in May 2025 signals seller dominance in the price.
Looking at the main price chart, a downside continuation is visible, with the most recent price trading below the mid-Bollinger band line, signaling a bearish possibility. Moreover, the 200-day SMA is above the current price, with a bearish slope at the 67.25 high-volume resistance level. As both lines are above the current price and have a bearish direction, the ongoing market momentum could remain on the sellers' side.
In terms of the strength of a trend, the Average Directional Index shows corrective market momentum, where the current line is below the 20.00 threshold level.
Based on the current market structure, the immediate resistance level to look at is the 65.79 area. As long as the price remains below this resistance line, the downside continuation is highly possible. The immediate support level to look at is the 61.09 level, which could be tested before creating a new low below the 58.62 area.
On the bullish side, a failure to hold the pressure below the high volume line, with an immediate bullish recovery above the 67.25 level, could open the room for reaching the 76.59 resistance level.
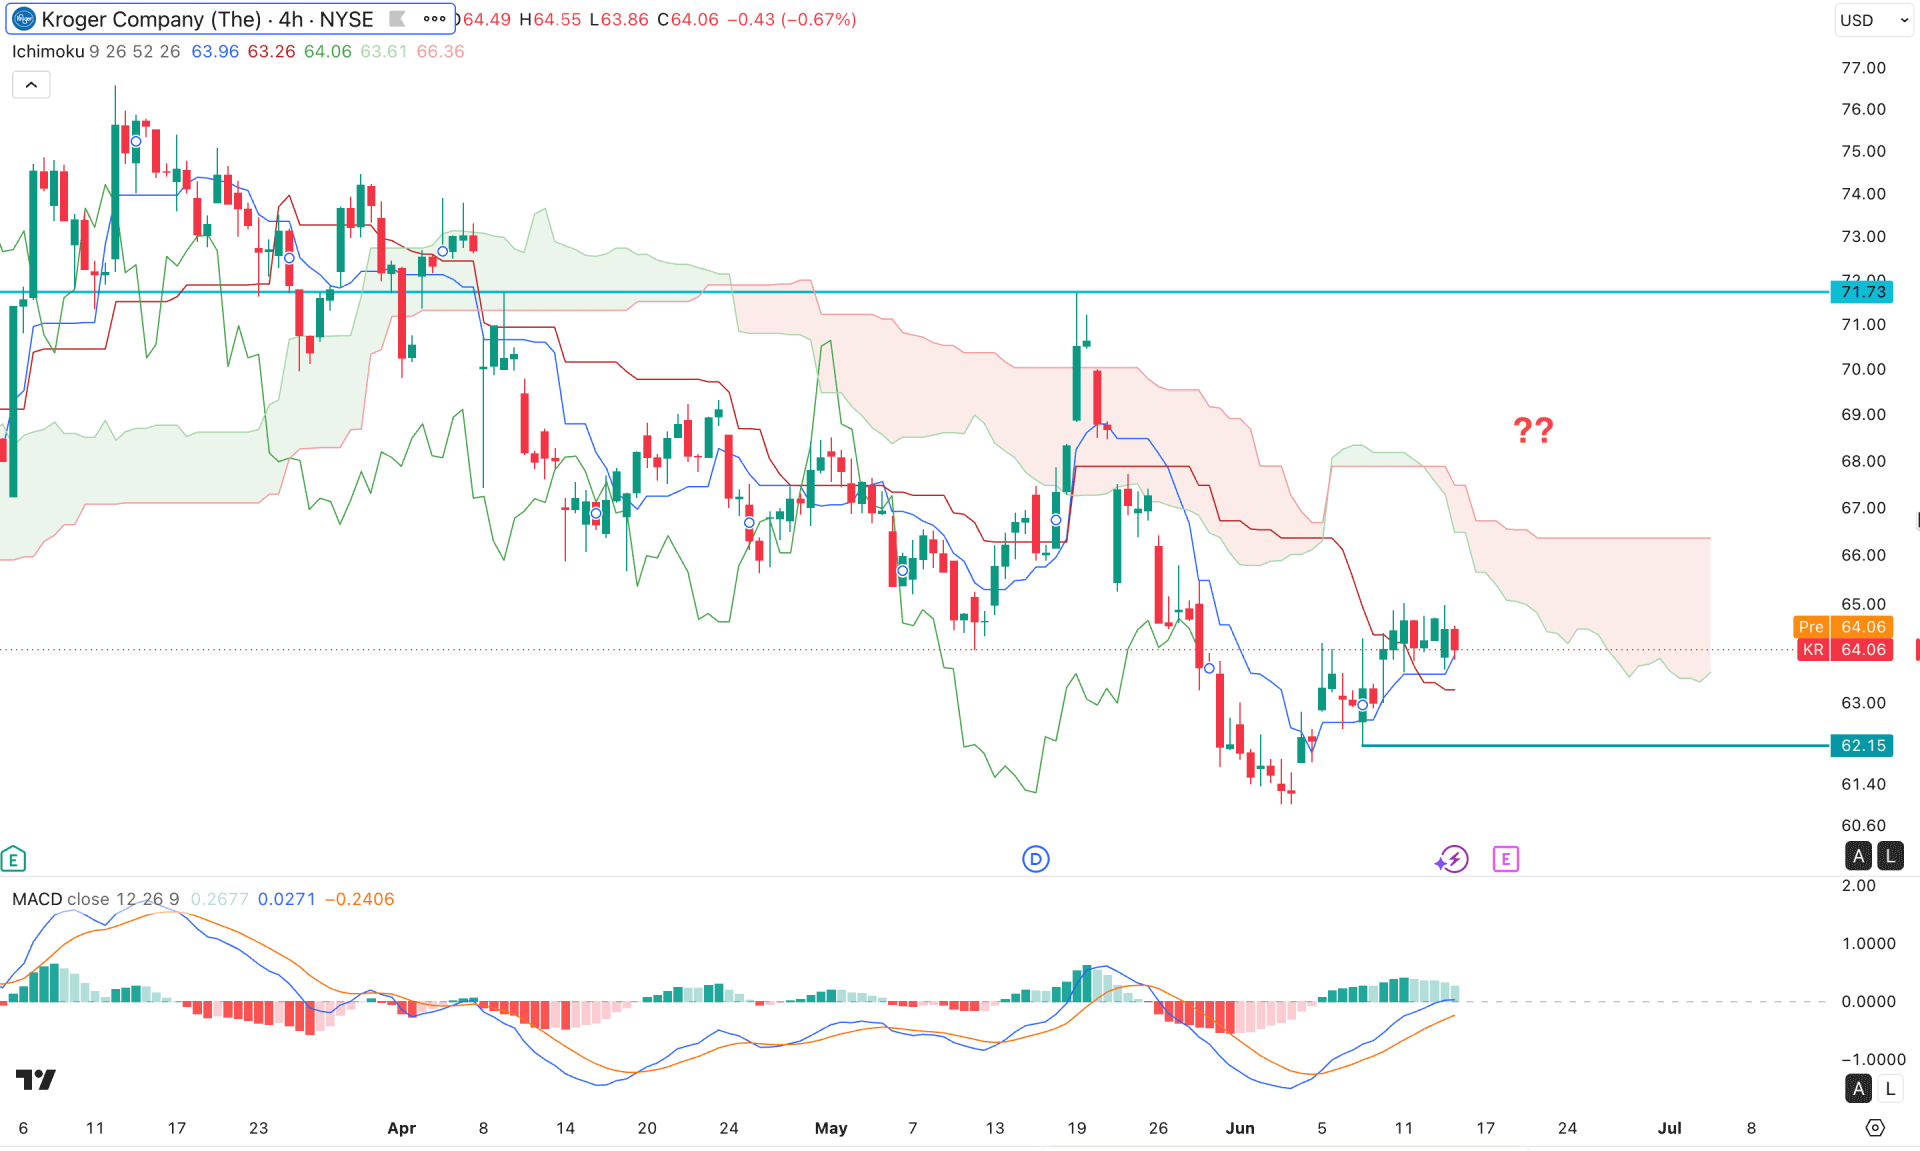
In the H4 timeframe, KR stock is trading within bearish pressure, where the current price is heading down below the Kumo cloud area. Moreover, the future cloud's thickness is solid for a bearish continuation, signaling pressure on buyers.
In the secondary indicator window, the MACD histogram remains in the positive area but is weakening. The recent price lines have failed to maintain buying pressure. On the other hand, the signal line has formed a bullish crossover and reached the neutral area, creating indecision.
Based on the overall market structure, multiple four-hour candles above the Kijun line, with selling pressure from the future cloud, signal an indecisive market momentum. In that case, the downside continuation possibility is limited until the price breaks below the 62.15 support area. On the bearish side, the next support to look at is the 58.71 level.
On the bullish side, multiple rejections are pending at the Kumo cloud area. After overcoming the 68.00 psychological line, the price might face a barrier at the 71.73 key resistance level. Overcoming this double top area could open a long opportunity targeting the 80.00 psychological level.
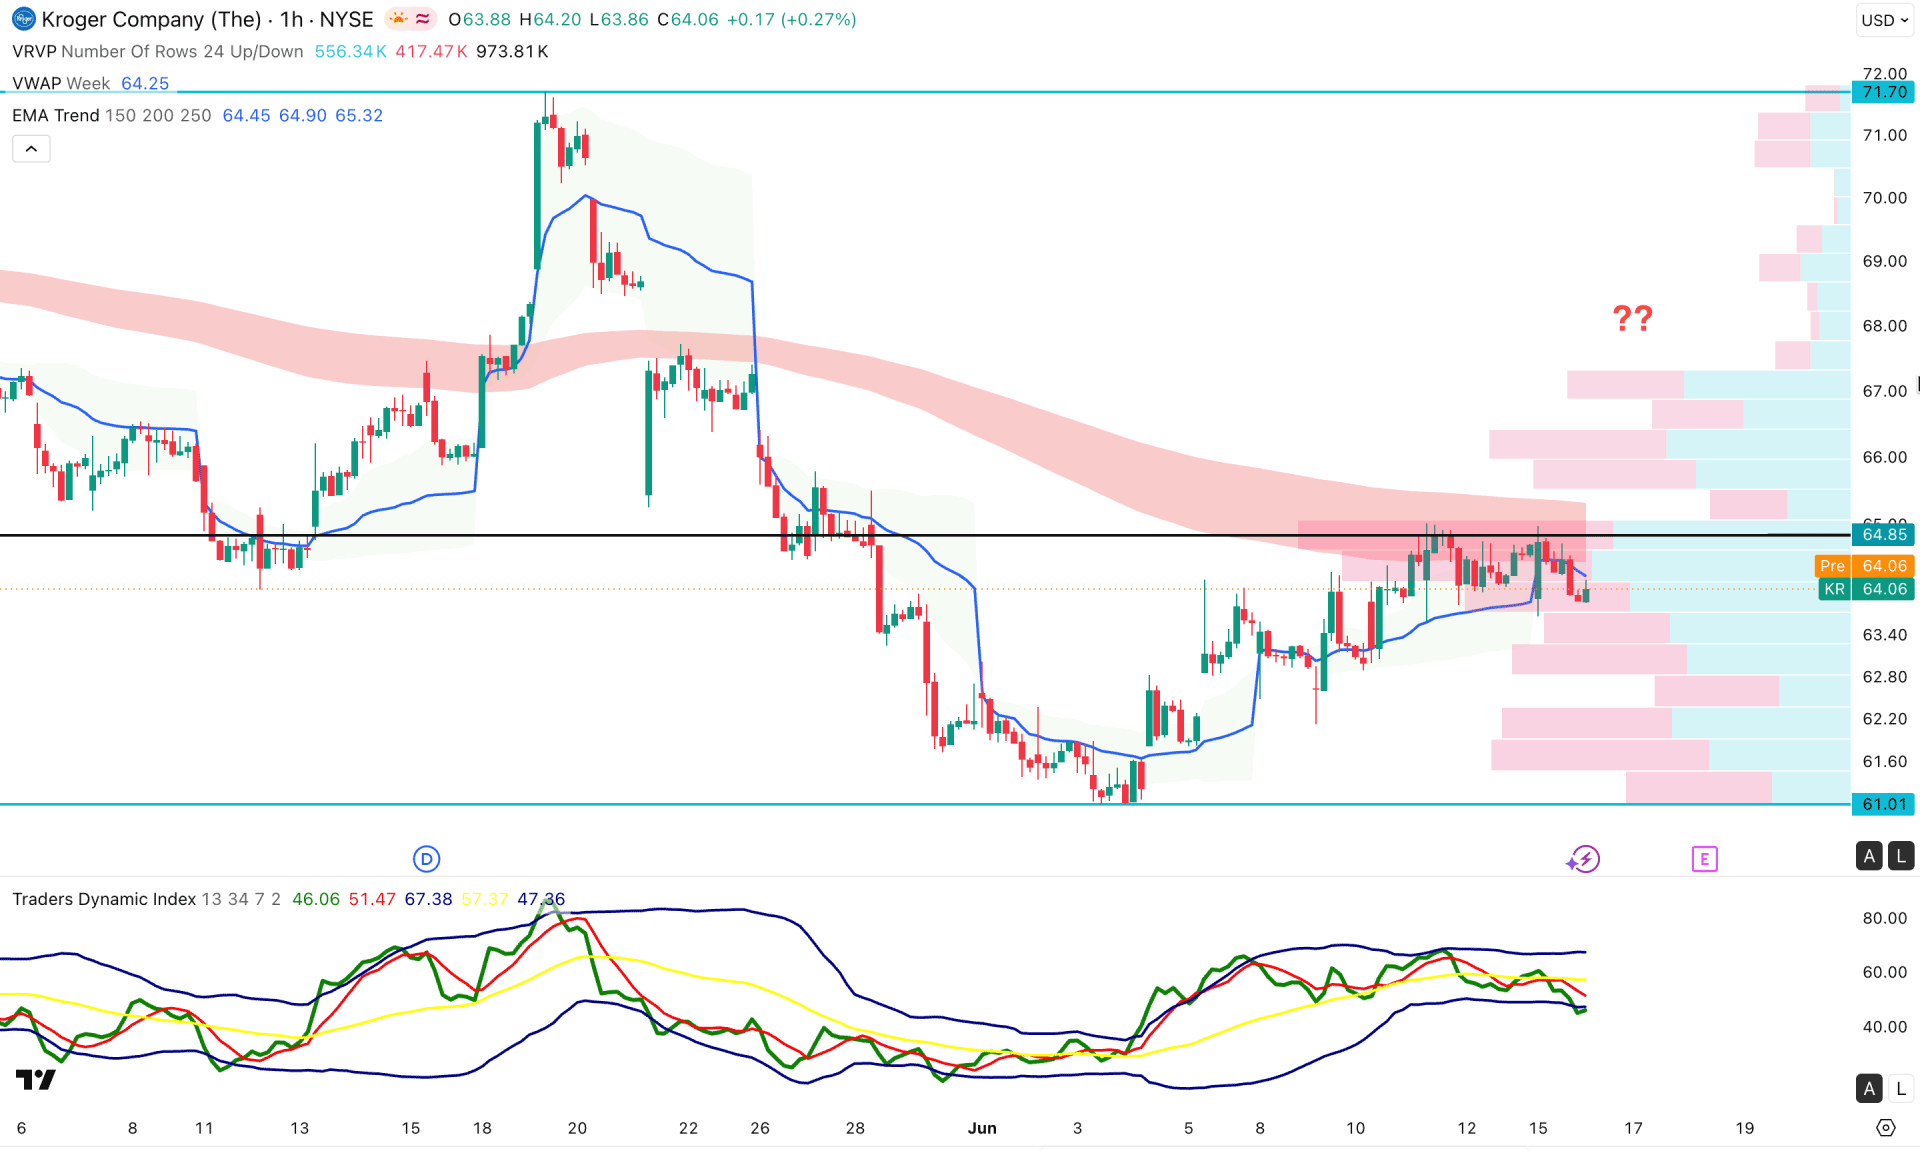
In the hourly timeframe, the price is still trading in the discounted area. From here, the most recent price shows selling pressure at the intraday high volume line. Primarily, it is a sign of a bearish continuation opportunity, following the major market trend.
The EMA wave and weekly VWAP line are above the current price, working as immediate resistance. Moreover, the Traders Dynamic Index is showing a bearish divergence, where the current line is in the lower band area.
Based on the hourly market structure, a bearish continuation is possible, where the immediate support is marked at the 61.01 level. However, the price is consolidating at the high-volume line, and a bullish breakout with a stable price above the 66.00 level could open the room for testing the 71.70 area.
Based on the overall market structure, the Kroger company is trading under bearish pressure. Therefore, one more bullish push is needed before validating the bottom. As the earnings session is approaching, a better-than-expected earnings report with a positive stock sentiment could increase the bullish possibility after forming a valid rebound.


