
Published: July 14th, 2022
The Internet Computer (ICP) enables people to participate in the native network’s governance to boost the computation system. Since its inception, the ICP token has become available to traders in February 2018, but its price action provided a decent trading opportunity after it became transferable in May 2021.
The Internet Computer has become an innovation in the tech industry, but its presence as an alternative to traditional IT has made a breakthrough in the industry. The whole system of this network is backed by blockchain technology to provide a swift movement with higher efficiency. As a result, developers and entrepreneurs can make next-generation codes using blockchain technology so that they can grab world wide web users.
Although the network appeared worldwide as an innovation, ICP/USDT price failed to show sufficient buying momentum due to the absence of price-driving economic events. Moreover, the broader crypto market is moving under selling pressure, and there is still no sign of a recovery.
Let’s see the future price direction of Internet Computer (ICP) from the ICP/USDT Technical analysis:
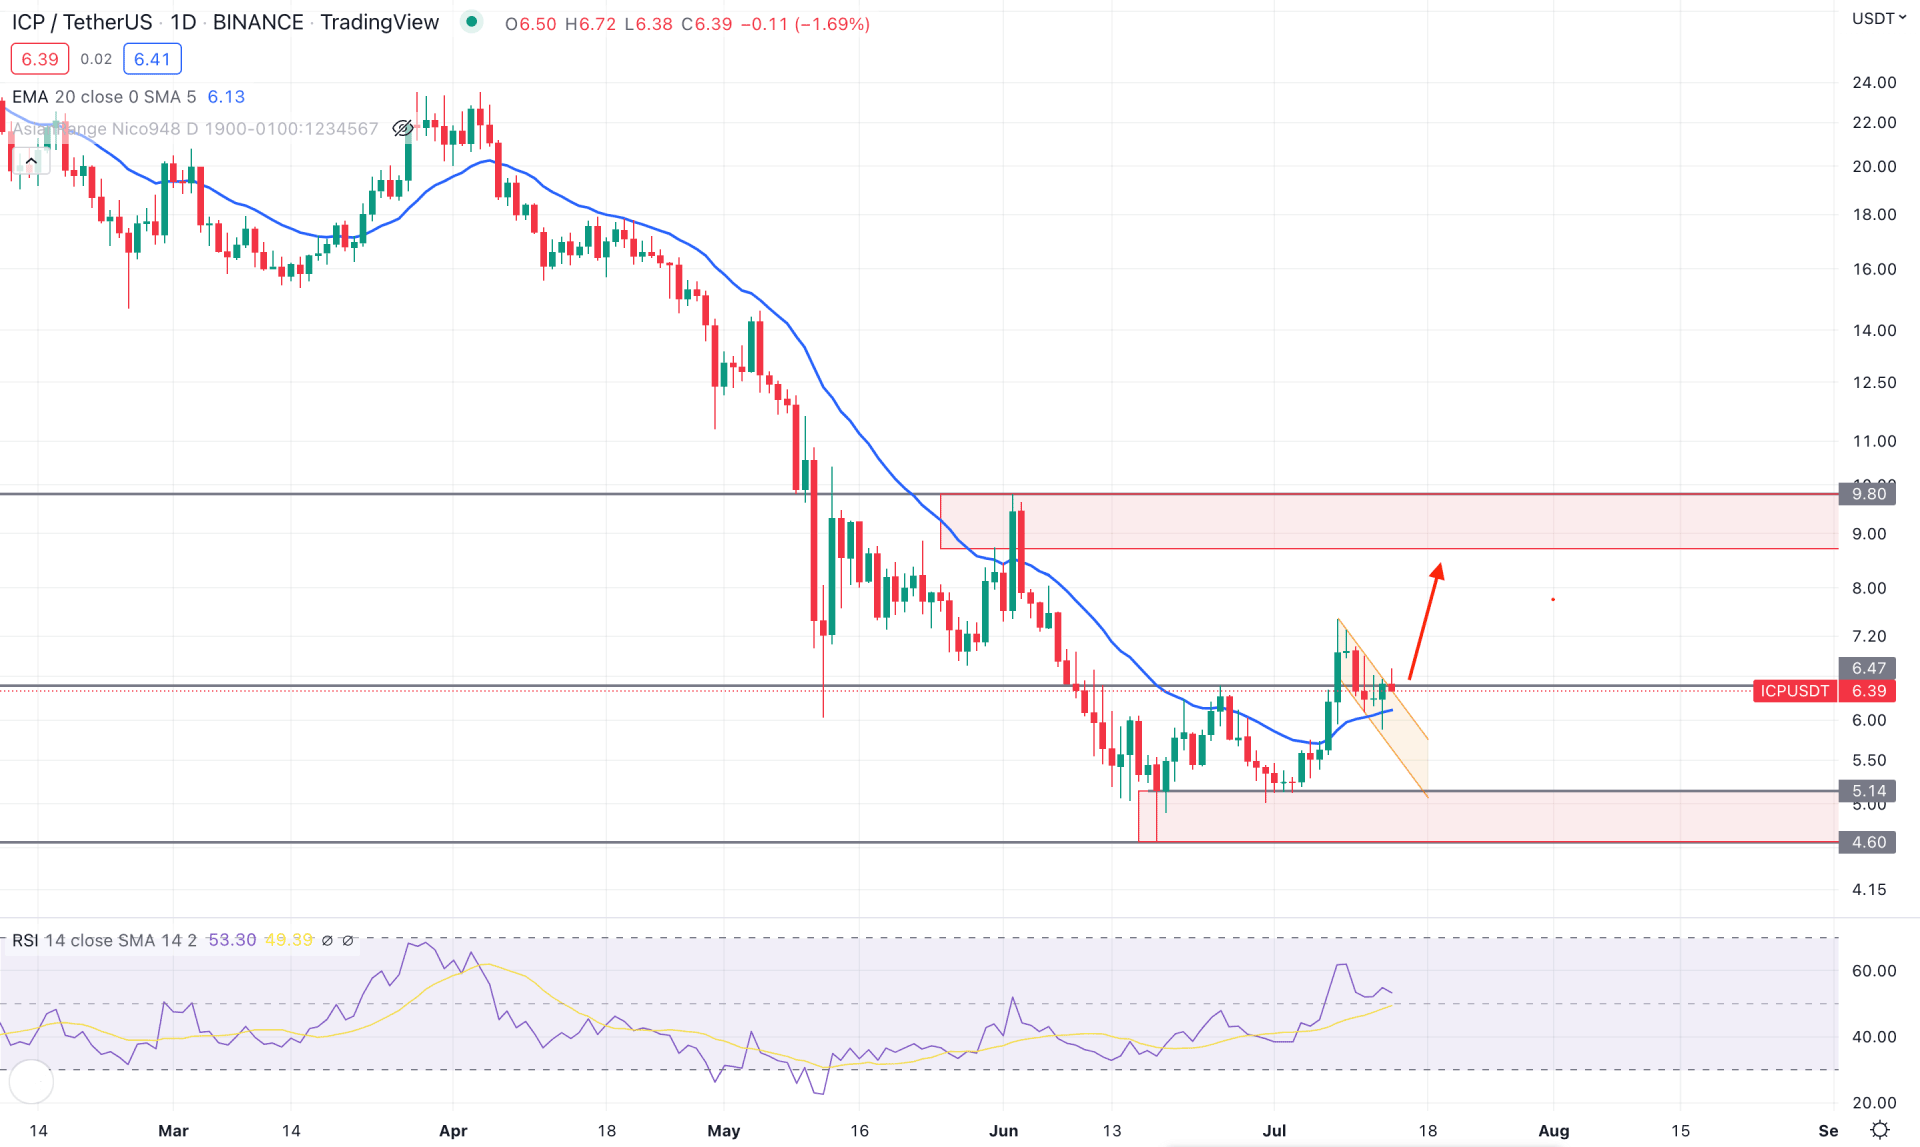
In the ICP/USDT daily chart, the current price formed a bullish Quasimodo at 4.60 bottom. Moreover, the new swing is high above the 6.47 resistance level, indicating the 5.14 to 4.60 area as a valid demand zone. Therefore, any bearish correction towards the demand zone would increase the bullish opportunity in this pair towards the 10.00 level. On the other hand, the dynamic 20-day moving average is below the price with a bullish pin bar above it. It indicates that the price has faced a strong buyers’ interest from short-term traders where further upside momentum is potential.
The above image shows how the Relative Strength Index (RSI) moves above the neutral 50 level, where the further upside pressure towards the overbought 70 level is pending for the indicator. The price is also trading within a descending channel where a strong bullish breakout on the buyers’ side is needed to consider it as a buying momentum.
Based on the daily structure, investors should wait for a strong bullish daily candle above the 6.60 level to consider it a buy towards the 9.80 level. On the other hand, a break below the dynamic 20 EMA could extend the selling pressure towards the 5.14 demand zone.
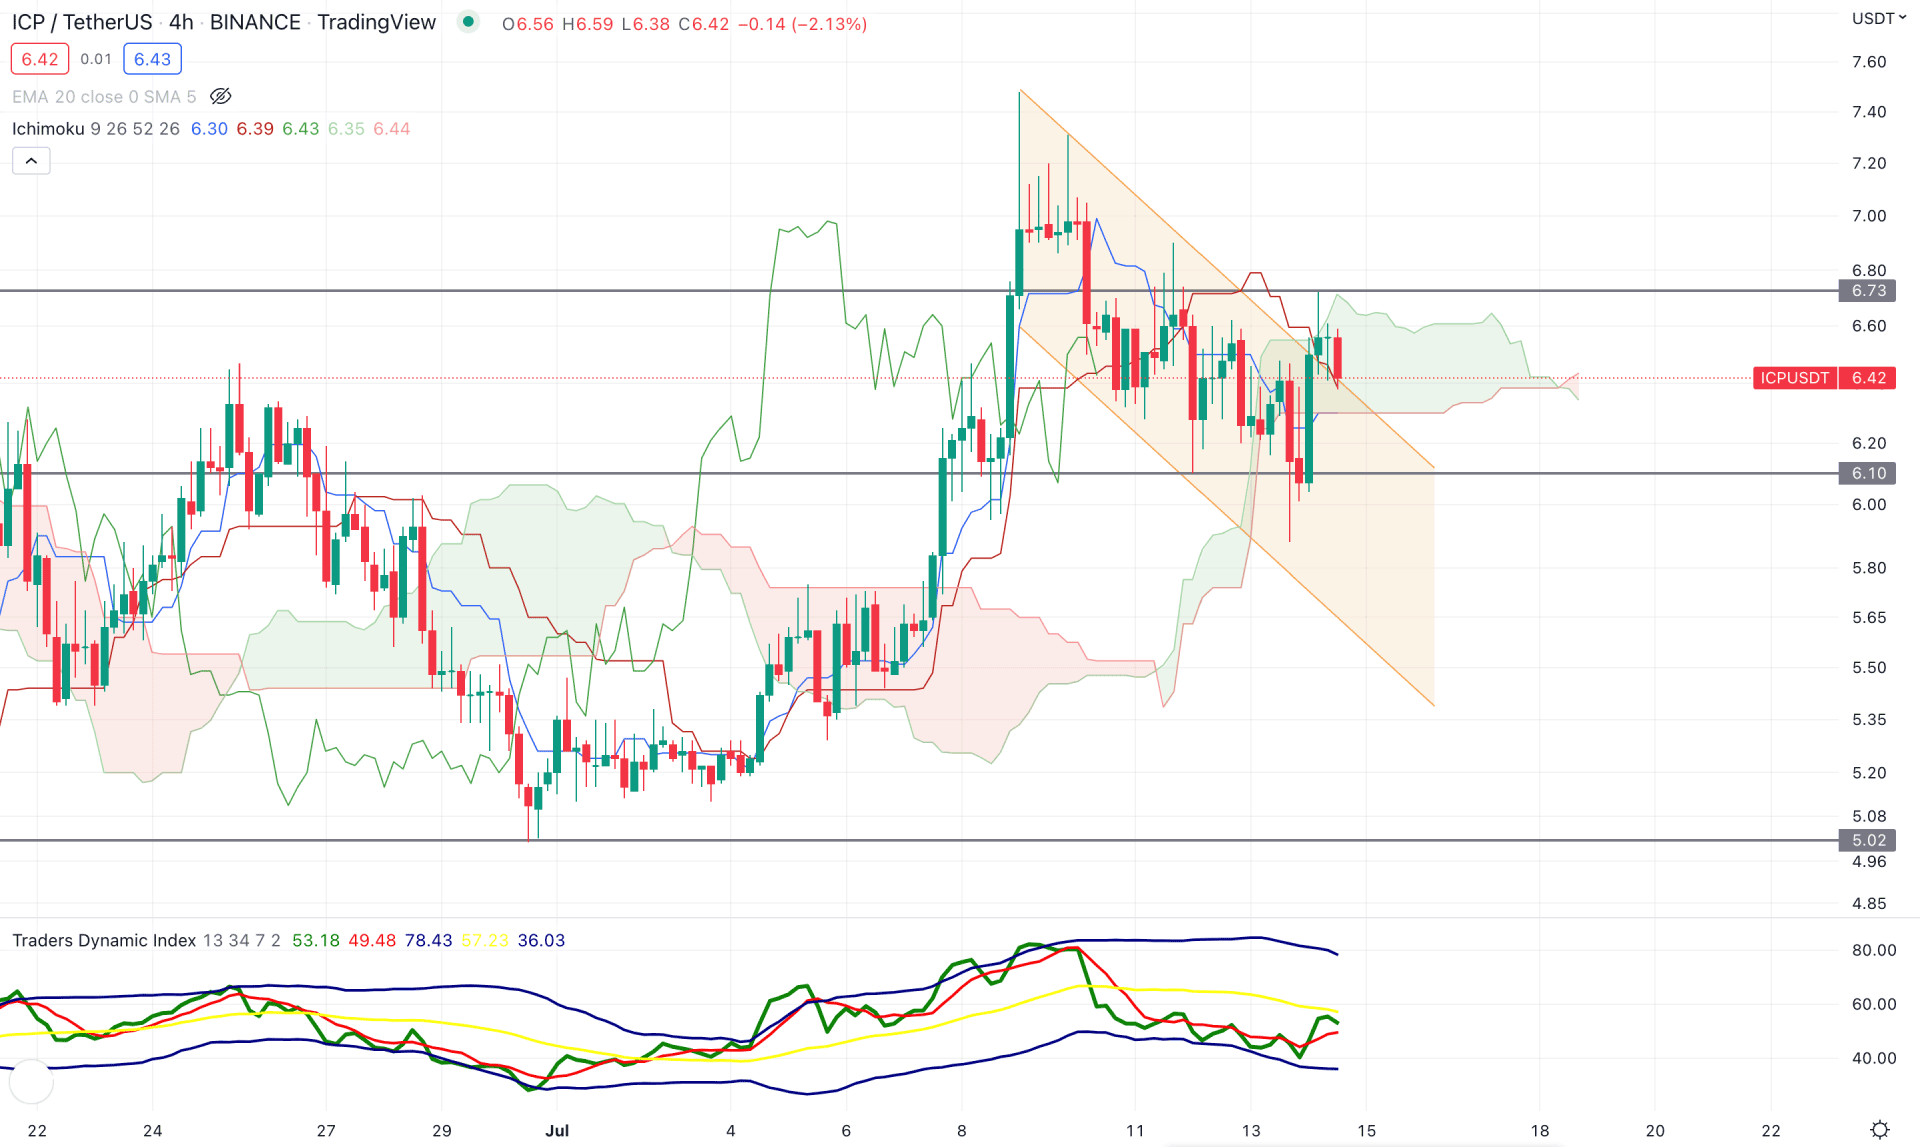
According to the Ichimoku Kinko Hyo, the intraday market momentum of ICPUSD is bullish from the H4 chart. The price trades within a descending channel where the current price is within the Kumo Cloud. On the other hand, the Senkou Span A and Senkou Span B showed a crossover in the future cloud, indicating a possible trend change. However, the current price action at the dynamic Kijun Sen area showed that the price needs more pressure on the upside to form a new bullish trend in the coming days.
The indicator window showed the traders' dynamic Index, a unique tool to define bulls/bears' dominance in the market that showed how bears are struggling to drag the price down. The current TDI line has been below the 50 neutral level for a considerable time, but there is no sign of strong selling pressure. On the other hand, the dynamic Kijun Sen is still below the price working as an immediate support level.
Based on the daily structure, a bullish H4 candle above the dynamic Kijun Sen would be a buying signal in this pair, where the main aim is to test the 7.60 swing high in the coming days. On the other hand, the break below the 6.00 level with a bearish H4 close would alter the current market structure and lower the price towards the 5.20 level.
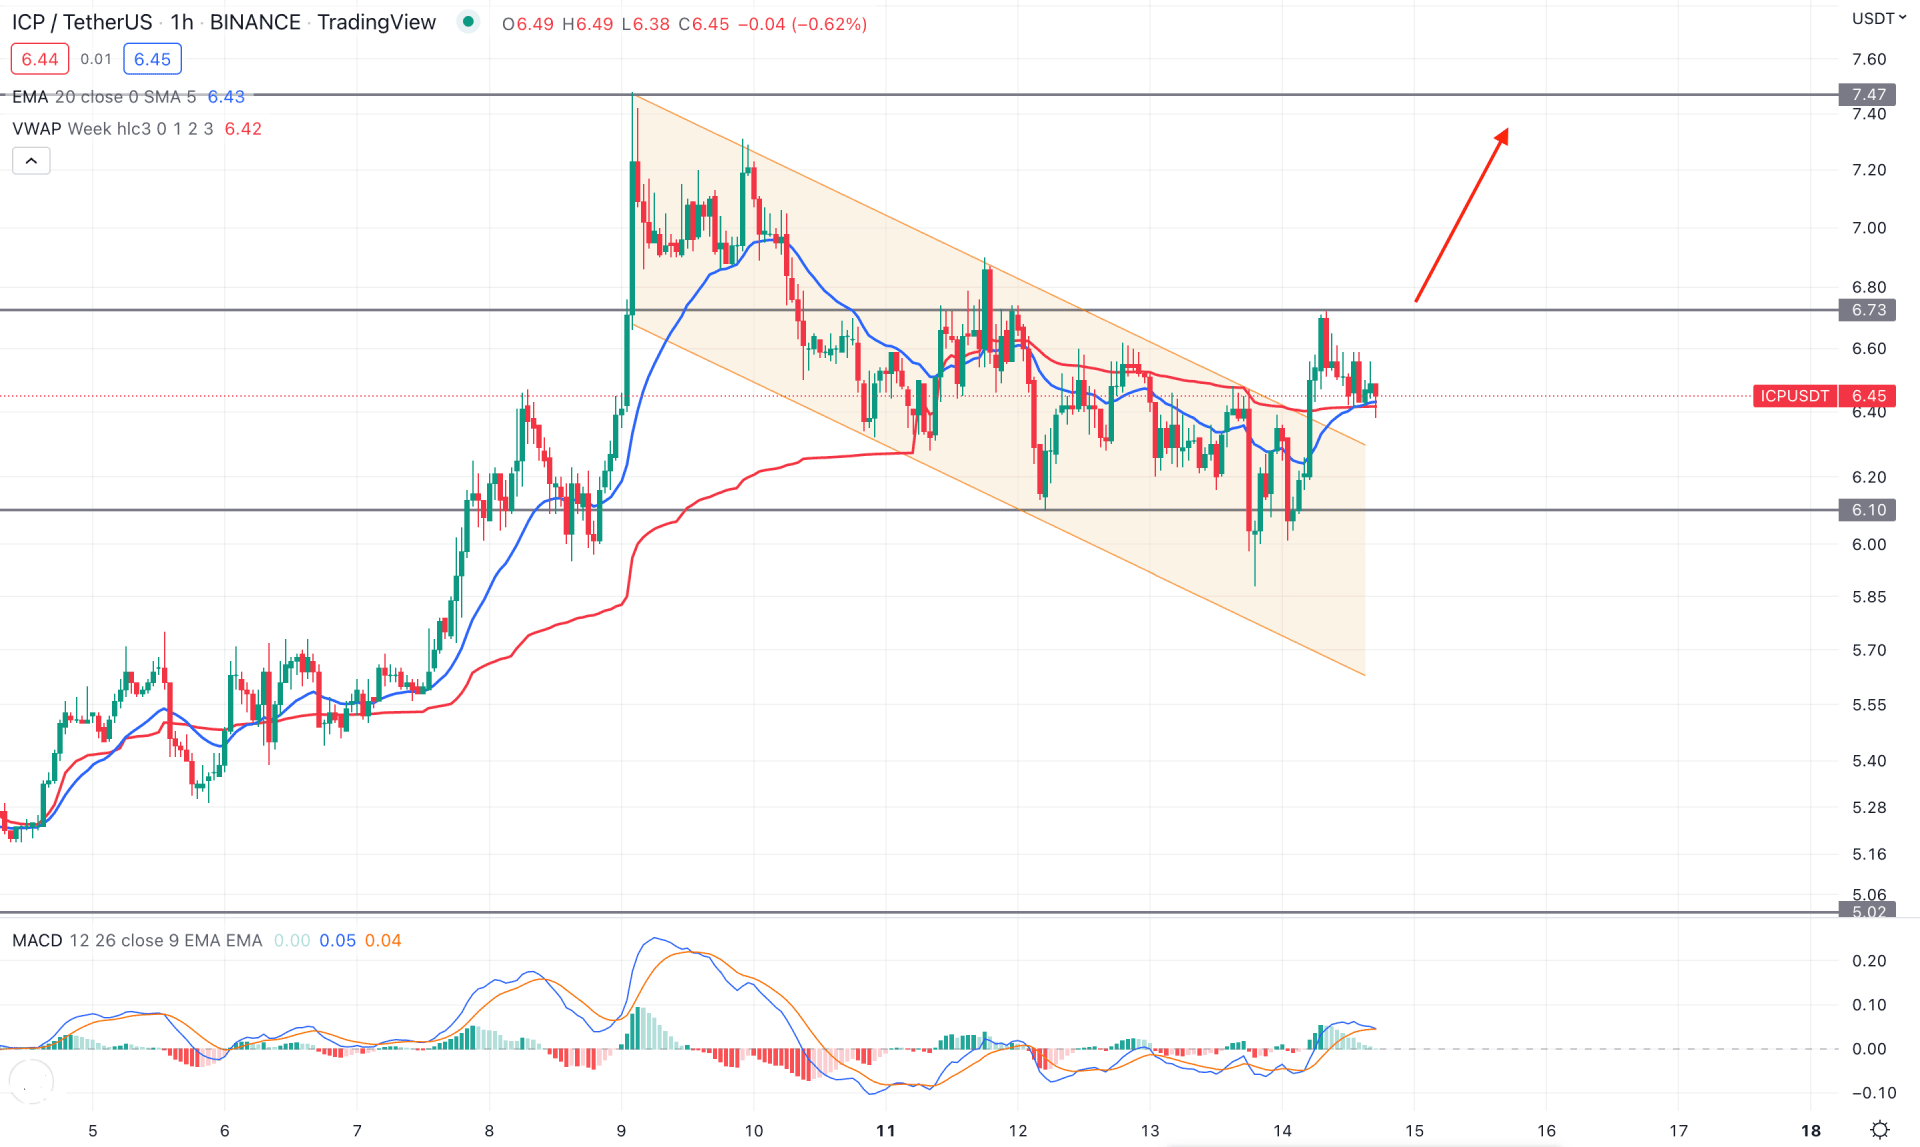
The price in the ICP/USDT intraday chart shows extreme bullish pressure from the descending channel breakout, backed by a strong bullish trend. Moreover, the dynamic weekly VWAP and dynamic 20 EMA are working as dynamic support to push the price up.
The indicator window shows a MACD histogram that reaches the neutral zone, indicating that bear's momentum is decreasing. Therefore, the H1 chart trading approach is to wait for an additional bullish pressure with an H1 close above the 6.73 level, increasing the buying pressure towards the 7.47 level. On the other hand, the break below the 6.10 level would alter the current market structure and lower the price in the coming hours.
Based on the current multi-timeframe analysis, the ICP/USDT might provide another push-up towards the 9.80 key resistance level in the coming days. In that case, any bullish candle on the intraday chart above the H4 Kijun Sen would be a solid buying opportunity.


