Published: September 25th, 2024
A decentralized protocol called The Graph is intended to make statistics indexing and accessing from publicly accessible blockchains more effective. Subgraphs are among the protocol's useful components. Third-party developers build subgraphs to retrieve and index information stored on particular blockchains.
Within the Graph ecosystem, The Graph (GRT) is a service token. The Graph Foundation gives GRT grants to program developers and subgraph artists. In addition to safeguarding the network, GRT users can assign their allocated tokens to curators or researchers in exchange for a portion of the bonuses for indexing or curation.
The Graph is becoming increasingly well-known for providing affordable and competitive means of obtaining decentralized data. It stands out for dependability, with a 99.99% uptime and 24/7 availability. Subgraphs, the APIs that assist in organizing and presenting blockchain information to programmers and users, are the foundation of The Graph's structure. The network supports over 70,000 projects, has over 100 indexer nodes, and deals with 1.23 trillion queries. The GRT token is essential for motivating users to arrange and supply data efficiently.
GRT's price has recently demonstrated significant positive momentum, increasing by 7.28% in trading in a single day to hit $71.26 million. Also, almost 60% of the circulating supply is held by Whales, creating an opportunity to move with volumes.
Let's see the further aspect of this coin from the GRT/USDT technical analysis:

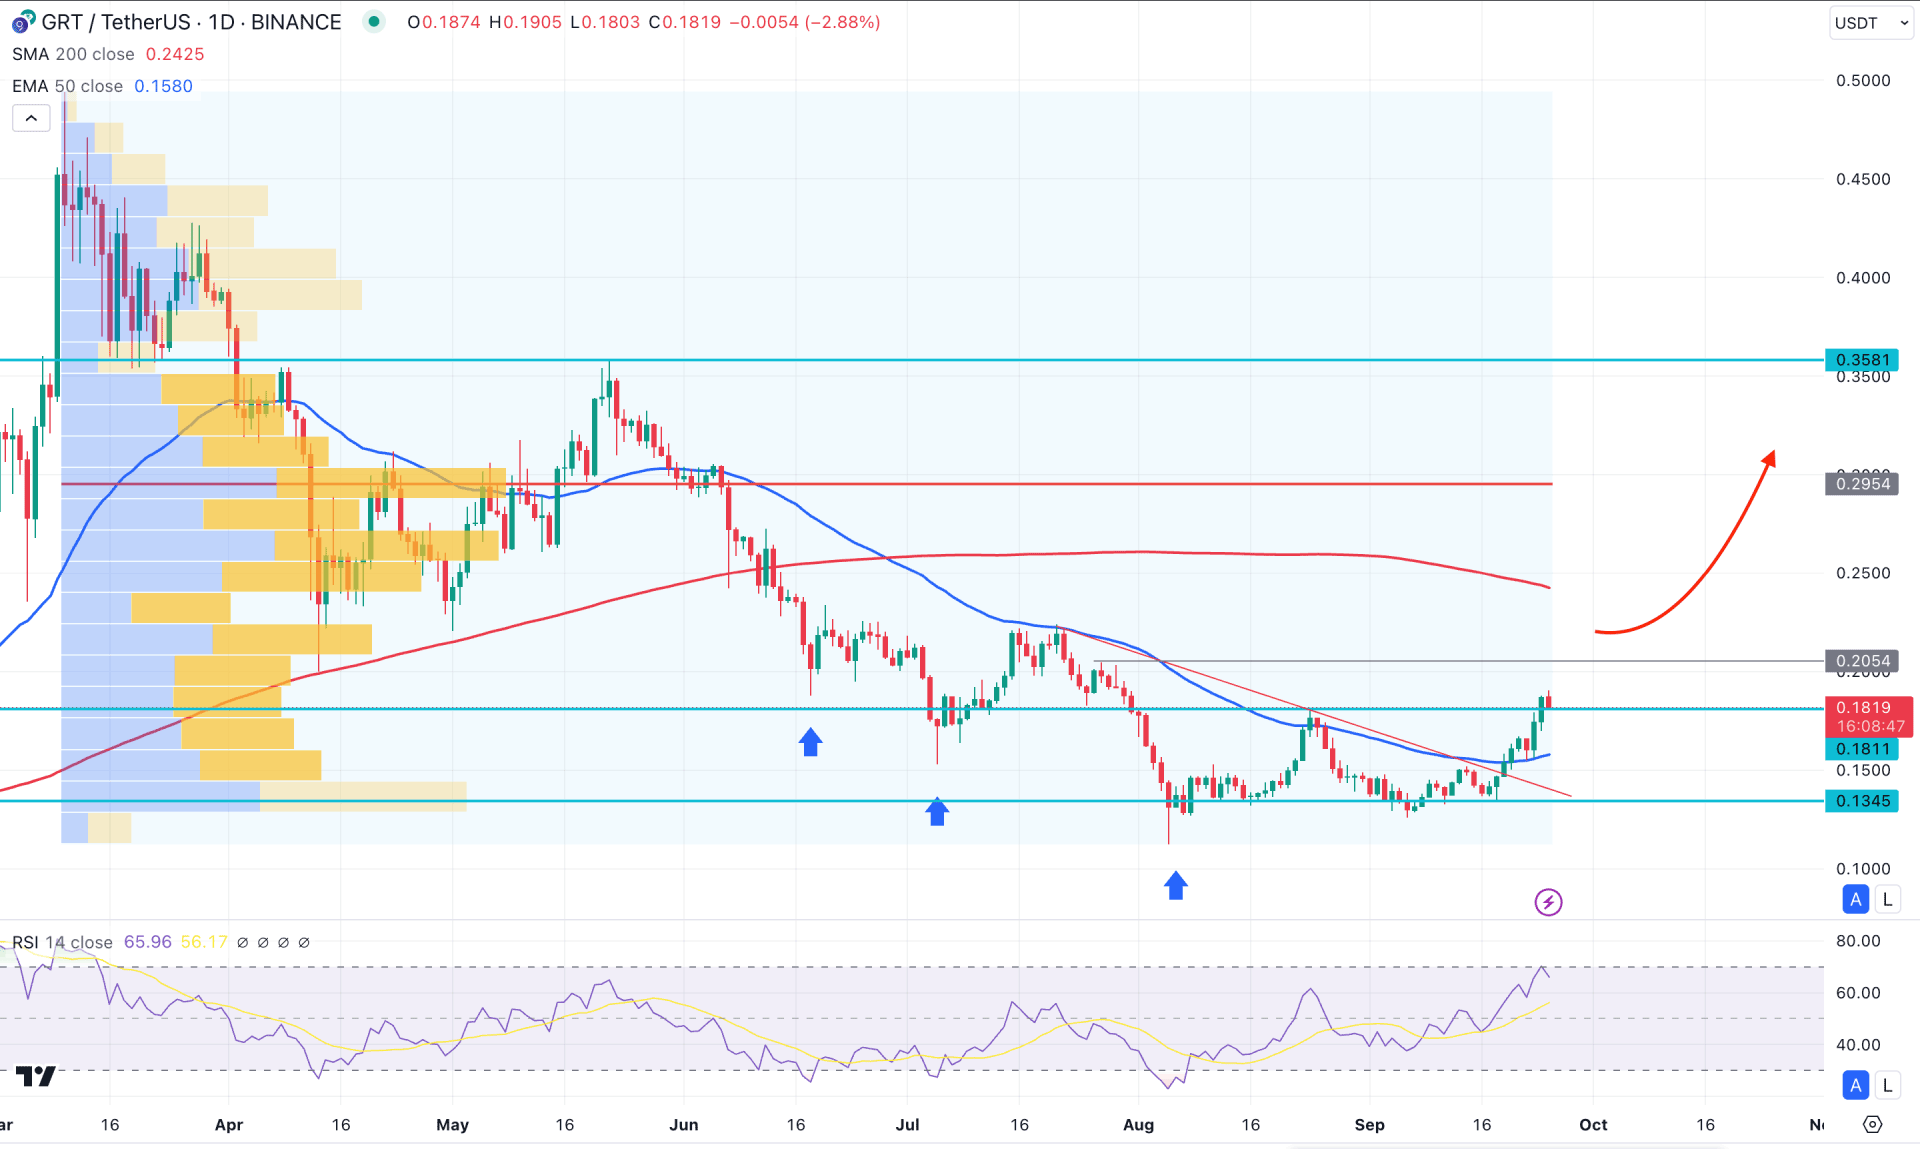
In the daily chart of GRT/USDT, a prolonged consolidation is seen in the recent price, suggesting a potential bullish continuation. Also, a valid bottom is yet to form as the current price aimed higher from crucial trendline resistance.
In the higher timeframe, it's been three consecutive bearish months until the August 2024 close. However, September has become a blessing as the current price hovers at the August high. In that case, investors should closely monitor how the price reacts to this crucial resistance as a valid breakout could initiate a trend change.
Despite the bullish possibility from the higher timeframe's price action, the volume structure looks different. Looking at the Fixed Range High Volume Level indicator, the highest activity level since March 2024 is at 0.2954 level, which is way above the current price. It is a primary sign that long-term trades are still on the selling side and yet to offload positions from the bottom.
In the primary chart, the recent price aimed higher above the 50-day Exponential Moving Average, suggesting a primary long signal. However, the 200-day Simple Moving Average is still above the current price, which is a major barrier to bulls.
Based on the daily market outlook of GRTUSD, the Spring phase of the Wyckoff Accumulation is over, which signals a potential bullish trend reversal. In that case, investors might expect the buying pressure to extend above the 0.3500 psychological line.
On the bearish side, the 0.1345 level would be a crucial bottom to look at as a break below this line might lower the price towards the 0.1000 area.

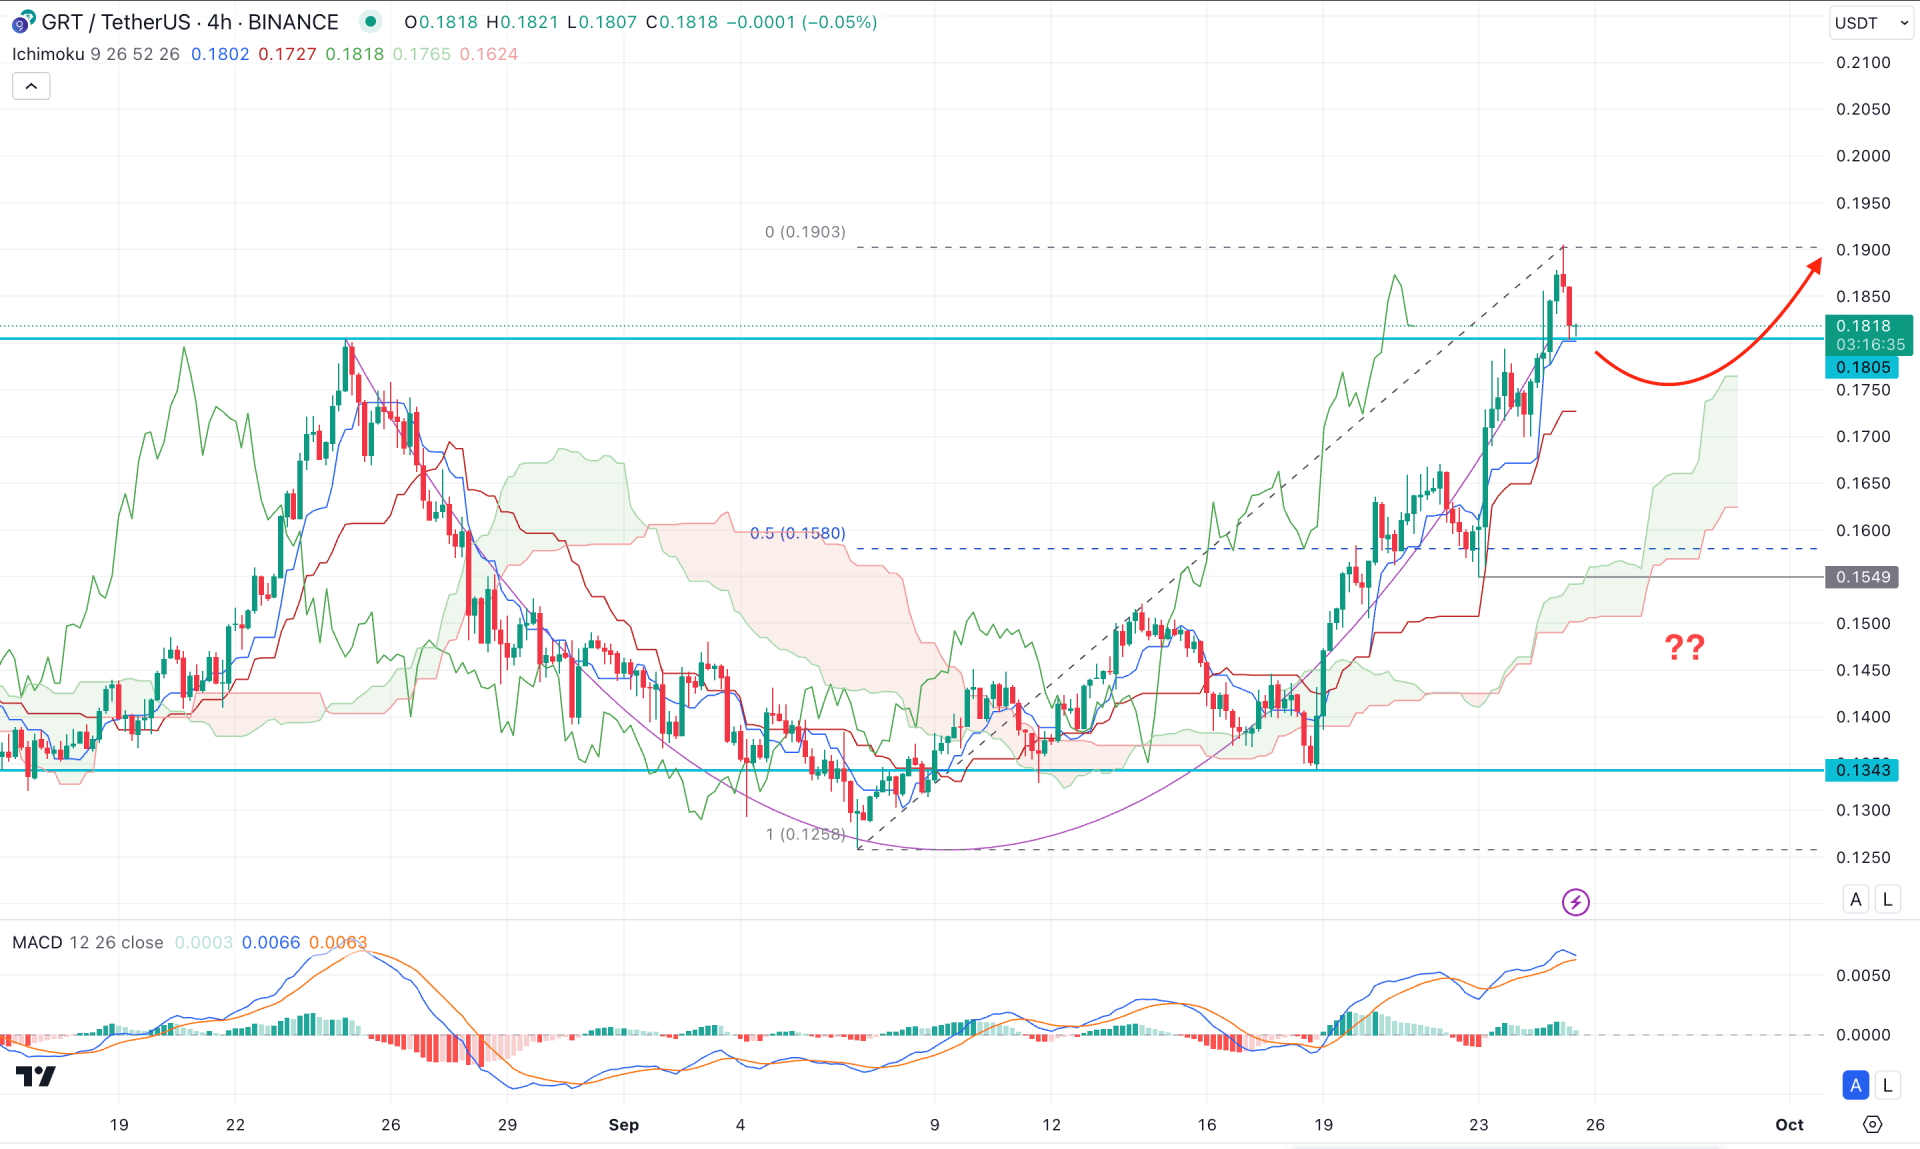
In the H4 timeframe, GRT/USDT is trading above the 0.1805 high, followed by a bullish U-shape recovery. Moreover, the ongoing buying pressure is present above the cloud zone, signaling a bullish continuation. The Future Cloud has shifted the position also, suggesting a confluence bullish factor.
In the secondary window, the MACD Histogram remained corrective at the neutral point, while the Signal Line reached the highest level since 28 August. It is a sign that a sufficient downside correction is pending, leading to a profit taking.
Based on the H4 outlook, the price might initiate a downside correction, but any bullish reversal from the 0.1650 to 0.1500 area could resume the existing trend towards the 0.2100 level.
Alternatively, a bearish break below the cloud low with an impulsive pressure might create a challenge for bulls, lowering the price below the 0.1300 level.

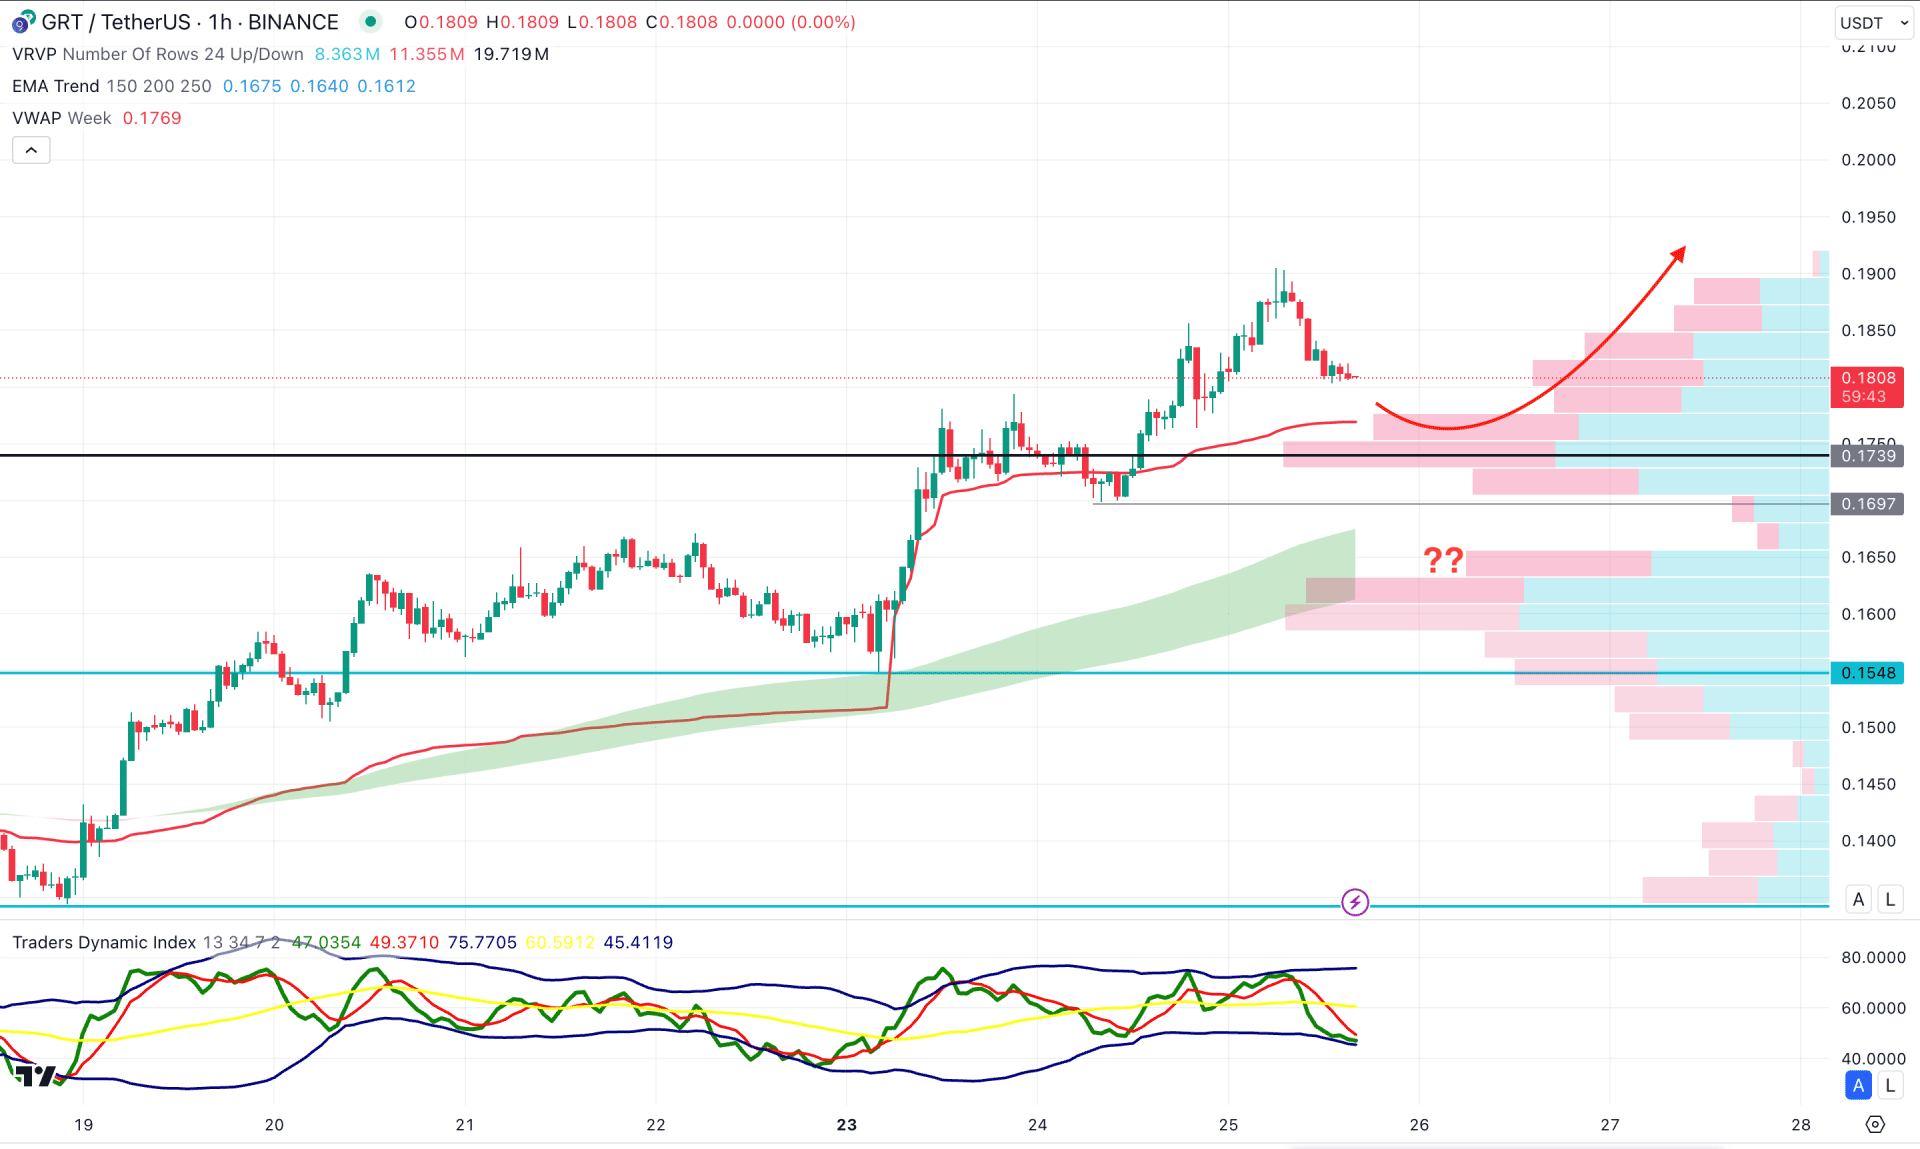
In the hourly chart, the ongoing buying pressure is valid as the current price hovers above the static visible range high volume line. Moreover, the MA wave consists of 150 to 250 Moving Average remains below the high volume line with a bullish slope.
Based on this outlook, investors might expect a bullish continuation as long as the high volume line remains below the current price. The ongoing intraday buying pressure might extend the momentum and find resistance from the 0.2000 psychological line.
On the bearish side, a deeper discount is possible towards the 0.1548 level, which might need a break below the VWAP line.
Based on the current market structure of GRT/USDT, the recent breakout from the Wyckoff Accumulation could initiate a trend change, opening a long opportunity. Investors should closely monitor how the price trades above the current trendline support as a solid base is needed before aiming a long wave.