
Published: September 29th, 2020
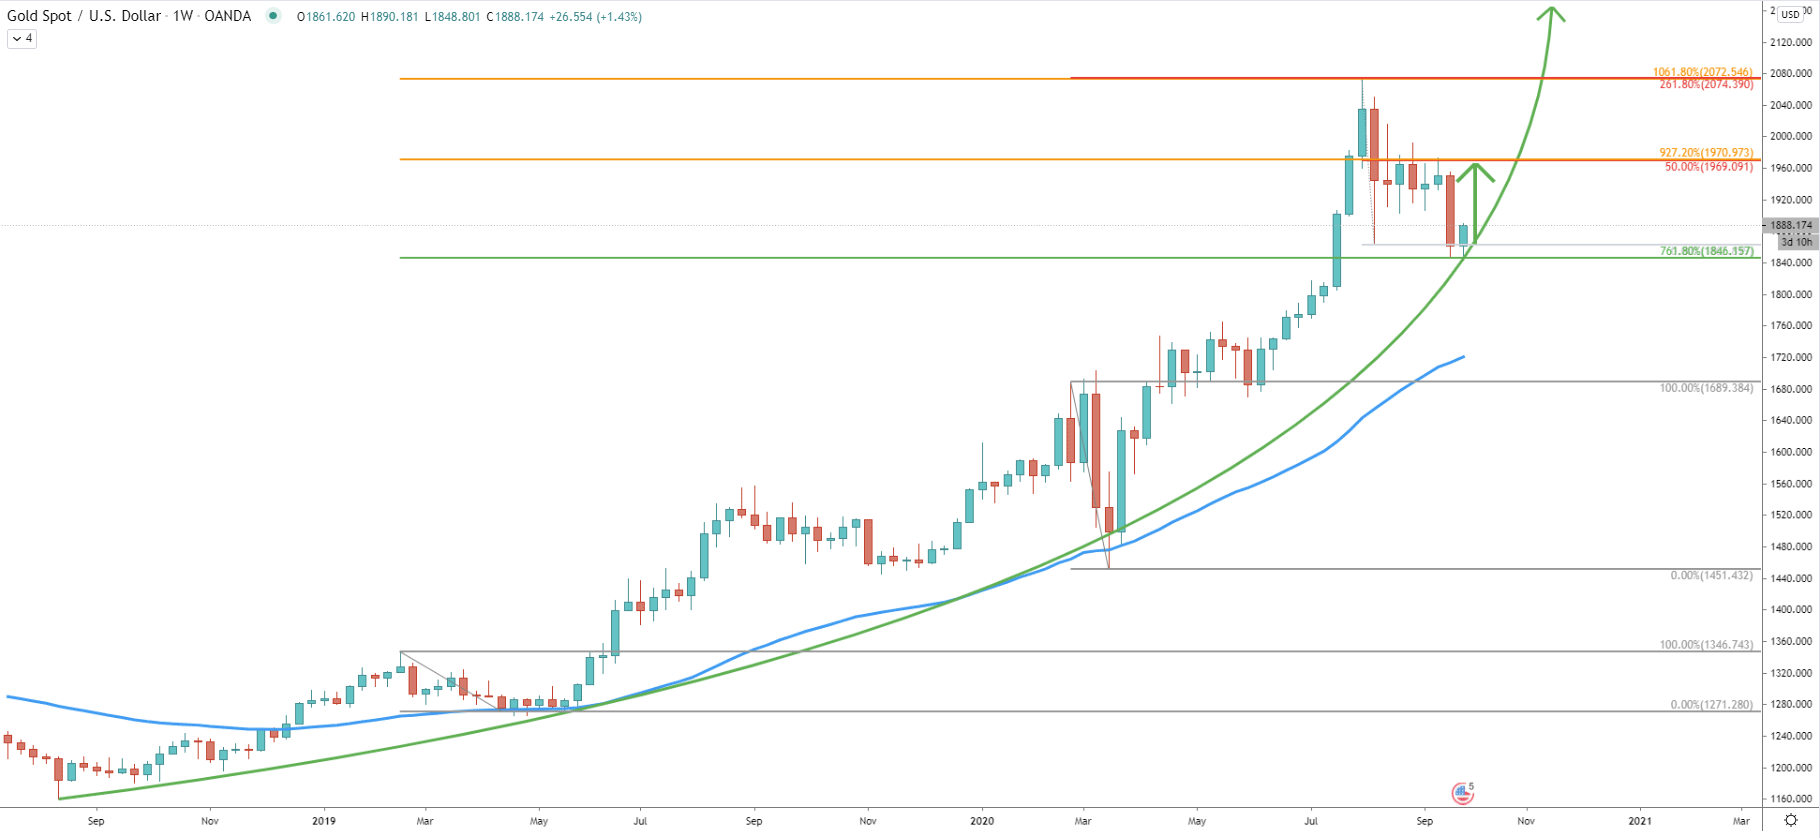
The weekly chart shows XAU/USD parabolic growth in the past few years. XAU/USD has been going through substantial gains but found the top at 2074 back in August this year. The correction down followed and the price has corrected down to 1846, where it cleanly rejected the 761.8% Fibonacci retracement level, applied to the initial bounce off the 50 Exponential Moving Average.
This Fibonacci indicator provided important support and also two important resistance levels. First is the 1061.8% retracement which is at 2074, where Gold topped out. The second is the 927.2% Fibs at 1970, which is the nearest resistance. Both of these levels also confirmed by other Fibonacci retracement indicators. The most important one is 1970, which corresponds to 927.2% and 50% Fibs.
Considering a very strong and valid uptrend, the probability is highly in favor that Gold price will continue to rise. Most probably at some point, there will be a new all-time high produced. But before that, XAU/USD must break above both resistance levels, 1970 and 2074.
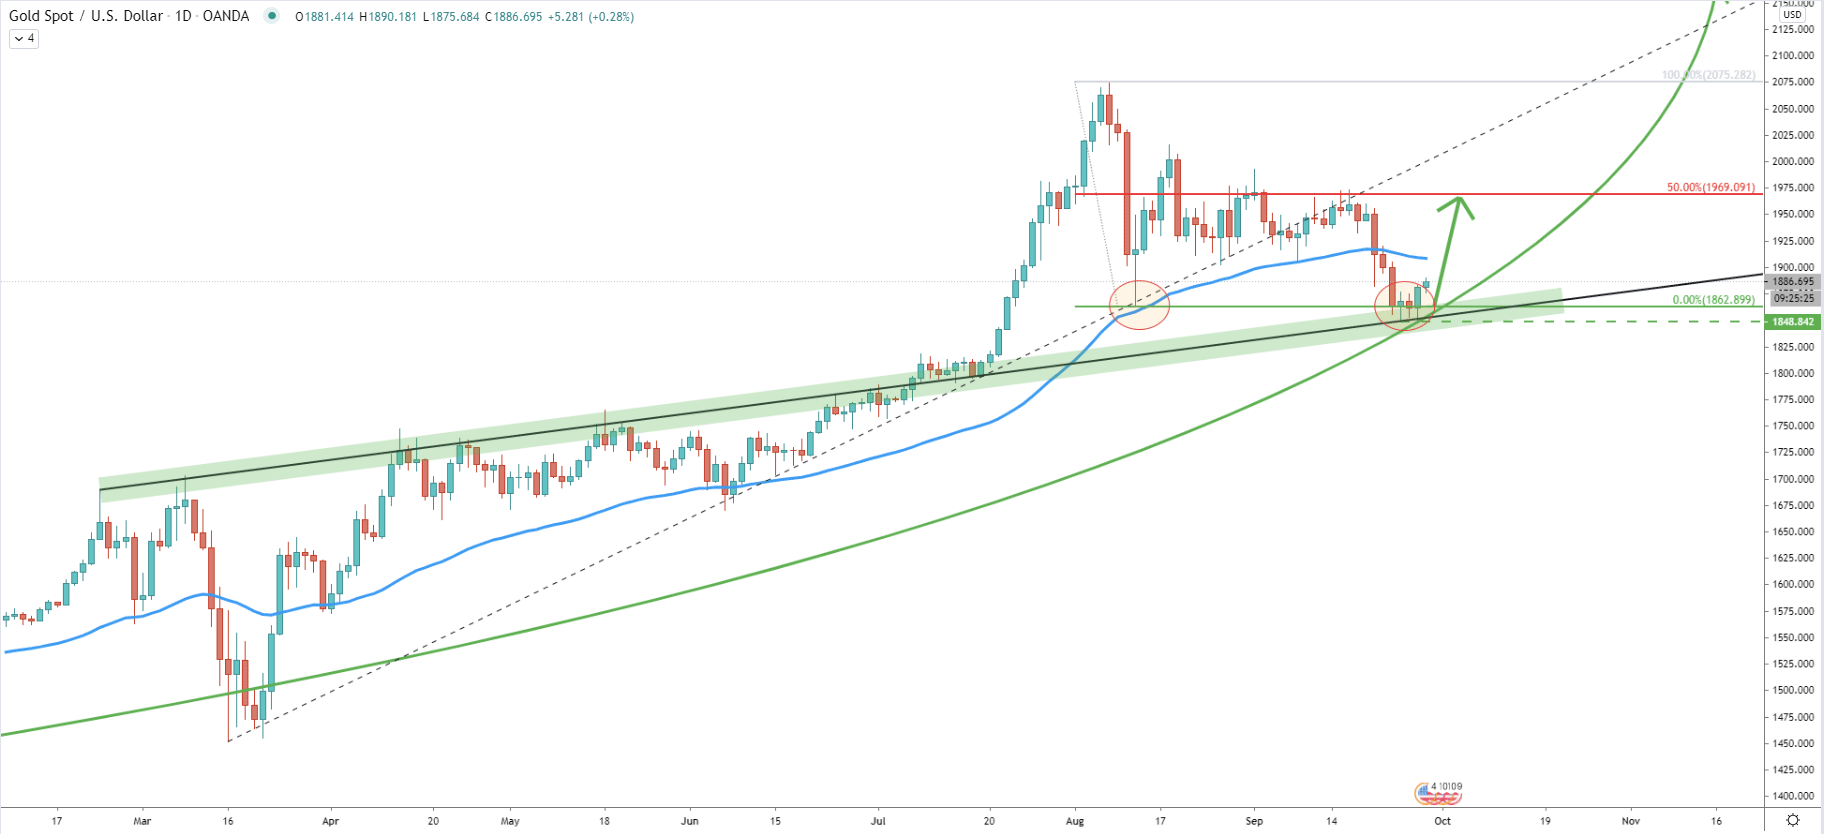
The most recent support area was formed at the end of the last and beginning of this week. It can be seen that during this period of time Gold has rejected the average-price uptrend trendline, suggesting the formation of the bottom. Besides, the simple uptrend trendline was rejected previously along with the 50 EMA at 1862. This support level still remains valid as there was no daily closing price below. Overall, the key support area is between 1848 and 1862, which could have been a very attractive area for buyers.
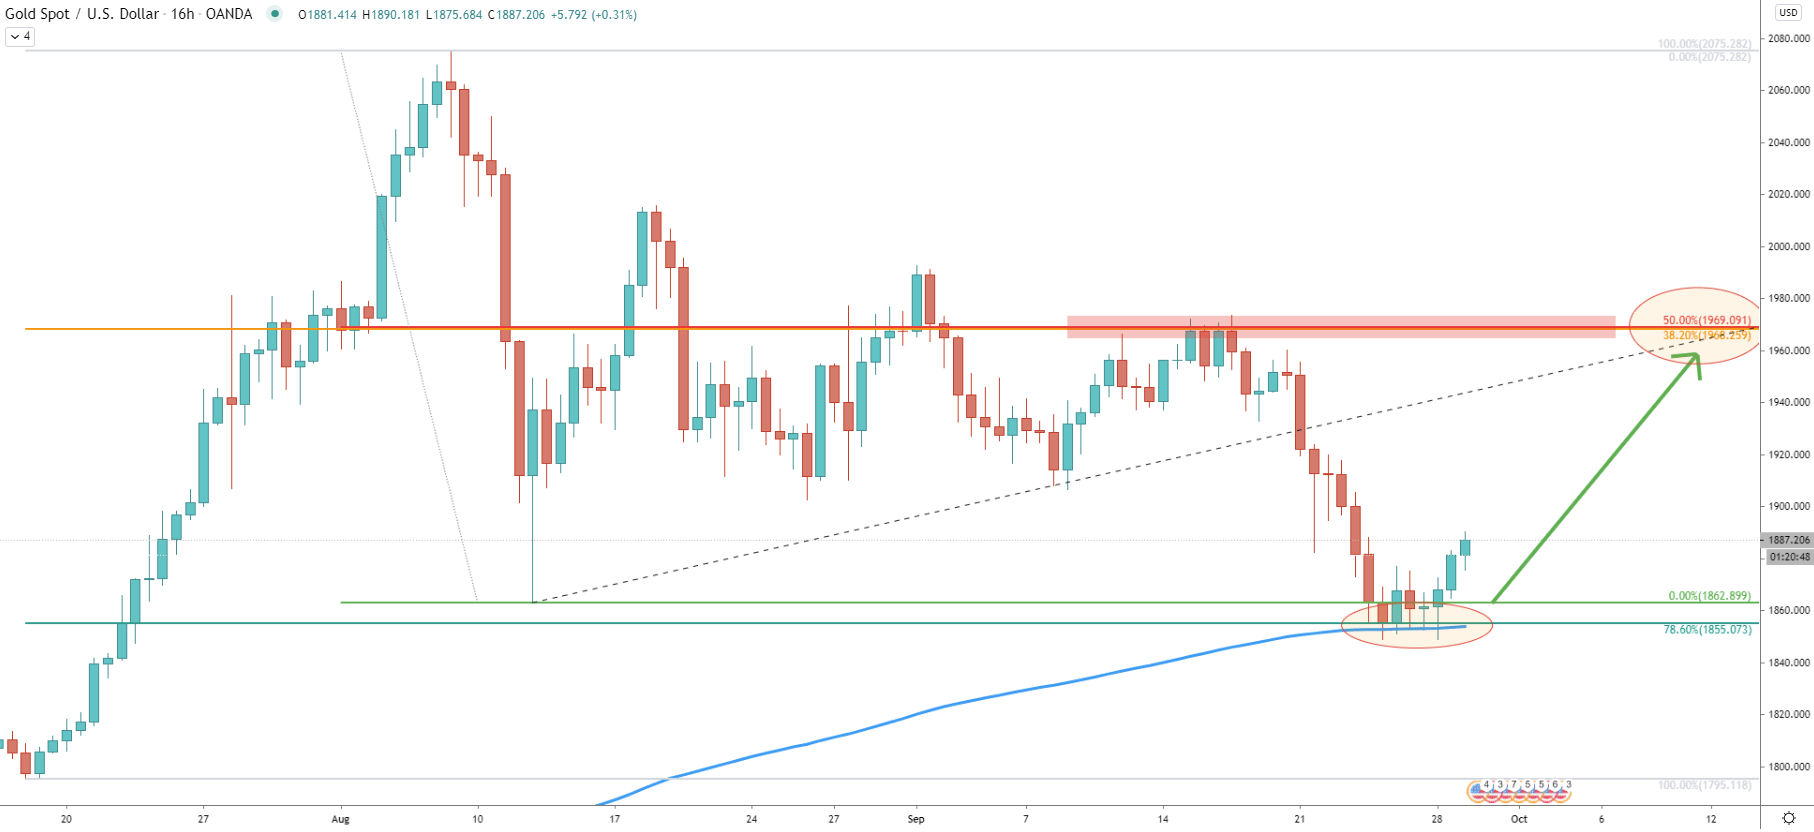
Along with the previously mentioned support area between 1848 and 1862, the 200 EMA was also rejected. Gold is certainly starting to look very bullish in the long run, but only as long as the daily close remains above 1848 low. The key resistance at 1970 now corresponds to two Fibonacci retracement levels, 50% as per the daily chart and 38.2% Fibs applied to the last wave up, where XAU/USD topped out. This Fibs also shows that the 78.6% retracement level at 1855 has been rejected cleanly. Spikes were produced below, but yet no closing prices were printed lower.
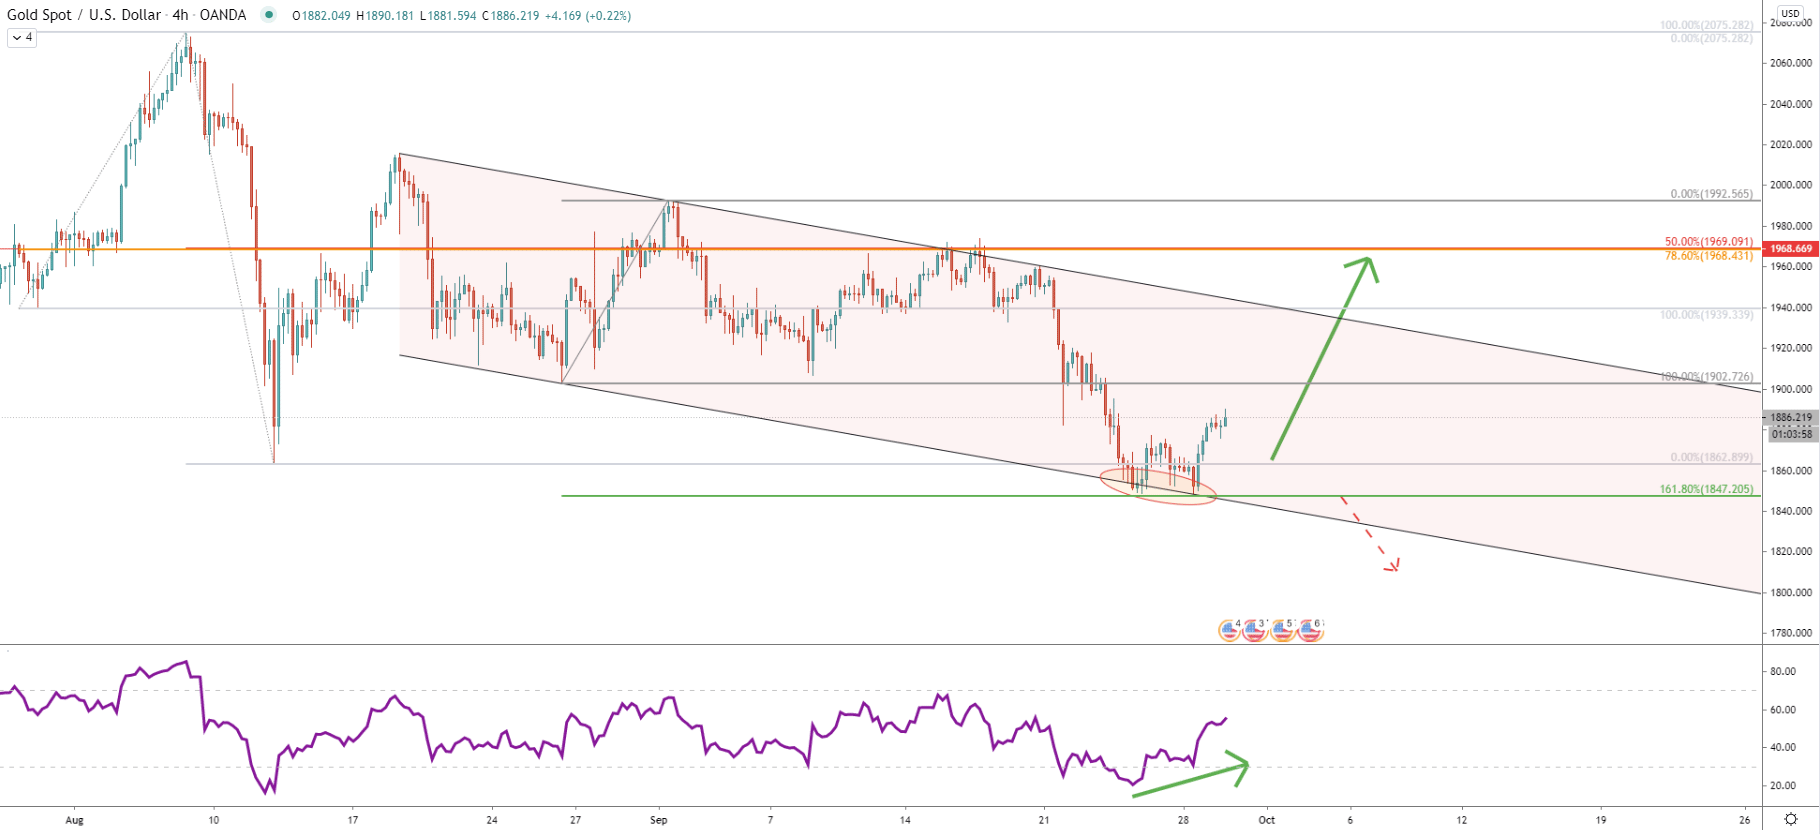
Gold has reached and rejected the bottom of the descending channel. At the same time price has produced a double bottom while the RSI oscillator formed a bullish divergence. And finally, XAU/USD has reached and cleanly rejected the 161.8% Fibonacci support applied to the previous corrective wave up. These are very bullish signals suggesting and confirming the domination of buyers. On this chart, there is a third upside resistance confirmation, which is the 78.6% Fibs applied to the very last upside swing before Gold tested 2075 high.
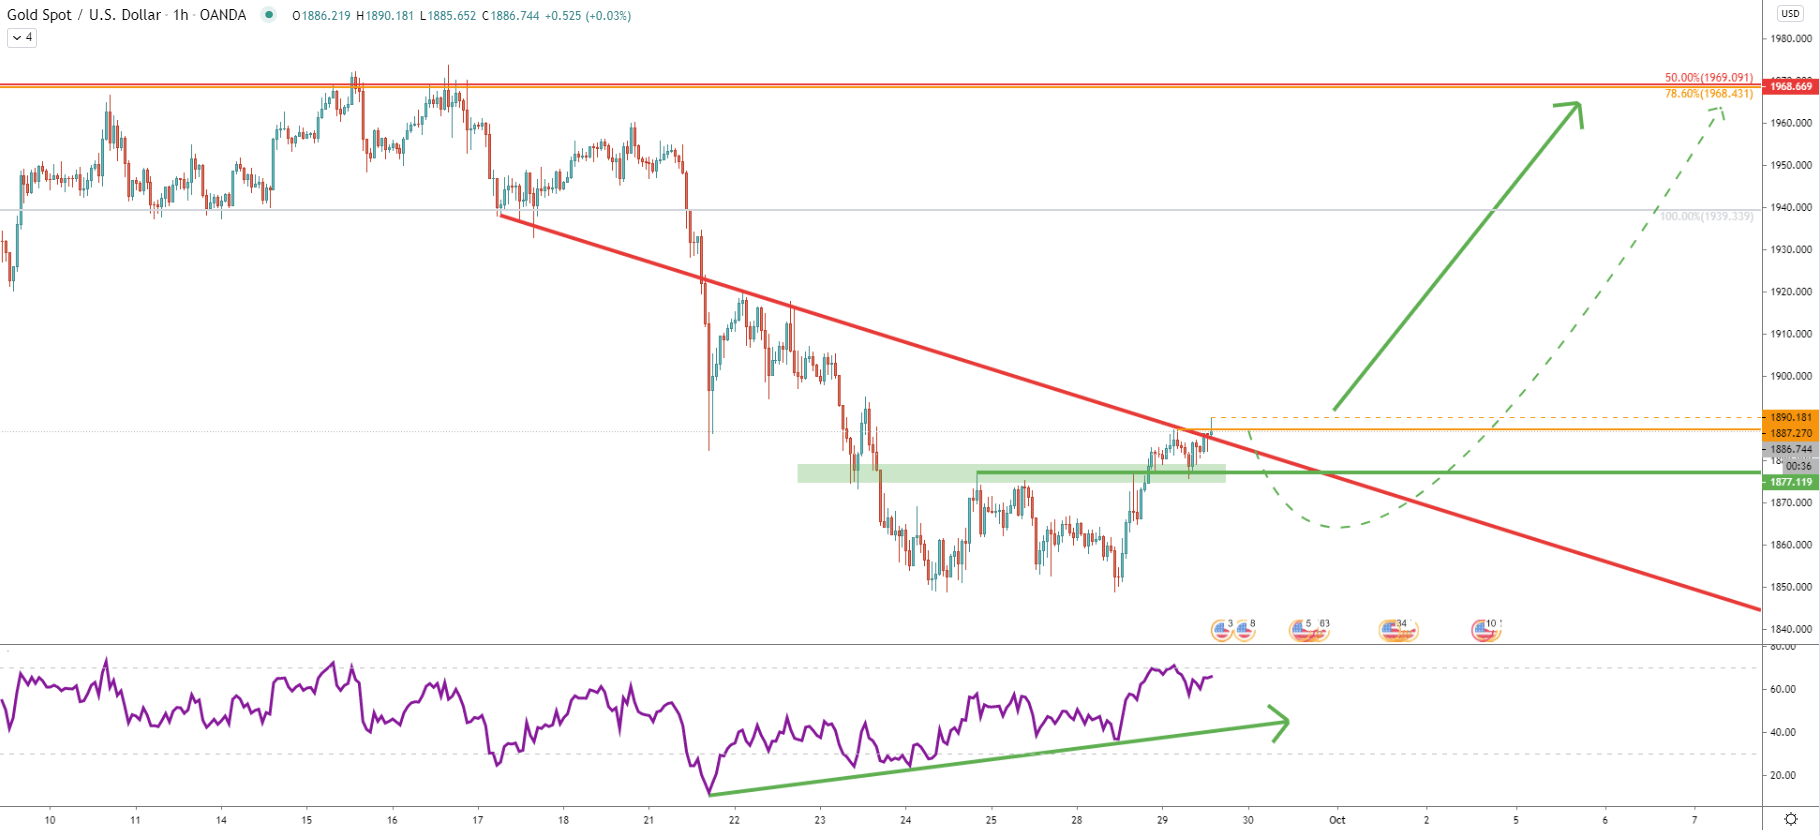
Right now Gold is facing a minor resistance, which is confirmed by the average-price downtrend trendline. Today this resistance has been rejected cleanly after which price has produced a spike above hitting 1890 high. Such price action might result in a small downside move before/if the price of Gold will start to move higher. Therefore, buyers could be waiting for the 1h and/or 4h candles to close above 1890 before taking any action.
The long term Gold trend is certainly very bullish. The current correctional move to the downside could provide a strong buying opportunity for speculators as well as investors. Nonetheless, XAU/USD must break and close above both resistance levels mentioned in this analysis in order to continue rising exponentially.
As per the weekly, daily, 16-hour, and 4-hour charts, the key resistance level, and the nearest upside target is located near 1970 and is confirmed by 4 different Fibonacci retracement levels.
As per the 4-hour chart, only daily and/or weekly break and close below 1848 support level, will invalidate the bullish forecast. In this scenario, the downtrend continuation might take place, but most probably it will only extend the consolidation phase.
Support: 1877, 1848
Resistance: 1890, 1970


