
Published: June 30th, 2020
The cryptocurrency market hasn’t been very active during the past months. The Bitcoin price is stuck and still struggles to break above the key psychological resistance at $10,000. But while most coins were suffering or producing small gains, the ChainLink was one of those coins that consistently moved up over the course of the past few years. Perhaps it was one of the biggest gainers during the long run, at least in relation to Bitcoin. But will this super trend ever end? Let’s try to understand the game of probabilities for the LINK/BTC.
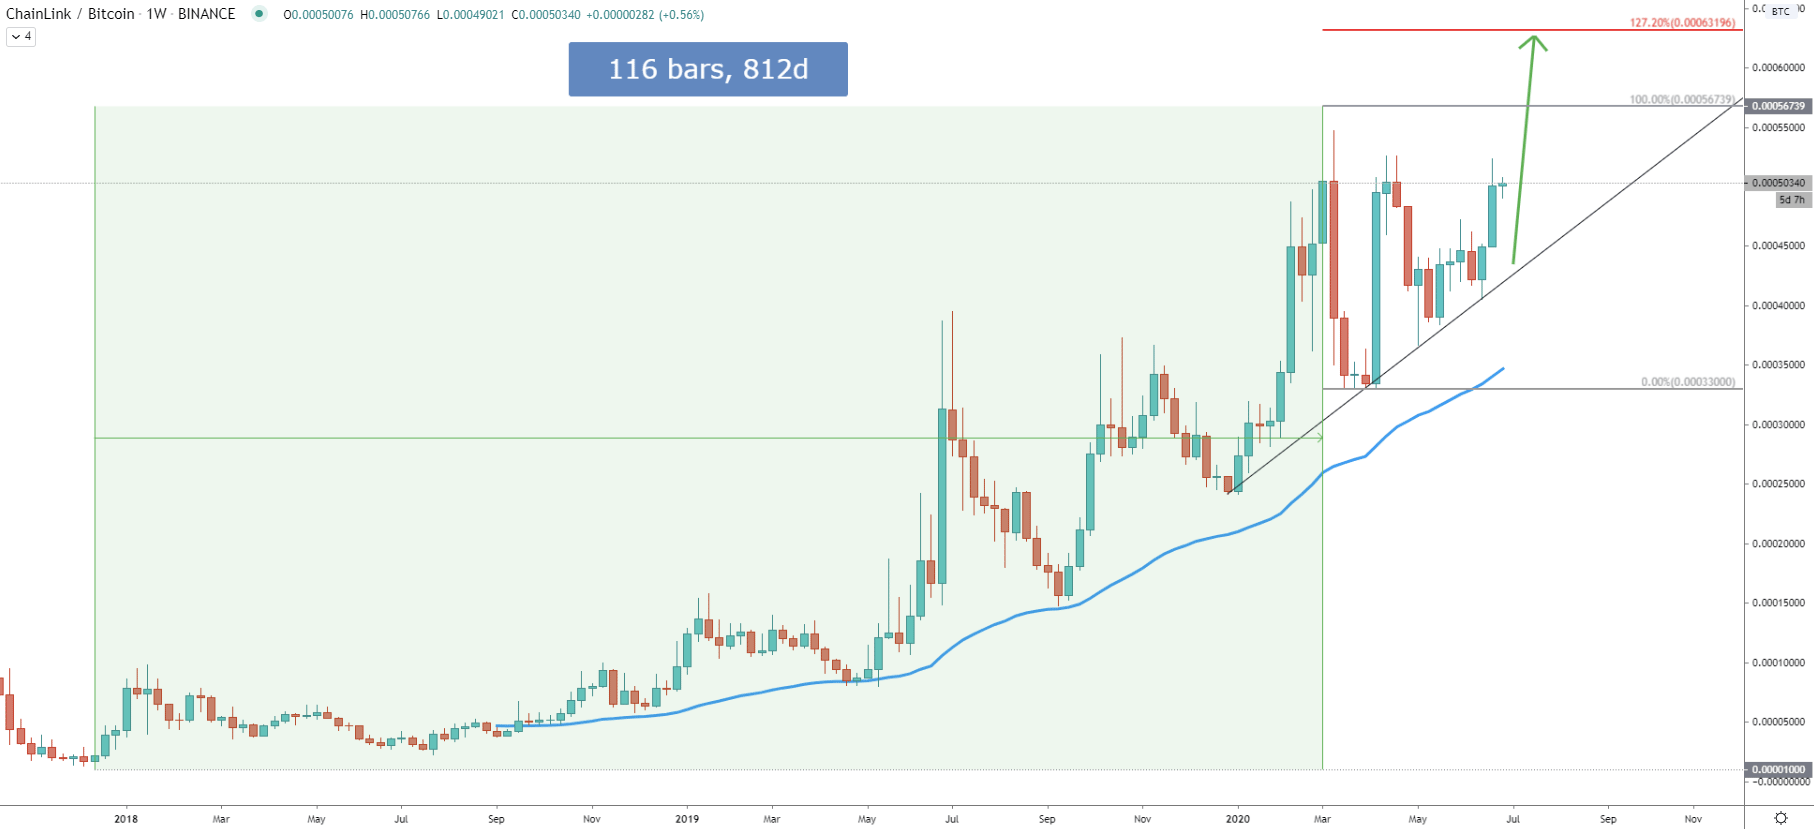
On the Weekly chart, we can witness the amazing growth of the LINK/BTC which has started back at the beginning of 2018. In 812 days the price has increased by a huge 5573%. ChainLink moved from the 1000 satoshis up to 56,739 satoshis high, which was tested on the March 02. Since then price hasn’t been able to produce a new higher high, but perhaps it is getting ready for such a move.
The uptrend trendline has been rejected cleanly for two consecutive times and price remains above the 50 Exponential Moving Average, suggesting the validity of the uptrend. The nearest resistance is seen at 127.2% Fibonacci retracement level, applied to the last corrective wave down. It is located at 63,196 satoshis, providing a potential 25% gain from the current price if uptrend continues.
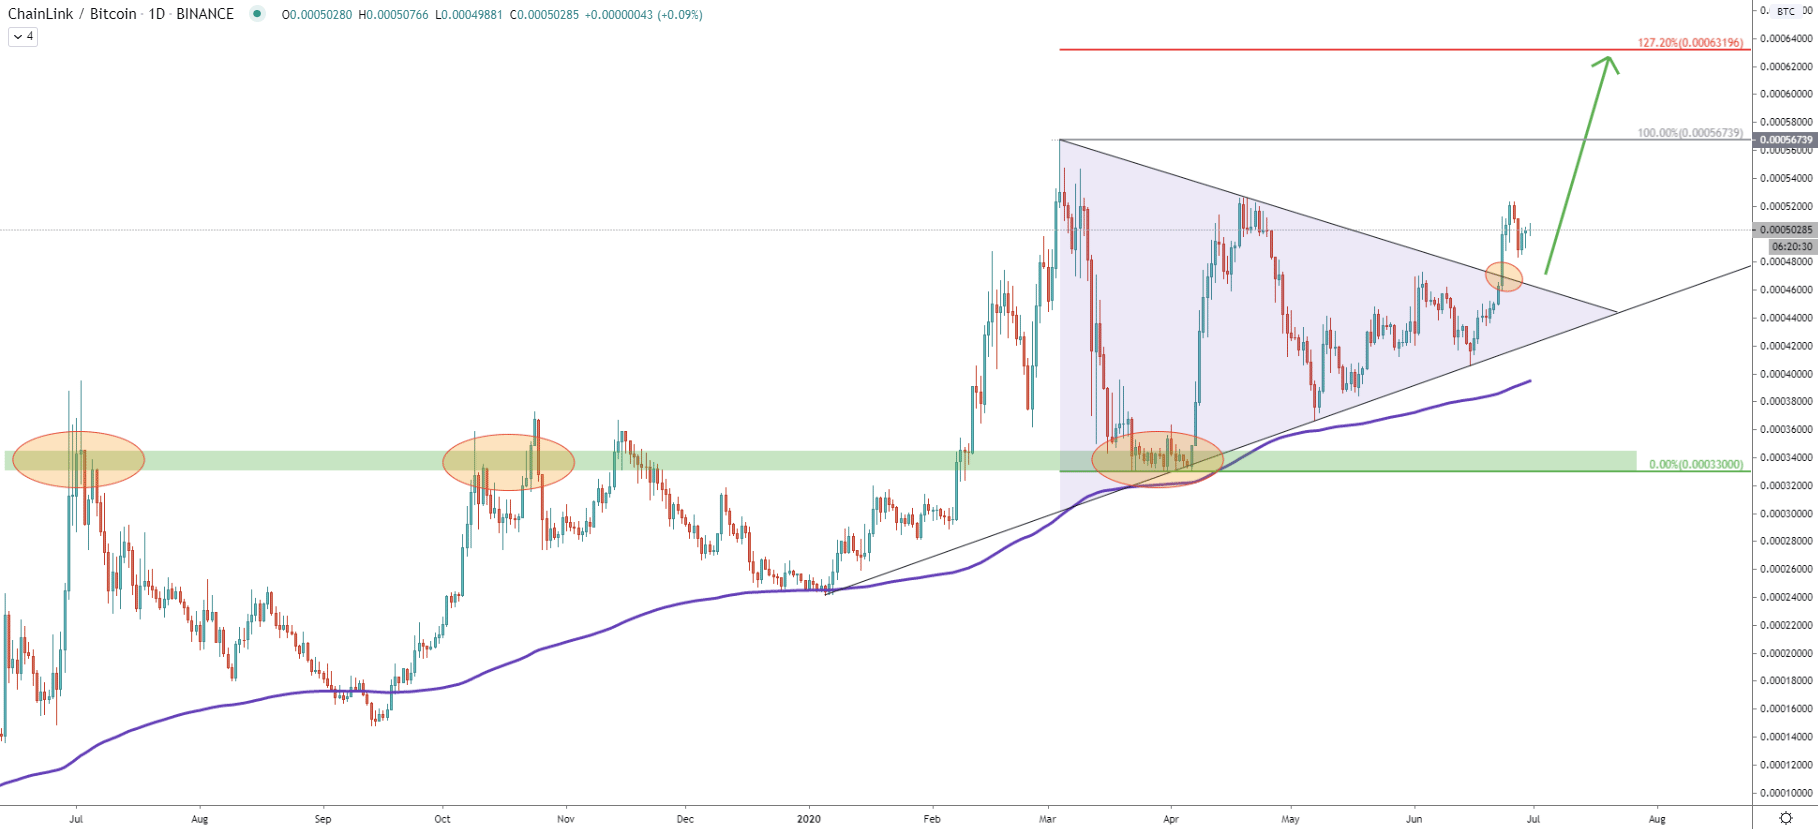
On the daily chart, the price has formed a massive resistance at 33,000 satoshis. This is an extremely strong psychological support, which previously was acting as the resistance. During past 3 months, LINK/BTC has formed a triangle pattern that was broken on June 23 under a heavy trading volume. Maybe this was a long wanted confirmation for bulls because such price action is exactly what is needed for a strong rally.
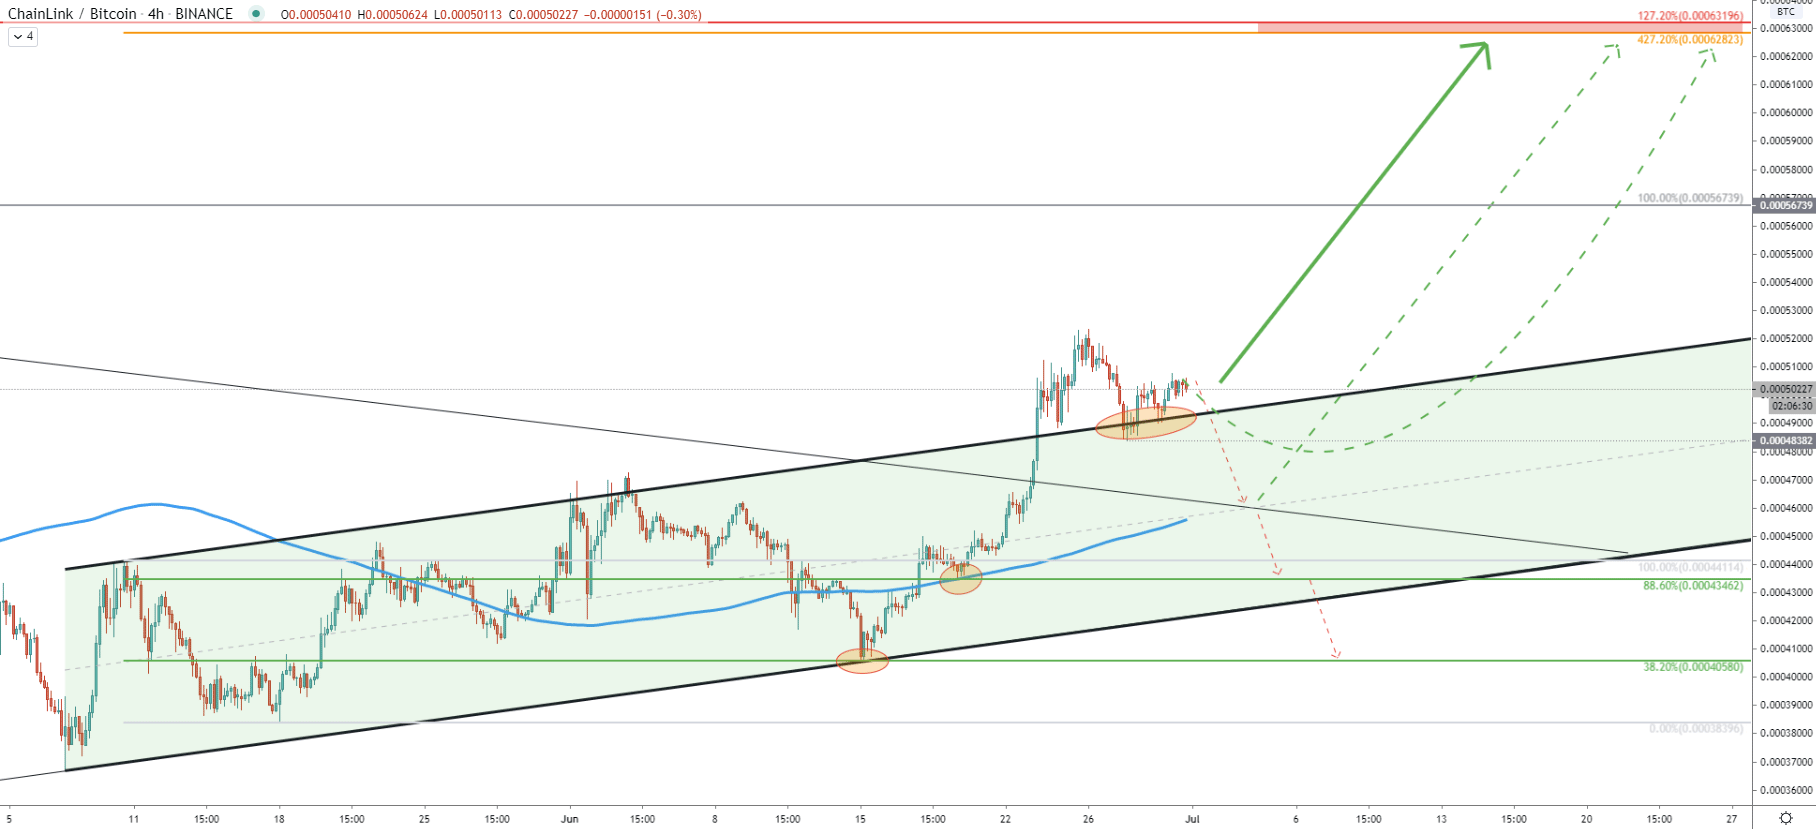
The 4-hour chart shows that LINK/BTC remained within the ascending channel during the 46-days period. The channel was broken simultaneously with the triangle pattern, and on the pullback, after the breakout, price found the support at the upper trendline of the channel.
As long as price remains above the recent low printed at 48,382 Satoshis, LINK can be expected to continue moving up. But 4h close below this level will certainly increase the risk of a further downside correction.
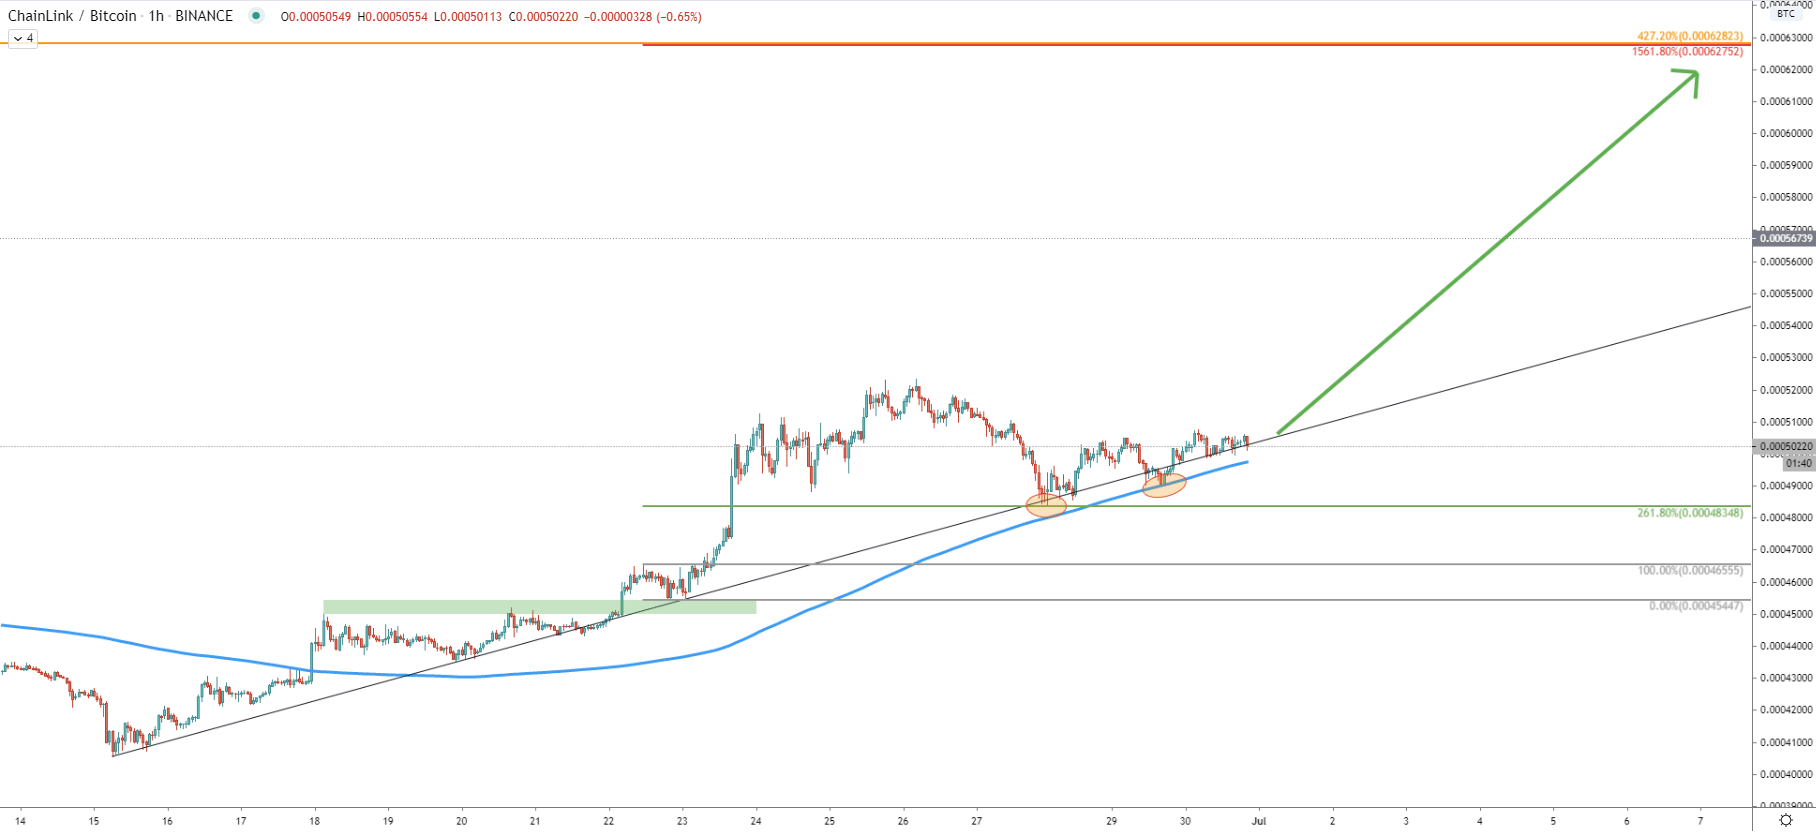
On the hourly chart price clearly respecting the uptrend trendline, and slowly but steadily moving up. We have applied the Fibonacci retracement indicator to the corrective wave down after breaking the previous resistance area near 45,000 Satoshis. The 261.8% Fibs was rejected cleanly followed by a rejection of the 200 Exponential Moving Average. Yet again this could be a confirmation that bulls are dominating and as long as price remains above 48,348 LINK/BTC will move higher. At the same time, the upside target on this chart also corresponds to the 1561.8% Fibs.
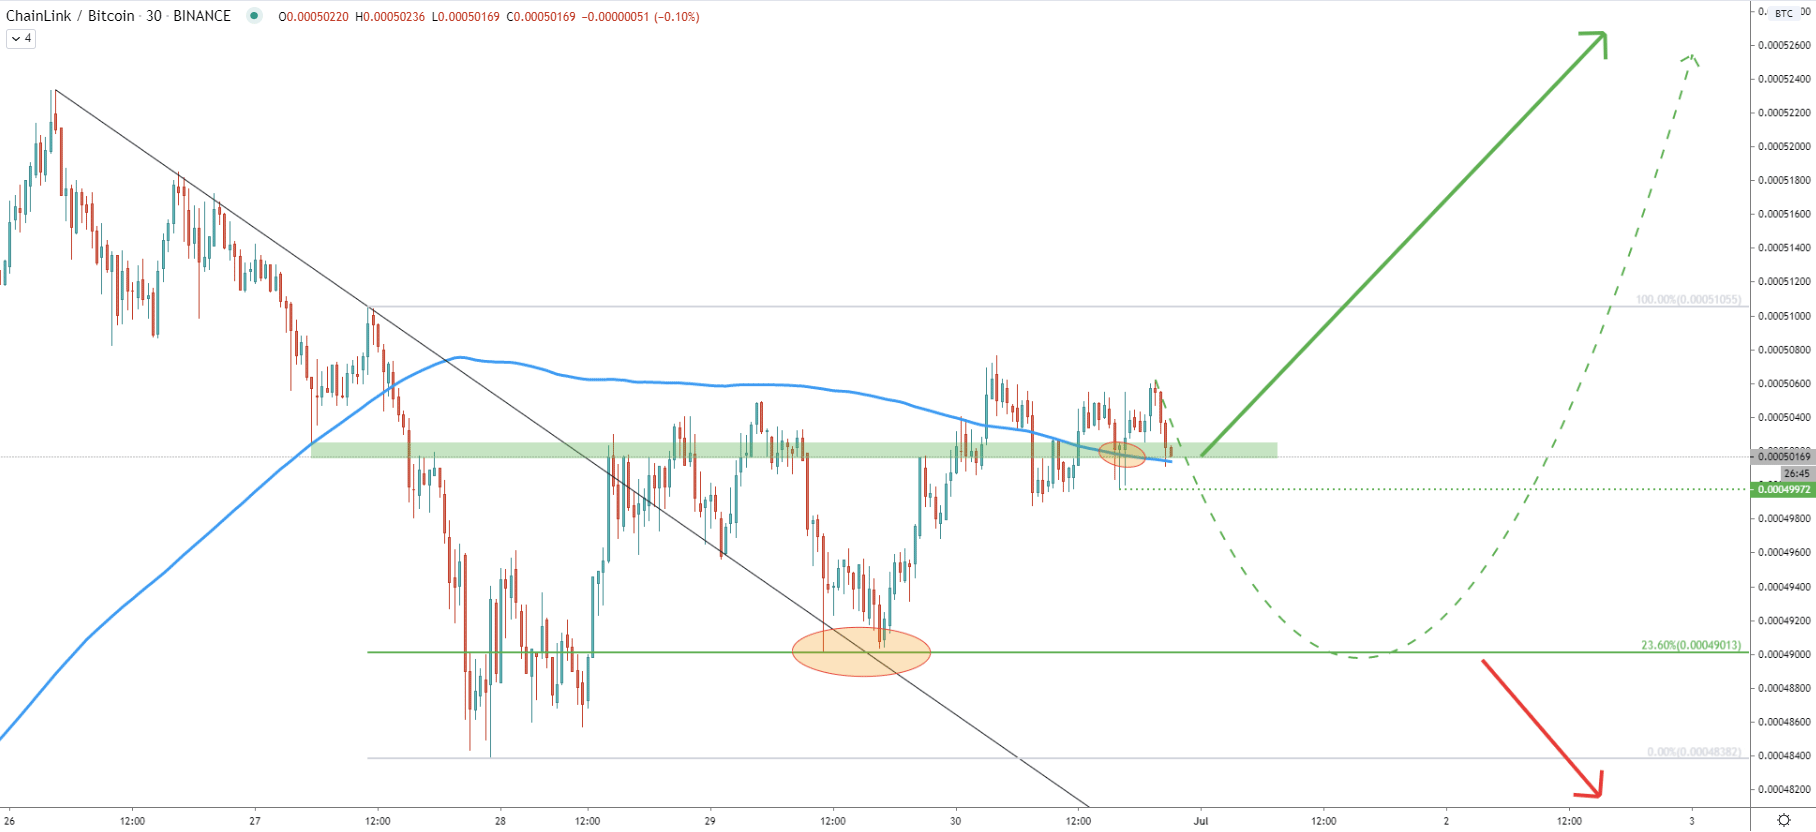
Finally comes the 30-minute chart, where price rejected cleanly 48,013 Satoshis level which is 23.6% Fibs applied to the last wave down. After the bounce, the price went up and broke above the 200 EMA, which now is acting as the support. The EMA support is currently being rejected and as long as hourly close remains above 49,972 satoshis, it could be considered as a starting point for yet another wave to the upside.
The ChainLink has been outperforming the Bitcoin for years, and there are no strong indications that this tendency has come to an end. There is a high probability that the next move will be towards the new all-time high, but only if the support level will not be broken.
There is a very strong resistance area between 62,752 and 63,196 satoshis as per all charts in this analysis. It seems that if/when this price area will be reached, it might play a very important role in further price development. If there will be a break above, LINK/BTC could continue moving up exponentially towards new highs. On the other hand, the rejection might confirm a strong downside correction which can last for months.
As per the 4h chart, there are several price action scenarios that should be considered. The most positive one is that LINK/BTC will continue moving up, without any further correction to the downside. It is also possible that the price will attempt to break below the 48,382 Satoshis support level, which is the most recent low. And if this attempt will fail, ChainLink can be expected to continue moving up. The third scenario is that price will correct down strongly, to test 88.6% Fibs support area at 43,462. And the final scenario suggests price decline towards the key long-term support at 40,580 Satoshis, and if this support gets broken, LINK/BTC could be reversing to the downside.
Support: 0.00049972, 0.00049013, 0.00048382
Resistance: 0.00051055, 0.00056739, 0.00062752