
Published: August 3rd, 2020
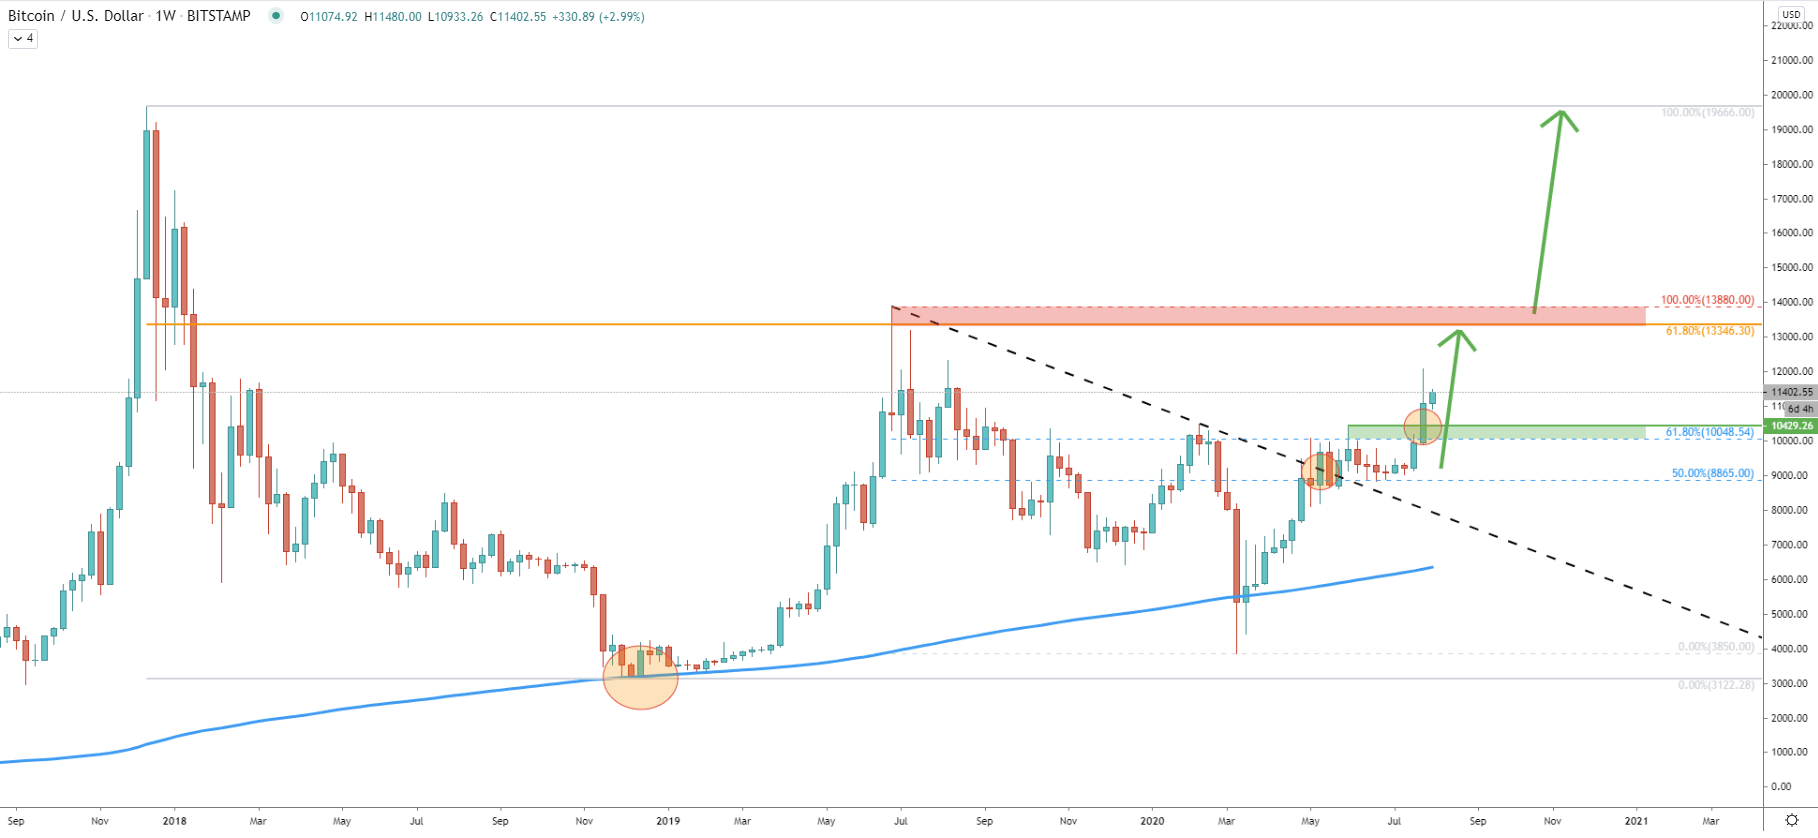
During the past three weeks, Bitcoin has been on a steady rise. On April 30, the price has tested the long-term downtrend trendline, but then, for the 3 months, there was no confirmation of the trendline breakout on the weekly chart. Finally, last week’s price broke and closed above all highs produced though the 3-months period. This could be the confirmation of the beginning of the medium and even long term uptrend.
Nonetheless, such confirmations are usually signalling about the very beginning of the trend, and price pullbacks can be expected, especially considering that the breakout occurred on the Weekly chart. But overall, the trend should remain bullish, and eventually, BTC/USDT could rise towards the $13,346, which is the 61.8% Fibonacci retracement level applied to the overall corrective move down after BTC produced an all-time high.
Moving back to the potential corrective move, the support area has been formed between 10,000 and 10,400. There is a high probability that it can be re-tested this or next week, before/if the price will continue to rise. But we will look in more detail at the correction scenarios in the following charts.
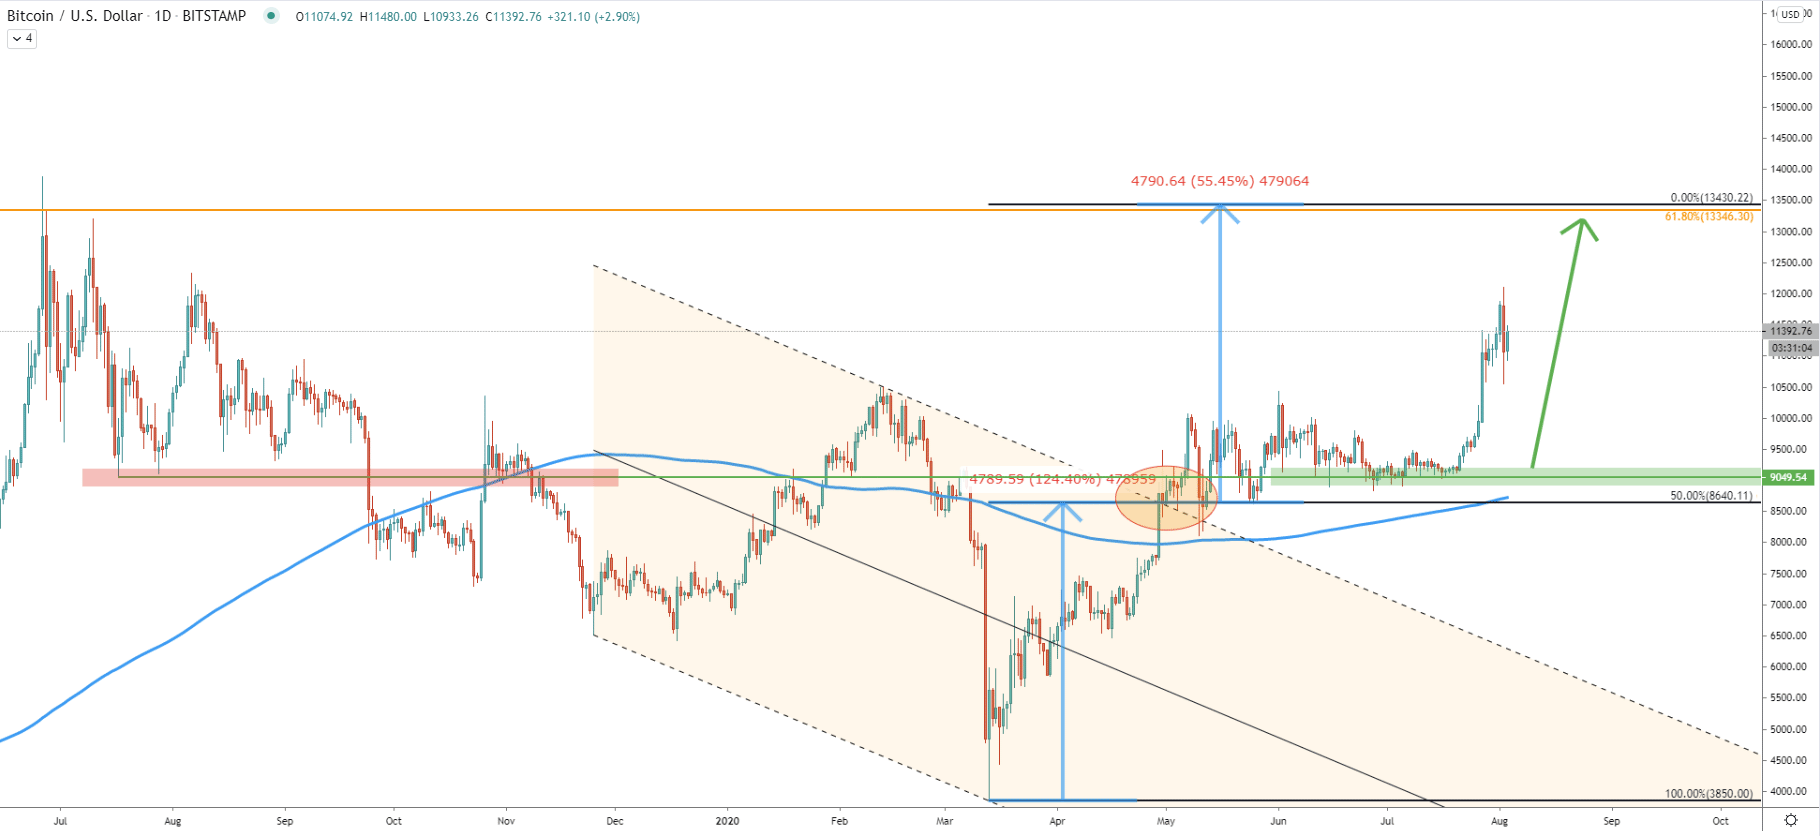
Here price broke above the descending channel as well as 200 Exponential Moving Average. We have applied the Fibonacci retracement level to the channel breakout point so that a 50% level is placed at the point of the penetration. Usually, the price distance before the channel breakout equals to the distance after the breakout. In this case, 0% Fibonacci retracement at $13,430 is showing the potential upside target, which corresponds to the 61.8% Fibs at $13,346, as per the weekly chart.
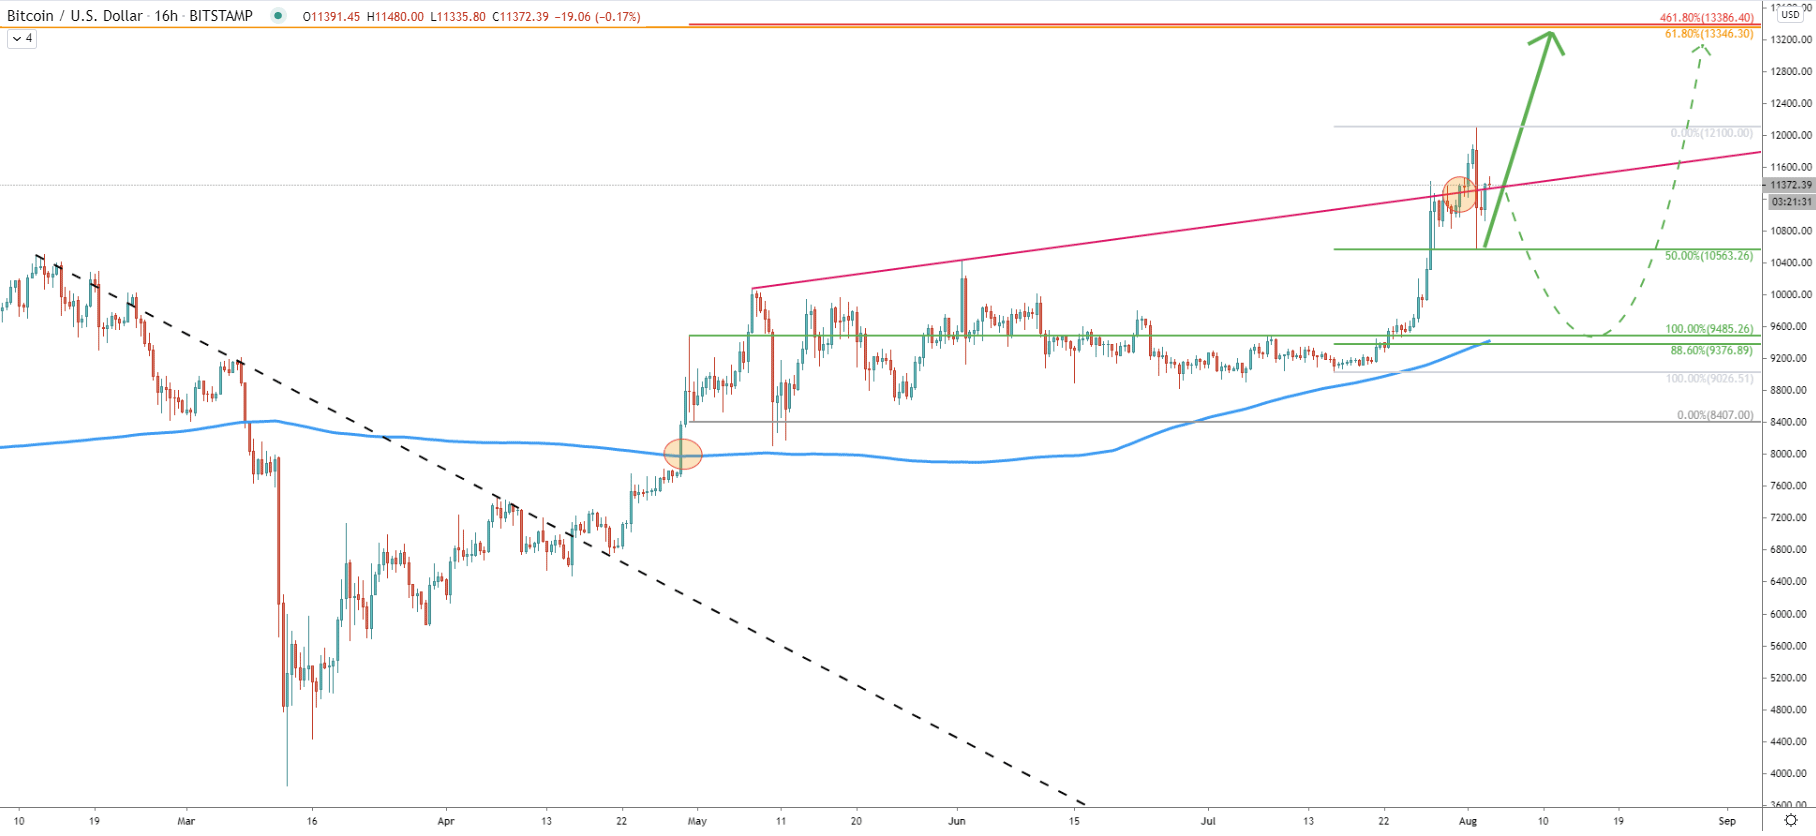
On the 16-hour chart, there is a very obvious uptrend, where Bitcoin continues to produce higher highs and higher lows. Price broke above the resistance uptrend trendline suggesting further bullish intentions. The most recent price action shows that BTC/USDT has reached the high at $12,100, after which corrected down and cleanly rejected 50% Fibs at $10,563.
The $12,100 support becomes quite an important level to watch because as long as the Daily closing price remains above, the exponential uptrend can be expected to continue.
But, if there will be a clean Daily close below the support, the Bitcoin is highly likely to continue the downside correction. In this scenario, price should be aiming for the $9,376 support, which is 88.6% Fibonacci retracement level corresponding to the 200 Exponential Moving Average.
In regards to the upside target, on this chart, we have applied the Fibonacci retracement indicator to the pullback after price broke above the 200 EMA. We can see that 461.8% retracement level corresponds to the already mentioned resistance at 61.8% Fibs
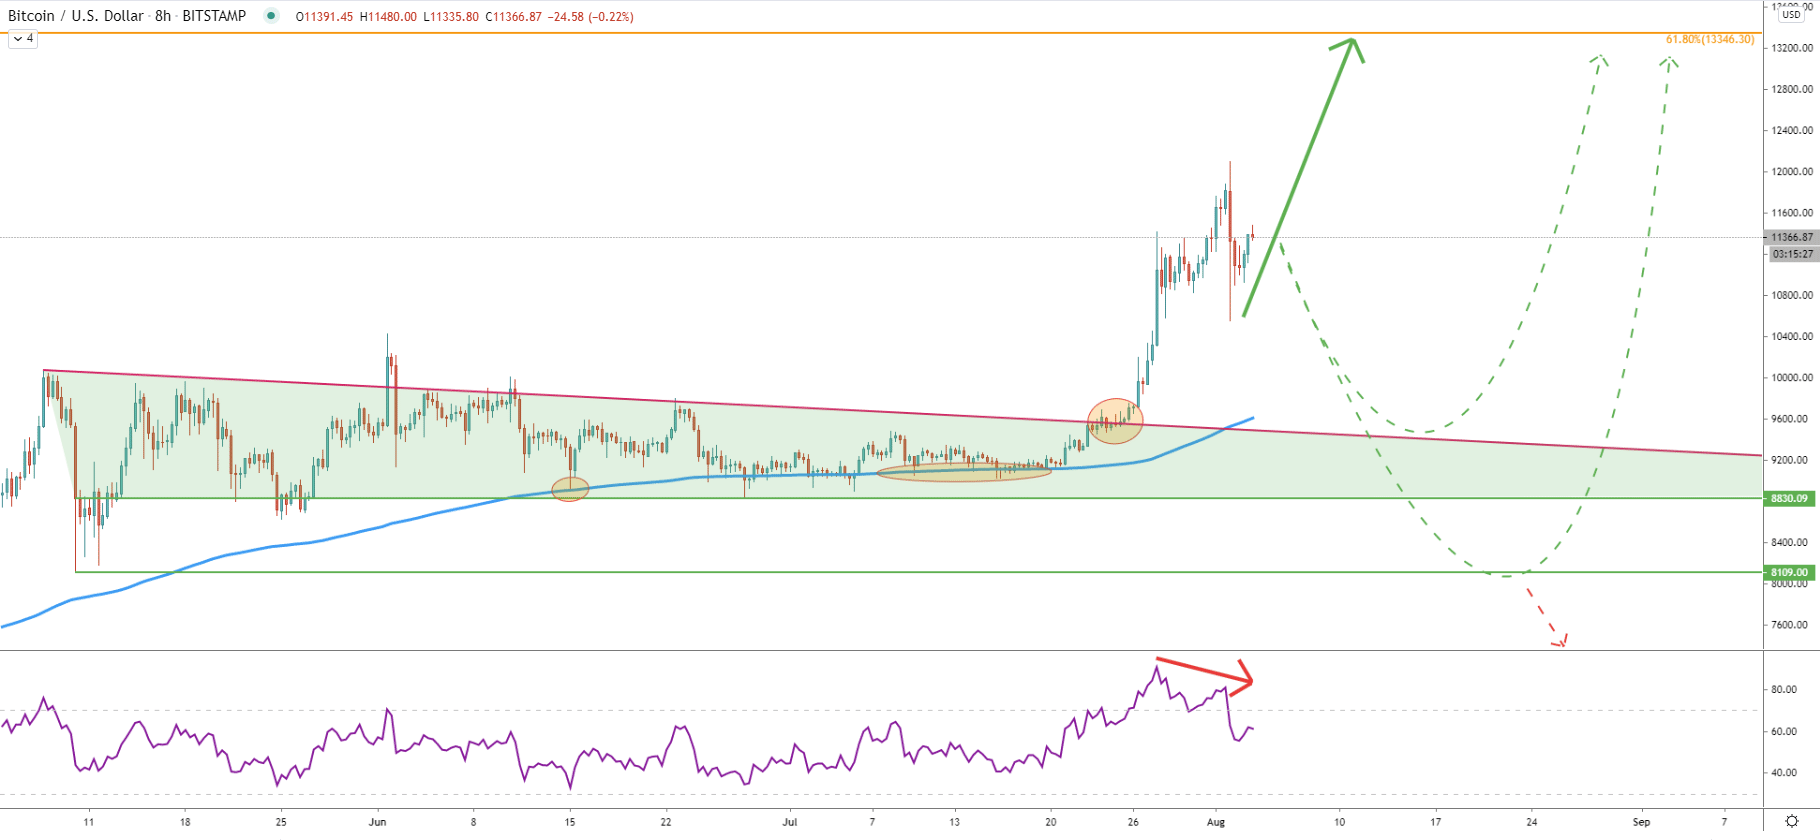
The correction could also take place because after price broke the triangle pattern, and has reached the recent higher high, the RSI oscillator formed a bearish divergence, suggesting a correctional move down. On the other hand, the correction already occurred, where BTC rejected the 50% Fibs as per the 16-hour chart.
But obviously a stronger price pullback can also occur, where the second important support area is seen at $9,376 as per the 16-hour chart, and on this chart, it corresponds to the downtrend trendline of the triangle. Perhaps the correction will be even stronger, pushing price down to the $8,100, but at this stage considering the current price action, such a scenario has a very low probability.
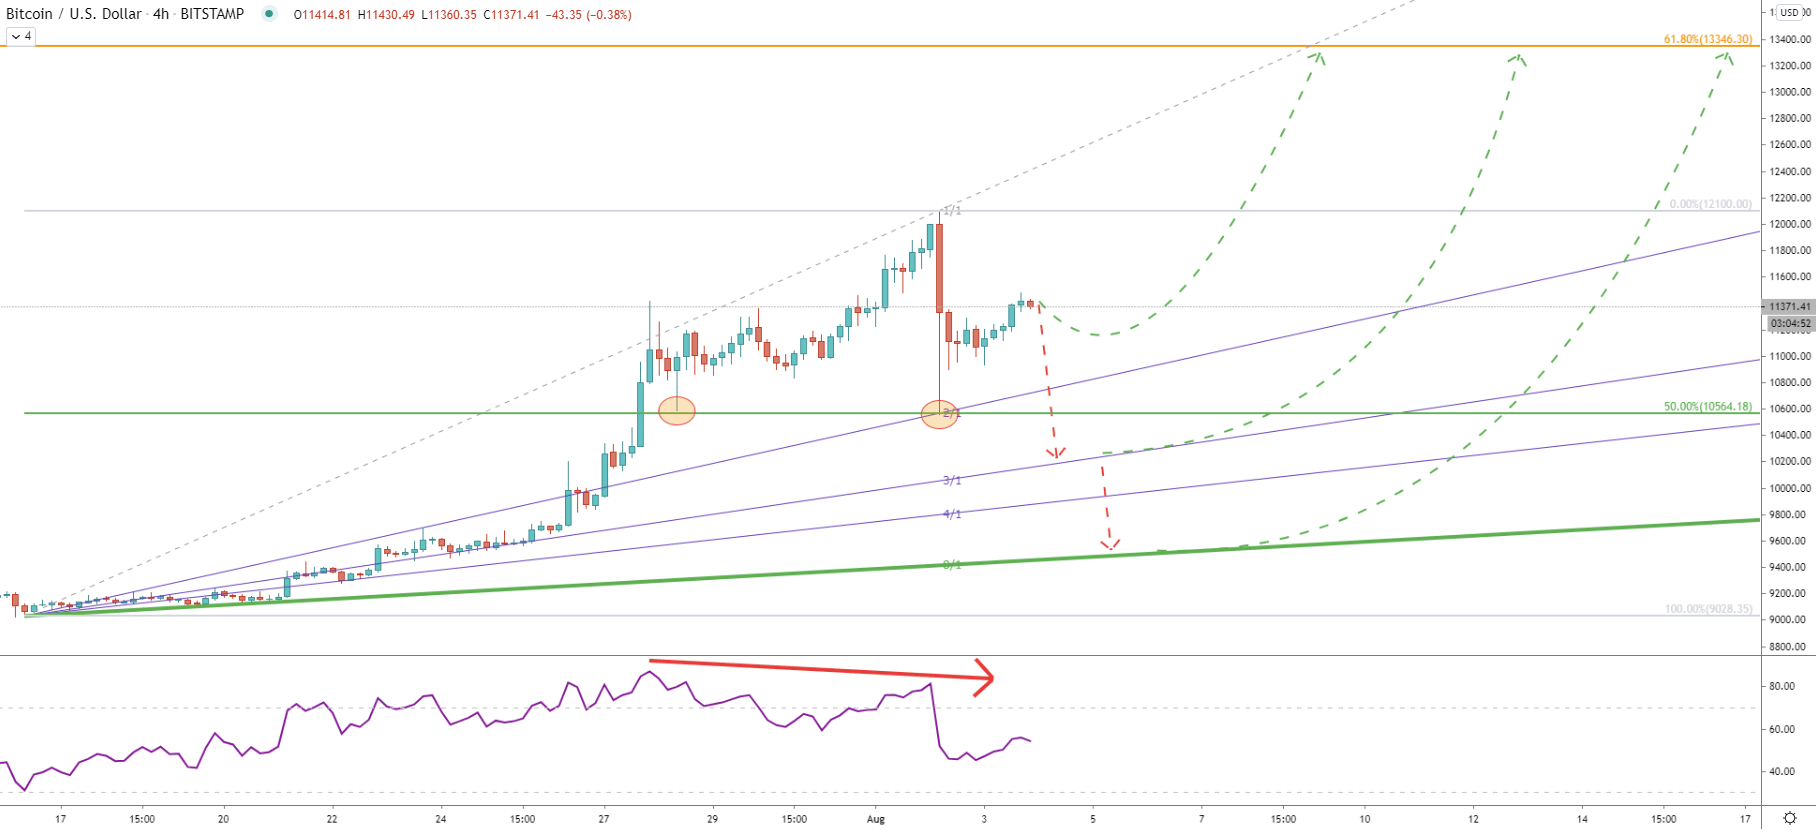
On the 4-hour chart, we have shared multiple possibilities of the downside correction. First off, this is a 2/1 Gann Fan uptrend trendline, which was already rejected cleanly along with the 50% Fibs at $10,564. If price breaks and closes below this support, Bitcoin can drop towards one of the next Gann Fan uptrend trendlines. However, the $10,500 area still remains a very attractive buying zone, since bulls are clearly defending it. This could also mean that the upturned will continue without any major correction to the downside.
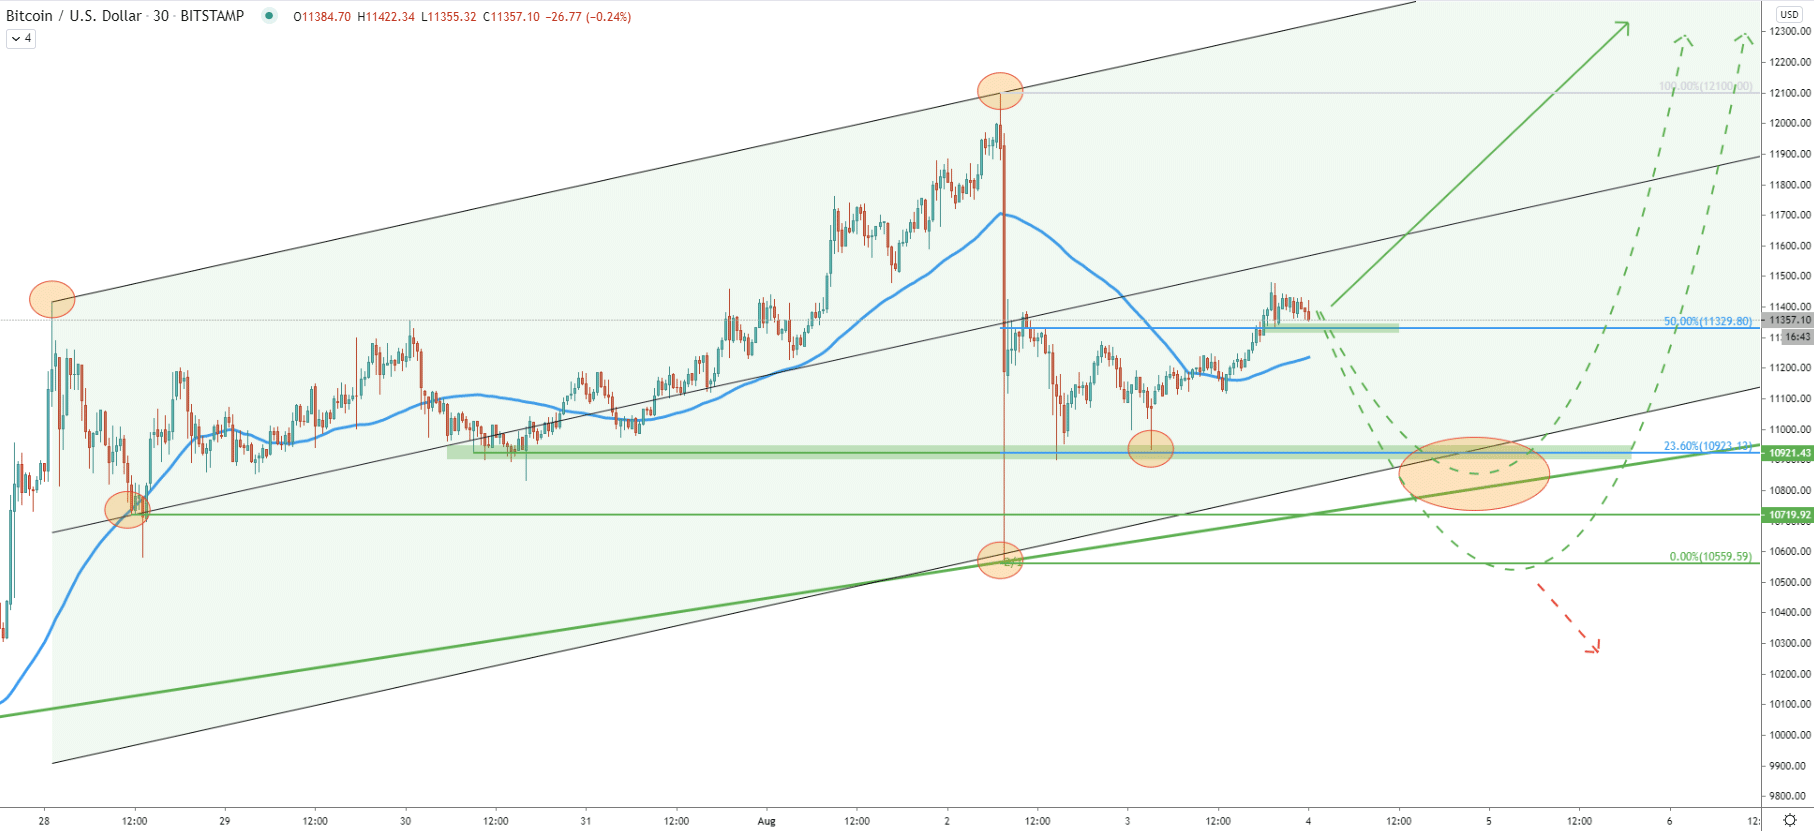
Finally comes the 30-minute chart where currently BTC/USDT is facing minor support at 50% Fibs. As long as it holds, there will be attempts to continue the uptrend, although the $10,923 price area seems to be a much more attractive level for buyers.
All-in-all, Bitcoin could be confirming the beginning of a medium-term uptrend. But the bearish divergence formed on the two different timeframes is suggesting that there will be a stronger pullback, before/if the Bitcoin will continue rising. Perhaps buyers will remain silent for the time being and will get more active once the price will reach $10,500 - 11,000 price area.
As per the weekly chart, the upside target is seen at $13,346 level which is confirmed by 61.8% Fibs. But spikes above this level are also possible and Bitcoin could be even testing $14,000 psychological resistance.
The key support is seen at $9,375. Daily break and close below this price could be a signal of bearish domination, thus invalidating the bullish scenario.
Support: 10925, 10560, 9375
Resistance: 12100, 13345, 14000