Published: July 12th, 2023
The Tezos (XTZ) ecosystem celebrated its fifth year of operation on June 30, 2023. Throughout the celebration, the Tezos team highlighted 14 successful upgrades from Athens to Nairobi, demonstrating the platform's dedication to continuous development.
Additionally, Tezos has become the second most popular blockchain in France, behind Ethereum. This innovative network has over 400 bakers or validators, solidifying its position as a leader in the blockchain industry. Consequently, Tezos experienced a significant price increase of 7.2% over the course of the week.
Similar to Ethereum, Tezos is a blockchain network that is dependent on smart contracts. However, it distinguishes itself by providing a more sophisticated infrastructure that can evolve and improve without the risk of a hard fork; Tezos' native cryptocurrency, XTZ, allows holders to vote on proposed protocol enhancements presented by Tezos developers.
In addition, Tezos stands out due to its adoption by notable enterprises. The French banking behemoth Societe Generale announced in September 2020 its intention to use Tezos as a platform for experimenting with a central bank digital currency, demonstrating the network's credibility and potential.
Major cryptocurrency exchanges such as Binance and Coinbase have also acknowledged Tezos by introducing staking support, enabling users to receive rewards based on their XTZ holdings. This unique characteristic distinguishes Tezos from many other digital assets on the market.
Let’s see the upcoming price direction of Tezos from the XTZ/USDT technical analysis
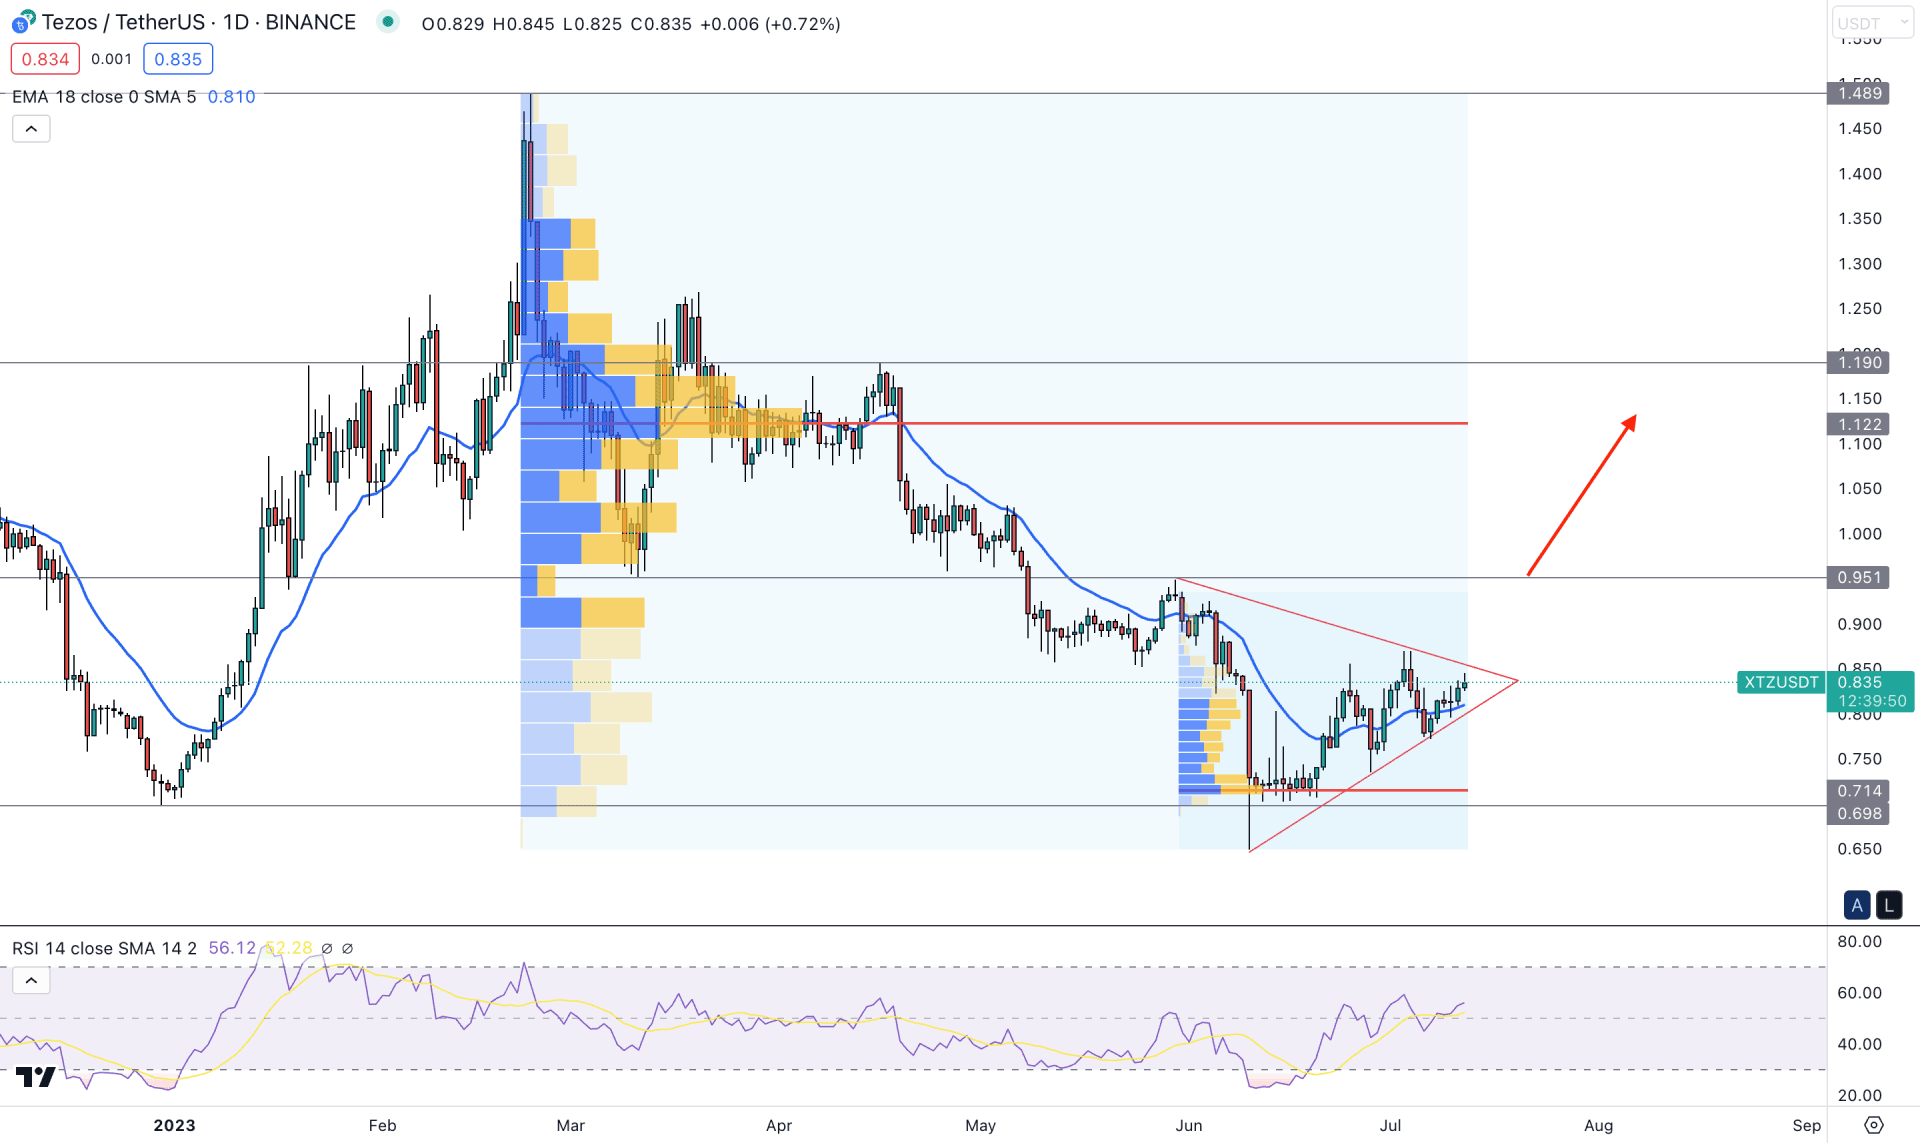
The selling pressure in XTZ/USDT is questionable from the strong exhaustion at the 0.698 key support level. Sellers tried to eliminate early gains and pushed the price below this critical level in June 2023. However, bulls immediately took action and eliminated the loss with a long wicked daily candle formation. The sell-side liquidity sweep from the 0.698 key support level is the primary sign that bulls are strongly active in the market and can rebound the price anytime.
In the most recent chart, the current price trades sideways, within a symmetrical triangle formation, suggesting a strong breakout is needed before aiming for a stable trend. On the upside, 0.951 is the major resistance level, which needs to recover before finding a conservative bullish approach.
In the volume structure, the broader outlook is still bearish as the high volume level since the February high is 1.122, which is 34.49% higher than the current price. However, the latest high volume level from the 31 May 2023 high is at 0.712, and the price has been trading above this level for over a month.
The latest price found support at the 20-day EMA level, while the current RSI is bullish above the 50.00 neutral line.
Based on the daily price outlook, the broader market direction is still bearish, and sellers may regain momentum anytime. As the current price trades within a triangle pattern, a valid break below the triangle support is needed before opening a short position.
On the other hand, a stable price above the 0.951 key resistance level is needed to open a long position, where the main aim is to test the 1.100 psychological level.
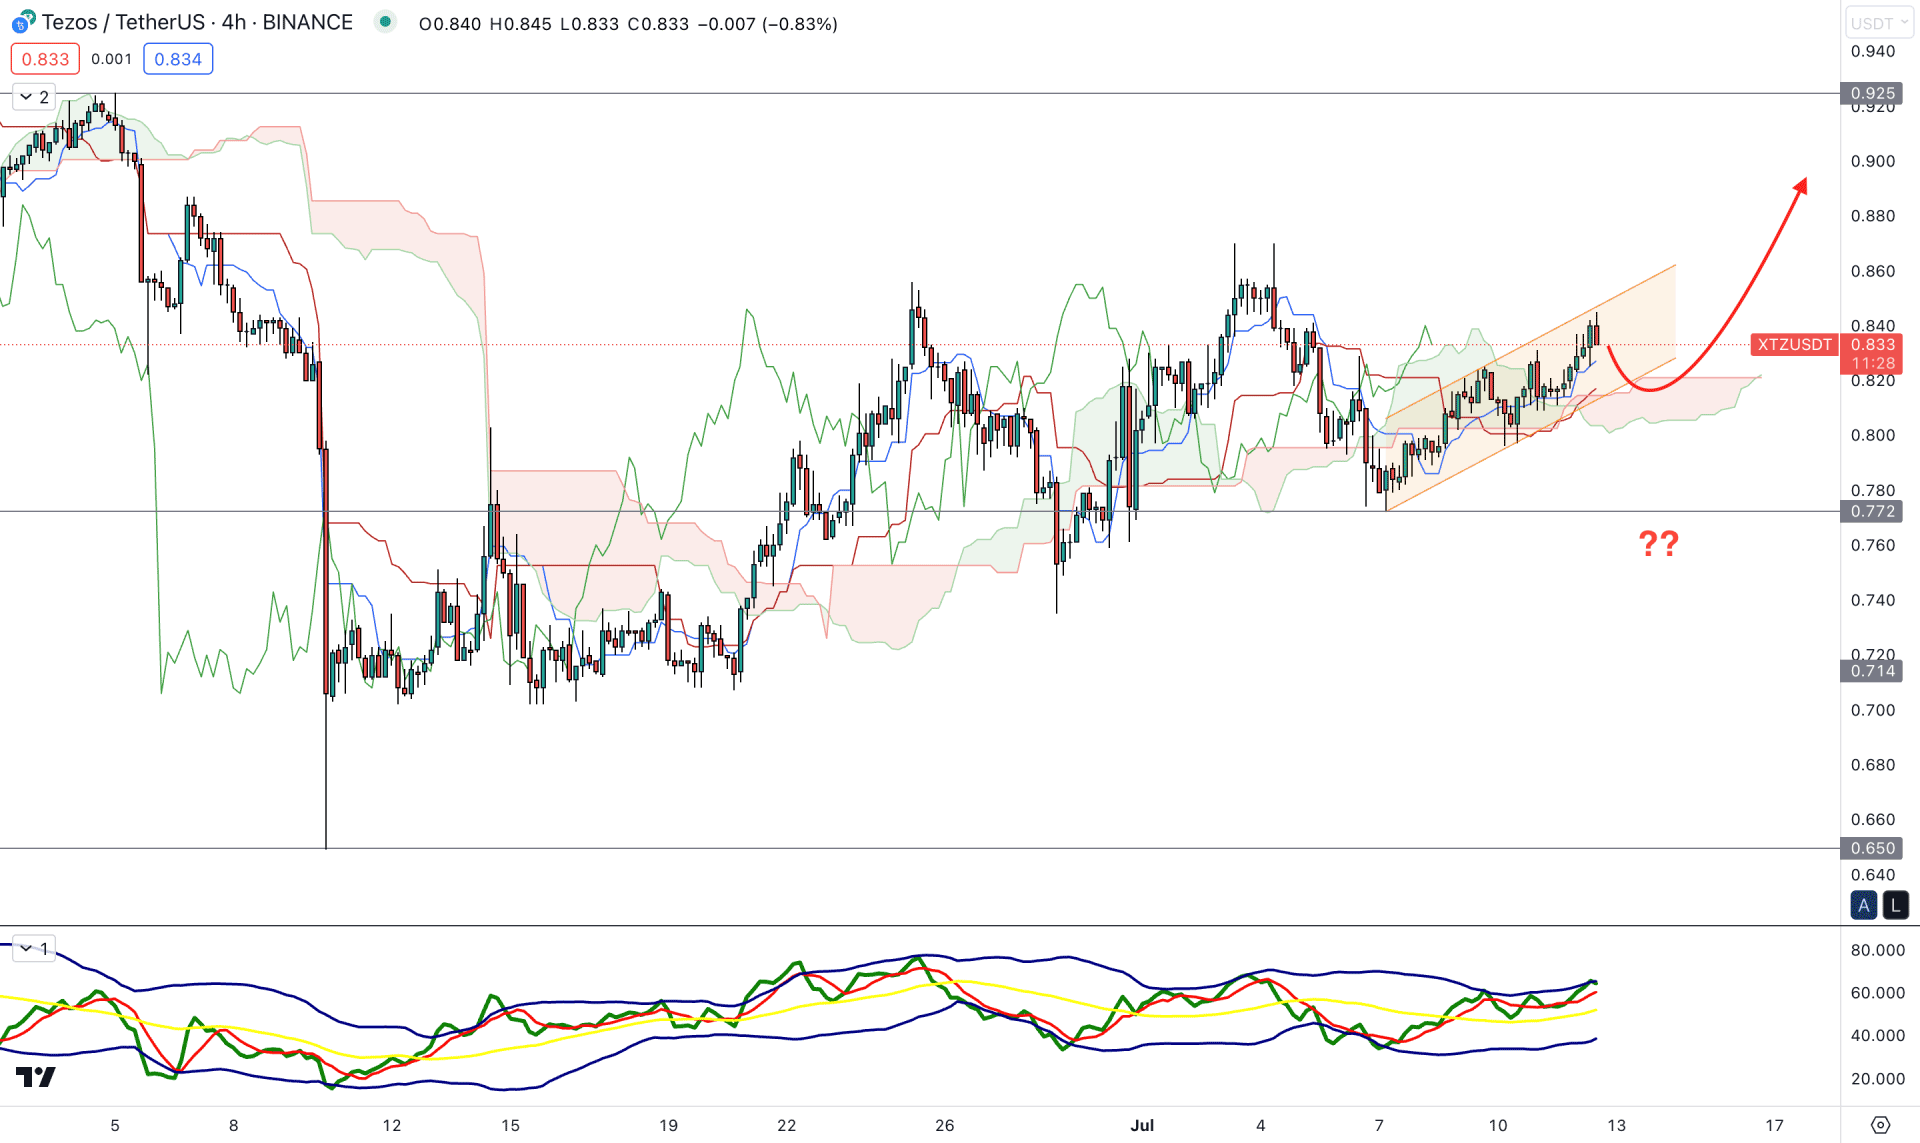
In the H4 chart, the current price is sideways as several violations are seen from the Ichimoku Cloud zone. The ideal trading approach for this price behavior is to wait for a valid breakout and a retest before anticipating a stable trend.
Moreover, the future cloud is indecisive as the Senkou Span A and Senkou Span B are closer together. However, dynamic Ichimoku support levels are still below the current price, working as a support level.
The Traders Dynamic Index shows an overbought price as the current TDI level found a barrier from the upper trajectory.
Based on the H4 price outlook, sellers need a strong break below the 0.772 static support level with a bearish H4 candle. It might invalidate the buying possibility and open rooms for testing the 0.650 swing low.
As the current price is trading above the cloud zone with support from dynamic Kijun Sen, a strong bullish rejection might resume the trend toward the 0.900 area.
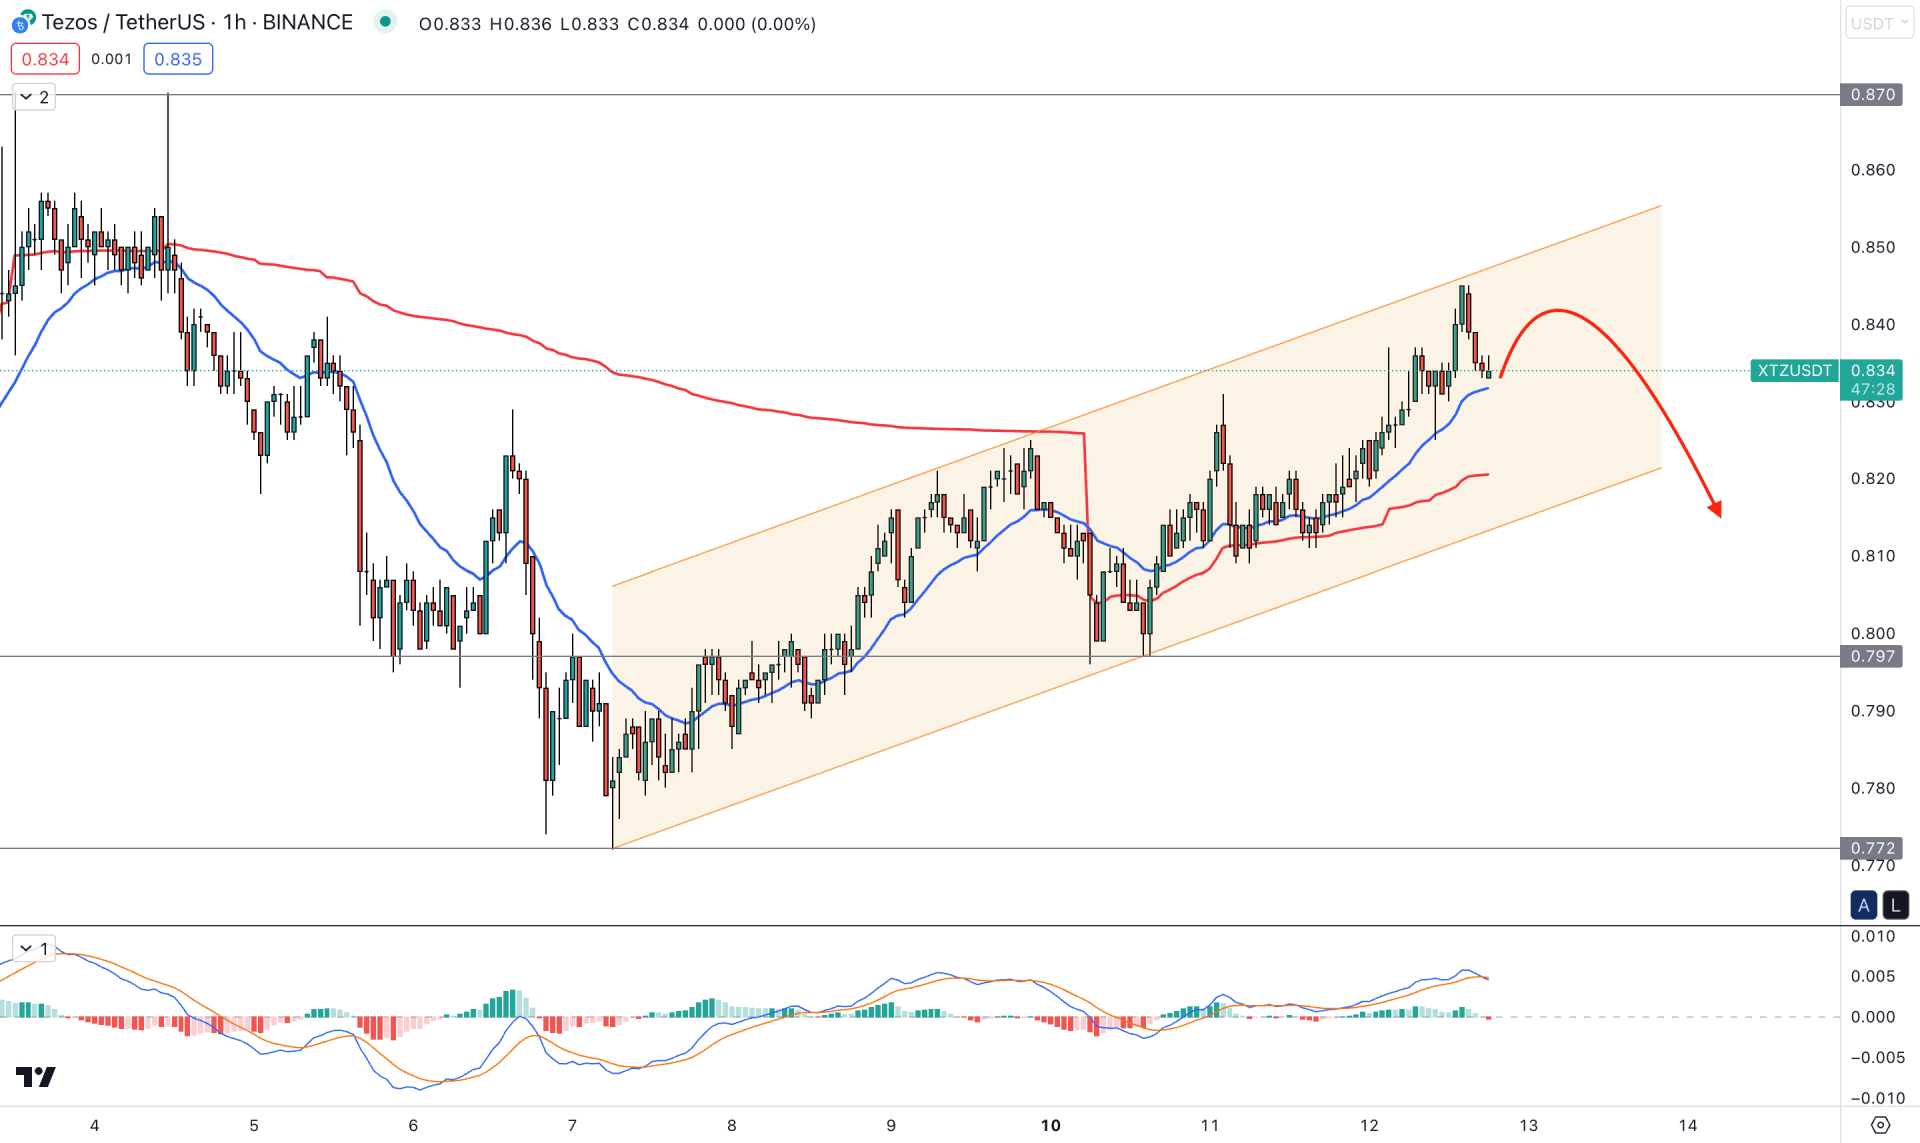
In the hourly chart, the XTZ/USDT price trades within an ascending channel where the price faces selling pressure from the channel resistance.
On the other hand, MACD EMA’s are above the neutral line and formed a bearish crossover. It is an indication of possible selling pressure in the market.
Based on the H1 outlook, investors should closely monitor the price as a bearish H1 candle below the channel support could lower the price toward the 0.772 support level.
On the bullish side, a strong bullish rejection is needed from the dynamic VWAP support level. Moreover, a false break below the channel support with an immediate recovery above the 20 EMA could offer another long opportunity, where the main aim is to test the 0.870 resistance level.
Based on the current price outlook, XTZ/USDT price showed an early sign of a bullish reversal, but a stable price above 0.951 is needed before anticipating a conservative buy. However, an early buying opportunity is available if the price shows a long signal from intraday H4 support levels.


