Published: January 11th, 2021
The recent rally of the Bitcoin actually resulted in the price drop of many altcoins against the dollar, not all, but still quite a few of them. In fact, nearly all altcoins went down against the Bitcoin, although this could be about to change. The reasoning behind this is that Bitcoin profit fixing is likely to take place is very near further. The money flow will shit to altcoins to further boos gains made from teh Bitcoin rally. Therefore, many altcoins are likely to enjoy massive gains against the USD as well as BTC in the coming weeks or months. Perhaps this is the time for the altcoins season? We will find out soon, but today we’ll look at one of the top alts, which is Tezos.
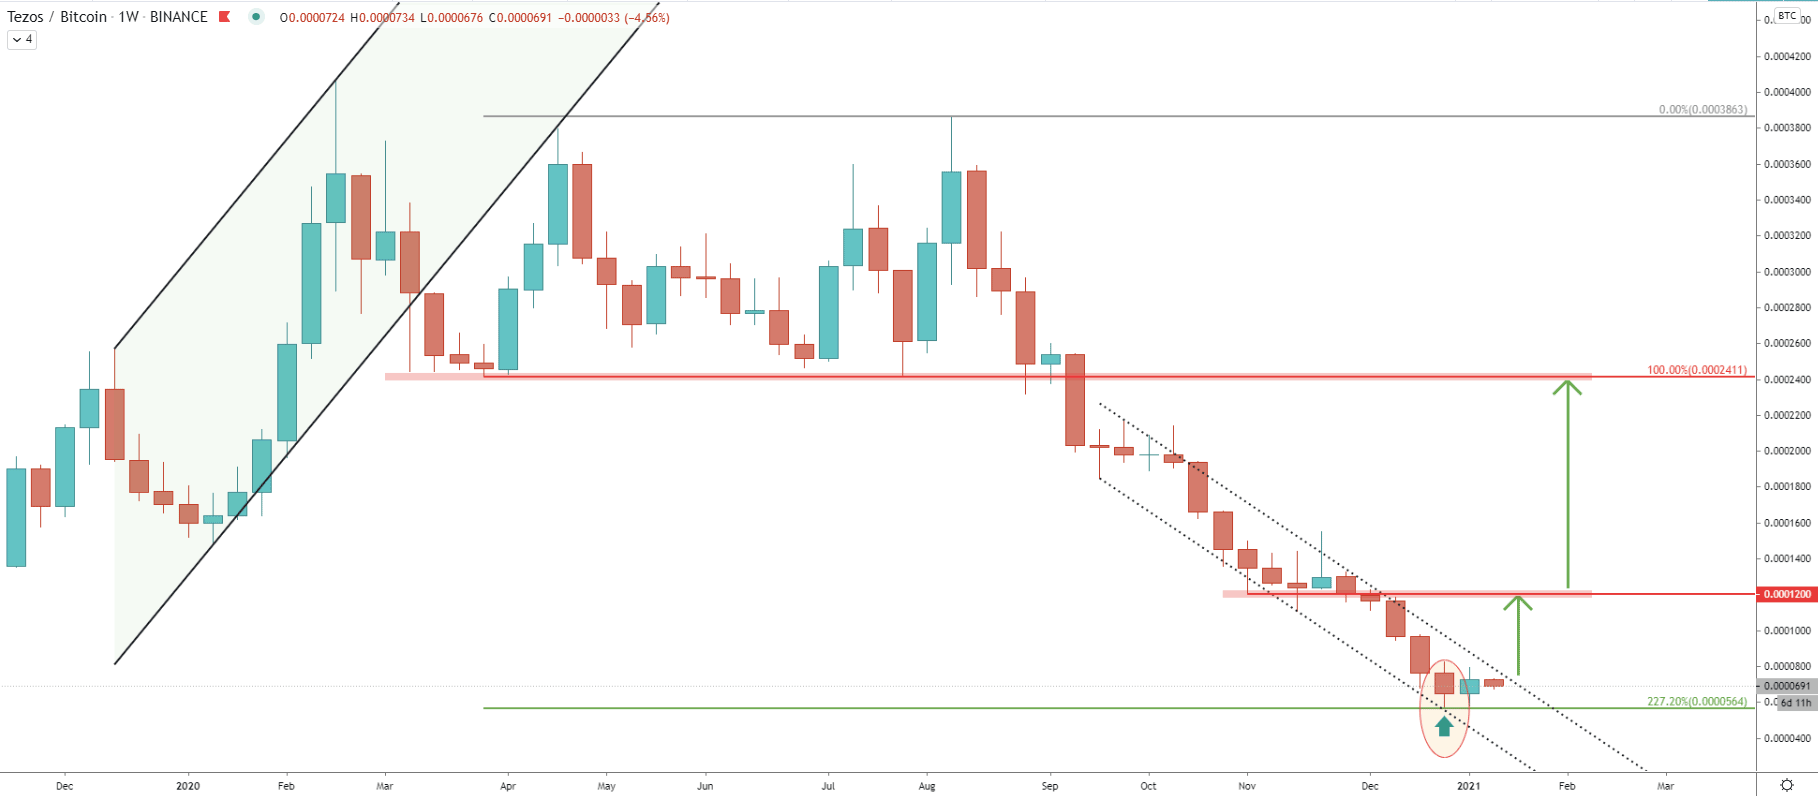
On the weekly chart, back In March last year, the price broke below the ascending channel and we’ve applied the Fibonacci retracement indicator to the corrective wave up after the breakout. It shows that two weeks ago, XTZ/USDT price has reached the 227.2% fibs at 564 satoshis, and rejected this support precisely. Maybe this has been the bottom of a long term downtrend, but it is nearly impossible to state that with confidence.
Nonetheless, as long as the current low is being respected, there are good chances that Tezos will start outperforming Bitcoin, at least in the medium term. If that will be the case, the nearest strong resistance could be located at 1200 satoshis, which corresponds to the previous level of support.
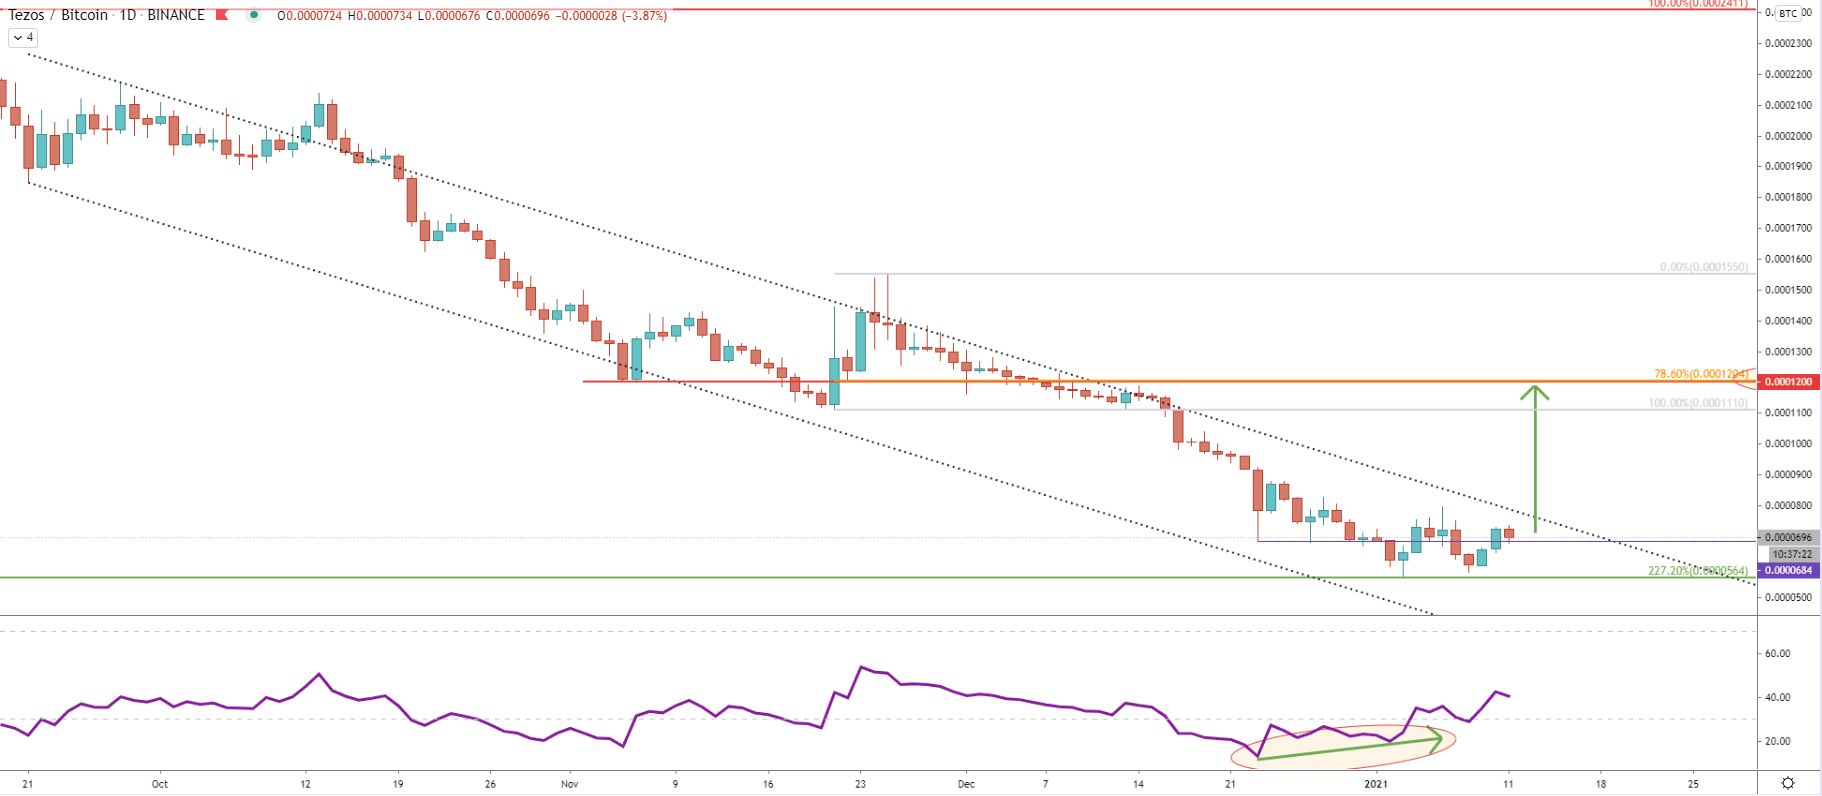
On the daily chart, the price continues to move within the descending channel. But after price found support at 564 satoshis, the RSI oscillator formed a bullish divergence, suggesting either a correctional upside move or even a long-term trend reversal. Based on the Fibonacci, applied to the previous corrective wave up, we can see that 1200 satoshis resistance, exactly corresponds to the previously mentioned supply area, which could make it a perfect upside target for buyers.
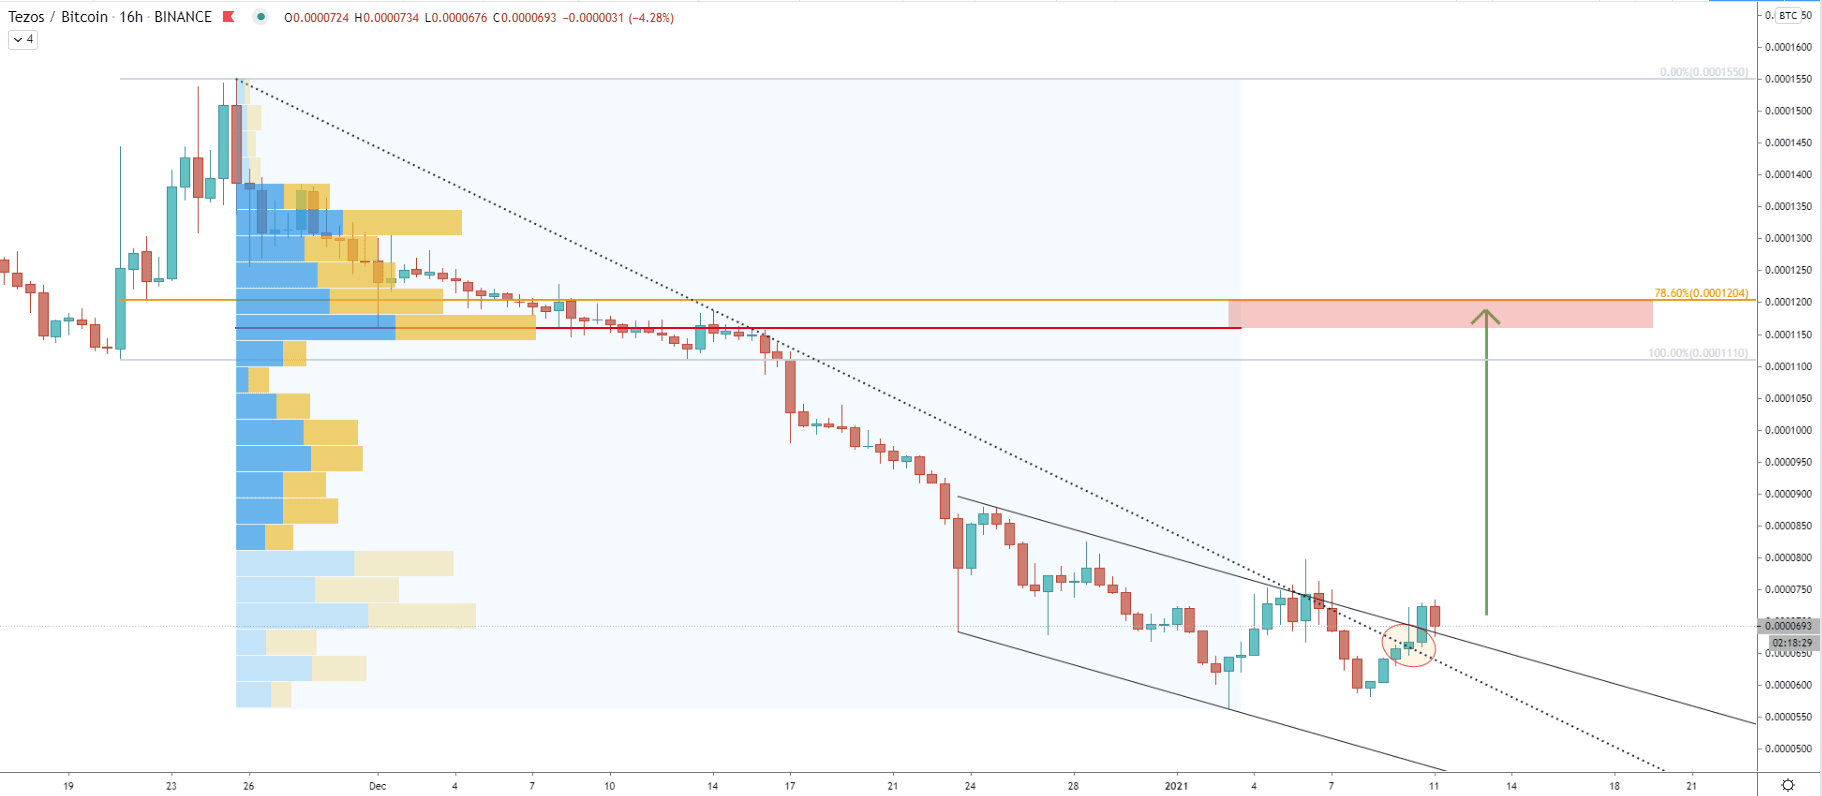
On the 16-hour chart, yesterday’s price broke above the downtrend trenldine as well as the descending channel. This could be yet another confirmation that bulls are starting to take control over the XTZ/BTC, which eventually will result in a strong move towards the 1200 satoshis resistance. Speaking of resistance, as can be seen on the chart, the most trading volume occurred 1160 and 1200 satoshis area, and this is likely to be the zone of interest for sellers if/when this area is reached.
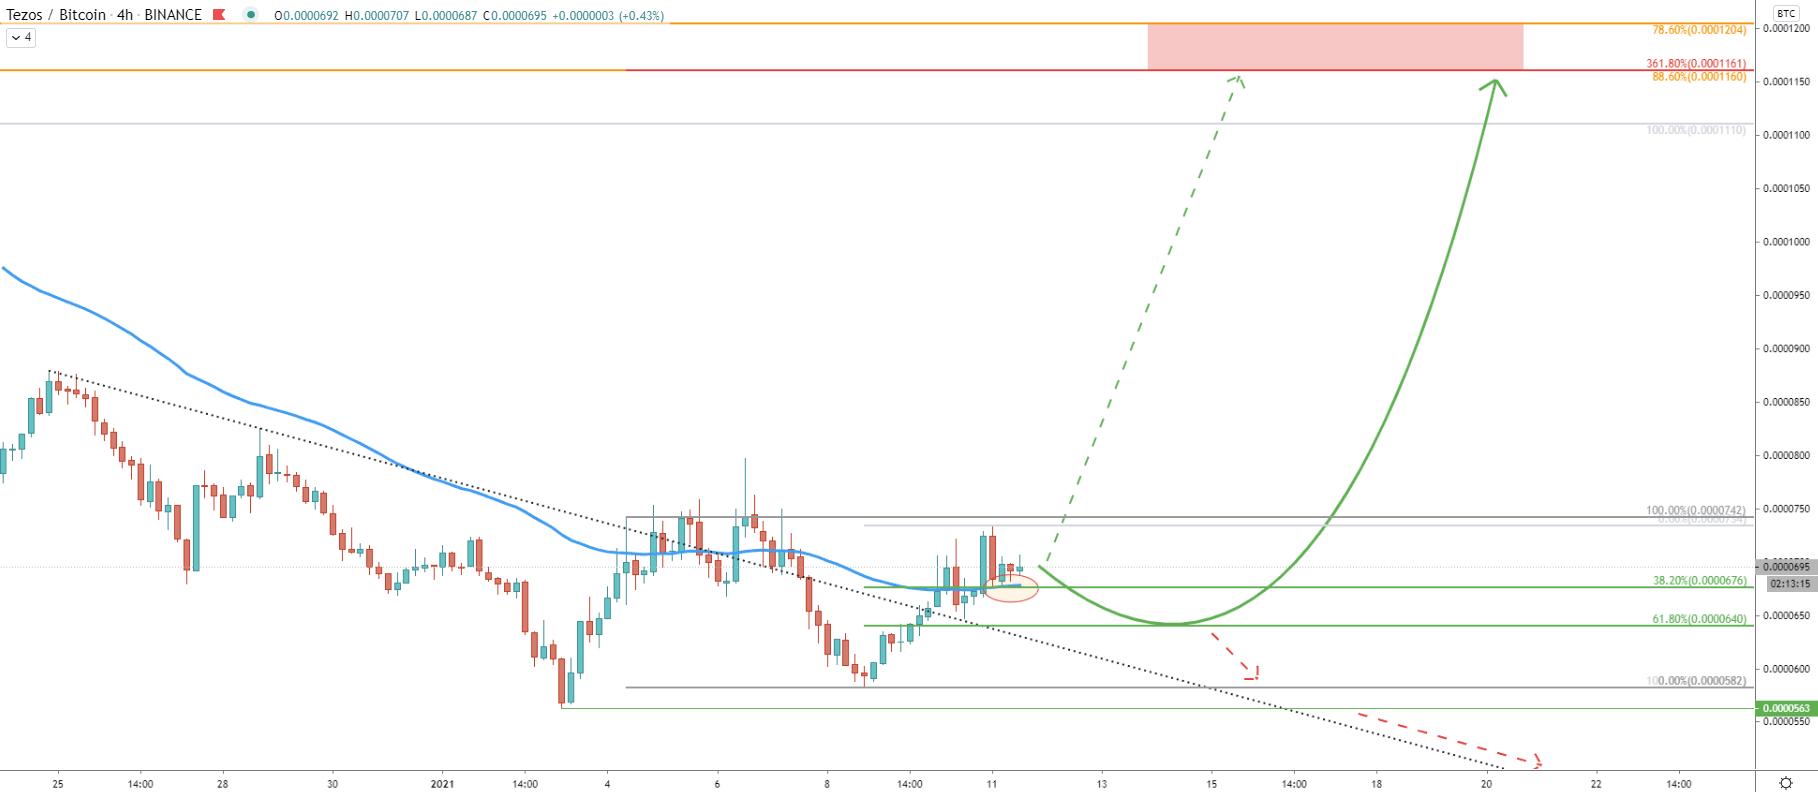
After the price broke above the downtrend trenldine it corrected won and rejected the 38.2% Fibonacci retracement level at 676 satoshis. At the same time, 200 Exponential Moving average got rejected, implying taht 676 level is strong support. This price could have been or can be a starting point of an uptrend as long as the price remains above. In this scenario, the 1600 - 1200 resistance area will be tested quite soon. Besides, the 1600 resistance also corresponds to the 88.6% Fibs as per the daily chart.
If XTZ will break and close below the 200 EMA, the price is likely to test 61.8% Fibs at 640 satoshis. If this support will be respected, an uptrend can be expected to start. Although break below will send Tezos even lower, potentially towards the 582 satoshis level before/if uptrend will take place.
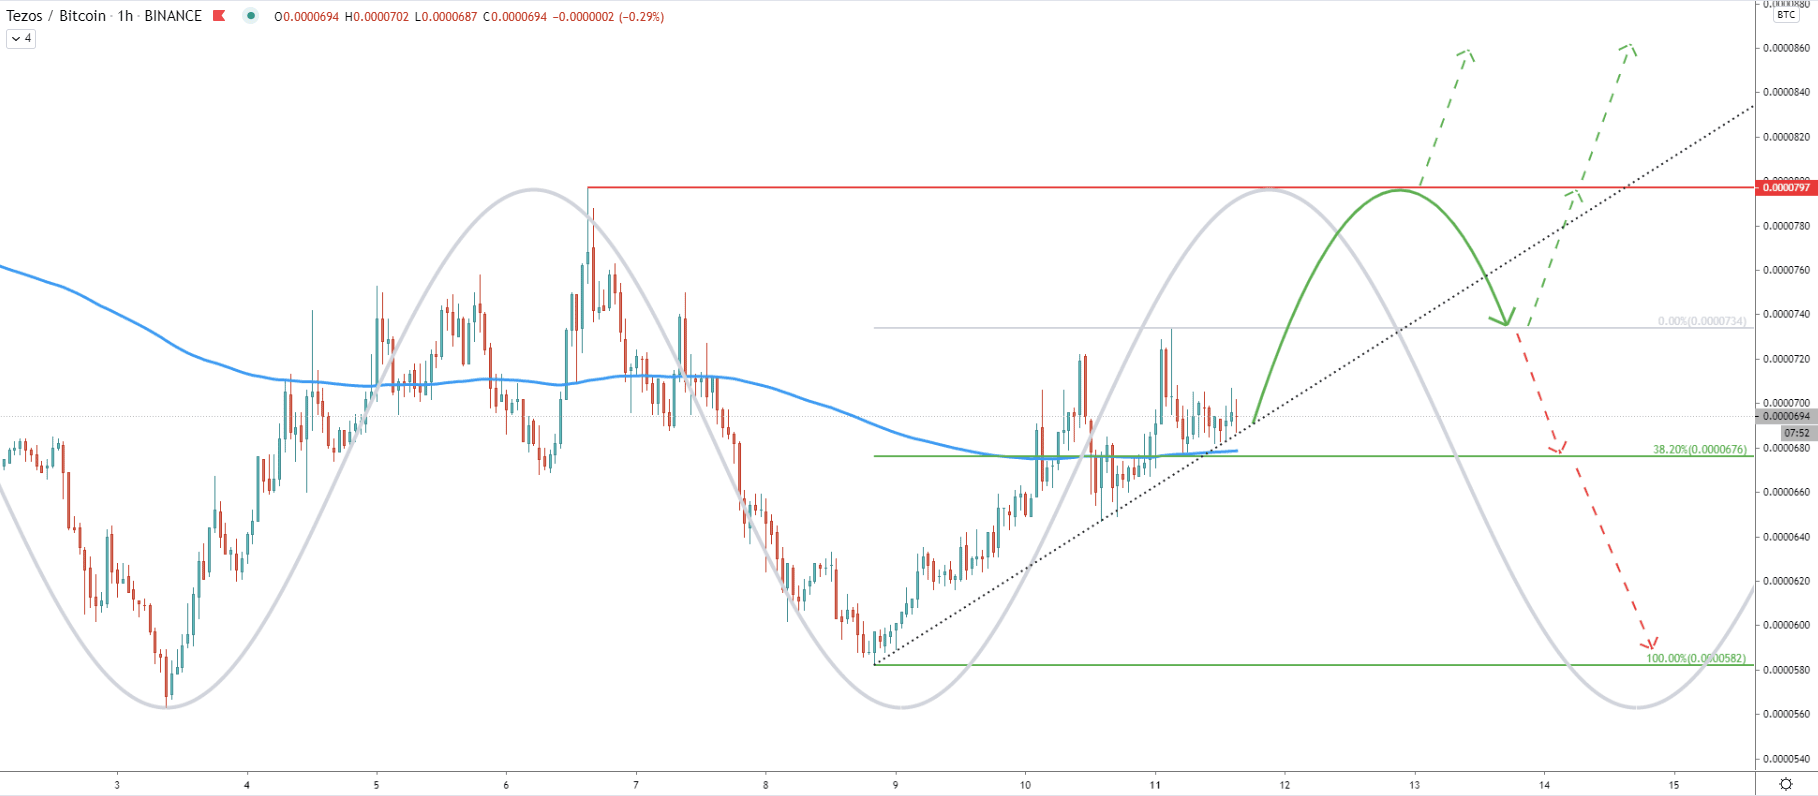
On the hourly chart, the new bull cycle has already begun and the price broke above the 200 EMA. After the breakout, a pullback followed, and right now XTZ/BTC is rejecting the simple uptrend trenldine along with the 200 EMA which is also acting as the support. This is certainly a very attractive buying area where the fight between bulls and bears might continue. But as long as the support holds bulls will remain in control, at least in the short term.
The local resistance can be seen at 797 satoshis, which is the price where previously XTZ bounced off. It is very important to see the break above this resistance, to trigger a much stronger buying pressure.
Tezos could have reached the bottom of the long-term downtrend. As long as the price remains above the lower low, XTZ/BTC will continue climbing up, which might send the price from the current level of 700, up to the key resistance at 1200 satoshis.
As per the daily and 4-hour chart, there are two important resistance levels based on the previous area of support, Fibonacci levels and trading volume. The first is located at 1160, which the second is at 1200 satoshis.
As per the 4-hour chart, a break below the 640 satoshis support, will make a buying opportunity much less attractive. But only break below the 563 satoshis low, will completely invalidate the bullish outlook, and the long term-downtrend might continue.
Support: 676, 640, 563
Resistance: 80, 1160, 1200