
Published: January 12th, 2022
Tesla stock rebounded from the bearish territory and showed a 7% gain on Monday. The bullish pressure came as soon as analysts upped the price target of this stock. According to Goldman Sachs analyst Mark Delaney, tesla bulls are strong due to their dominant position in the electric vehicle race.
According to some analysts, the recent record deliveries in cars clearly show that Tesla’s position in the EV industry is vital. The current expectation is a delivery of 2 million vehicles in 2022. In the previous year, Tesla delivered 936,000 vehicles and planned to increase the figure by 50% this year. The optimistic prediction came from Tesla’s operational expertise. There was a supply-chain bottleneck during the pandemic, but now the company has two new factories in Austin and Berlin. These will be a booster to the tesla stock, where the financial performance is still strong.
Currently, the company is offering the P/E ratio at 345.52, leading investors to believe that there is an inflated expectation in future stock growth. However, considering the current development and financial structure, Tesla stock has a higher possibility of breaking the recent ATH.
Let’s see the upcoming price direction from the Tesla stock (TSLA) technical analysis:
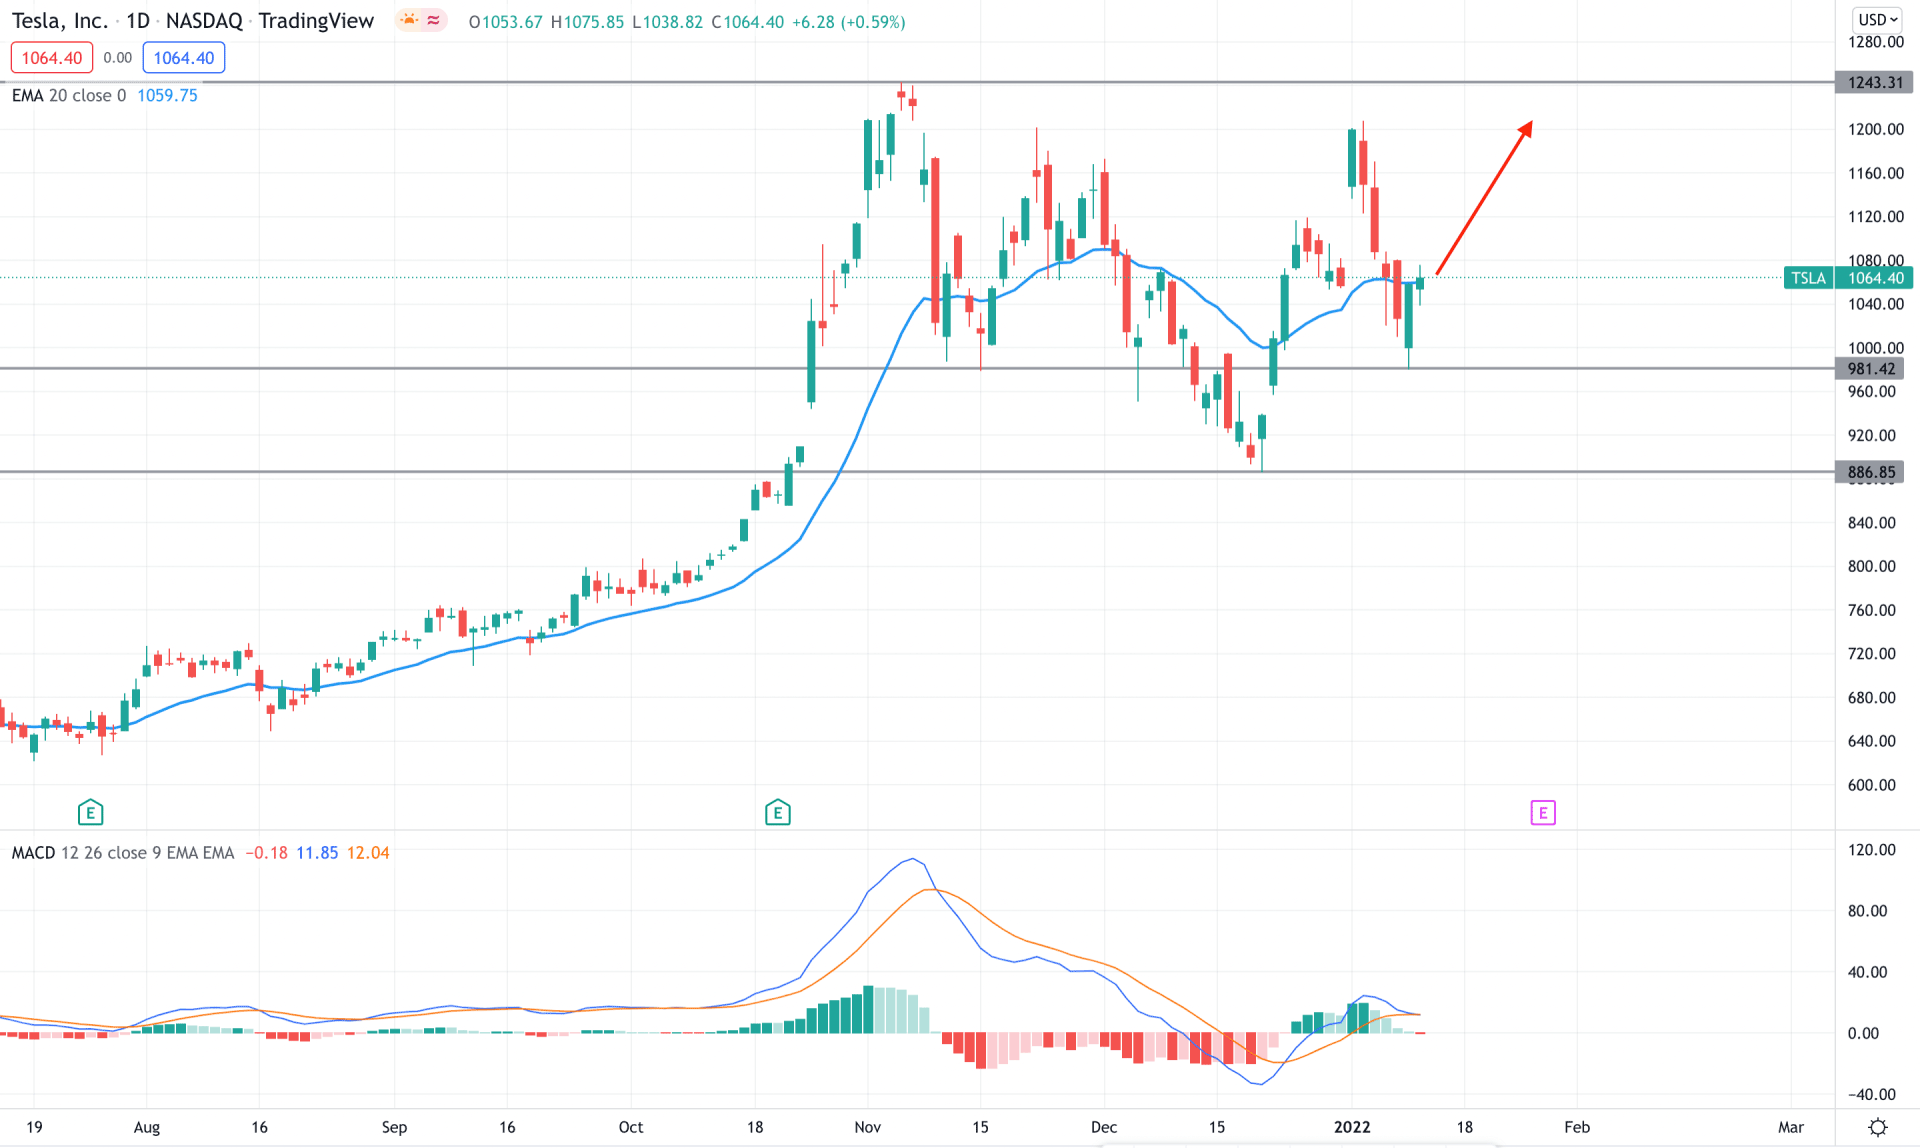
Tesla stock (TSLA) has shown an amazing performance in recent years where the price started to grow from the pre-pandemic level to an all-time high of 1243.39 level with a bullish impulsive pressure. Later on, the price corrected lower and tested the 886.85 level as a bottom. In the current price structure, the broader market context is bullish in the current price structure while the inverse head and shoulder pattern is in play. In that case, a bullish break above the dynamic 20 EMA would be a buying opportunity in this stock that may move higher to the current all-time high level.
The above image shows how the price trades at the dynamic 20 EMA resistance. Although the week started with a bullish vibe, the daily candle is still below the dynamic resistance. On the other hand, the MACD Histogram squeezes to the zero level and aims lower where there is no sign of divergence in the price.
Based on the daily structure, a bullish daily close above the dynamic 20 EMA would be a buying opportunity in this pair, where the primary target would be the 1243.39 level. On the other hand, a break below the 981.42 level with a bearish daily close might initiate the broader correction in the price.
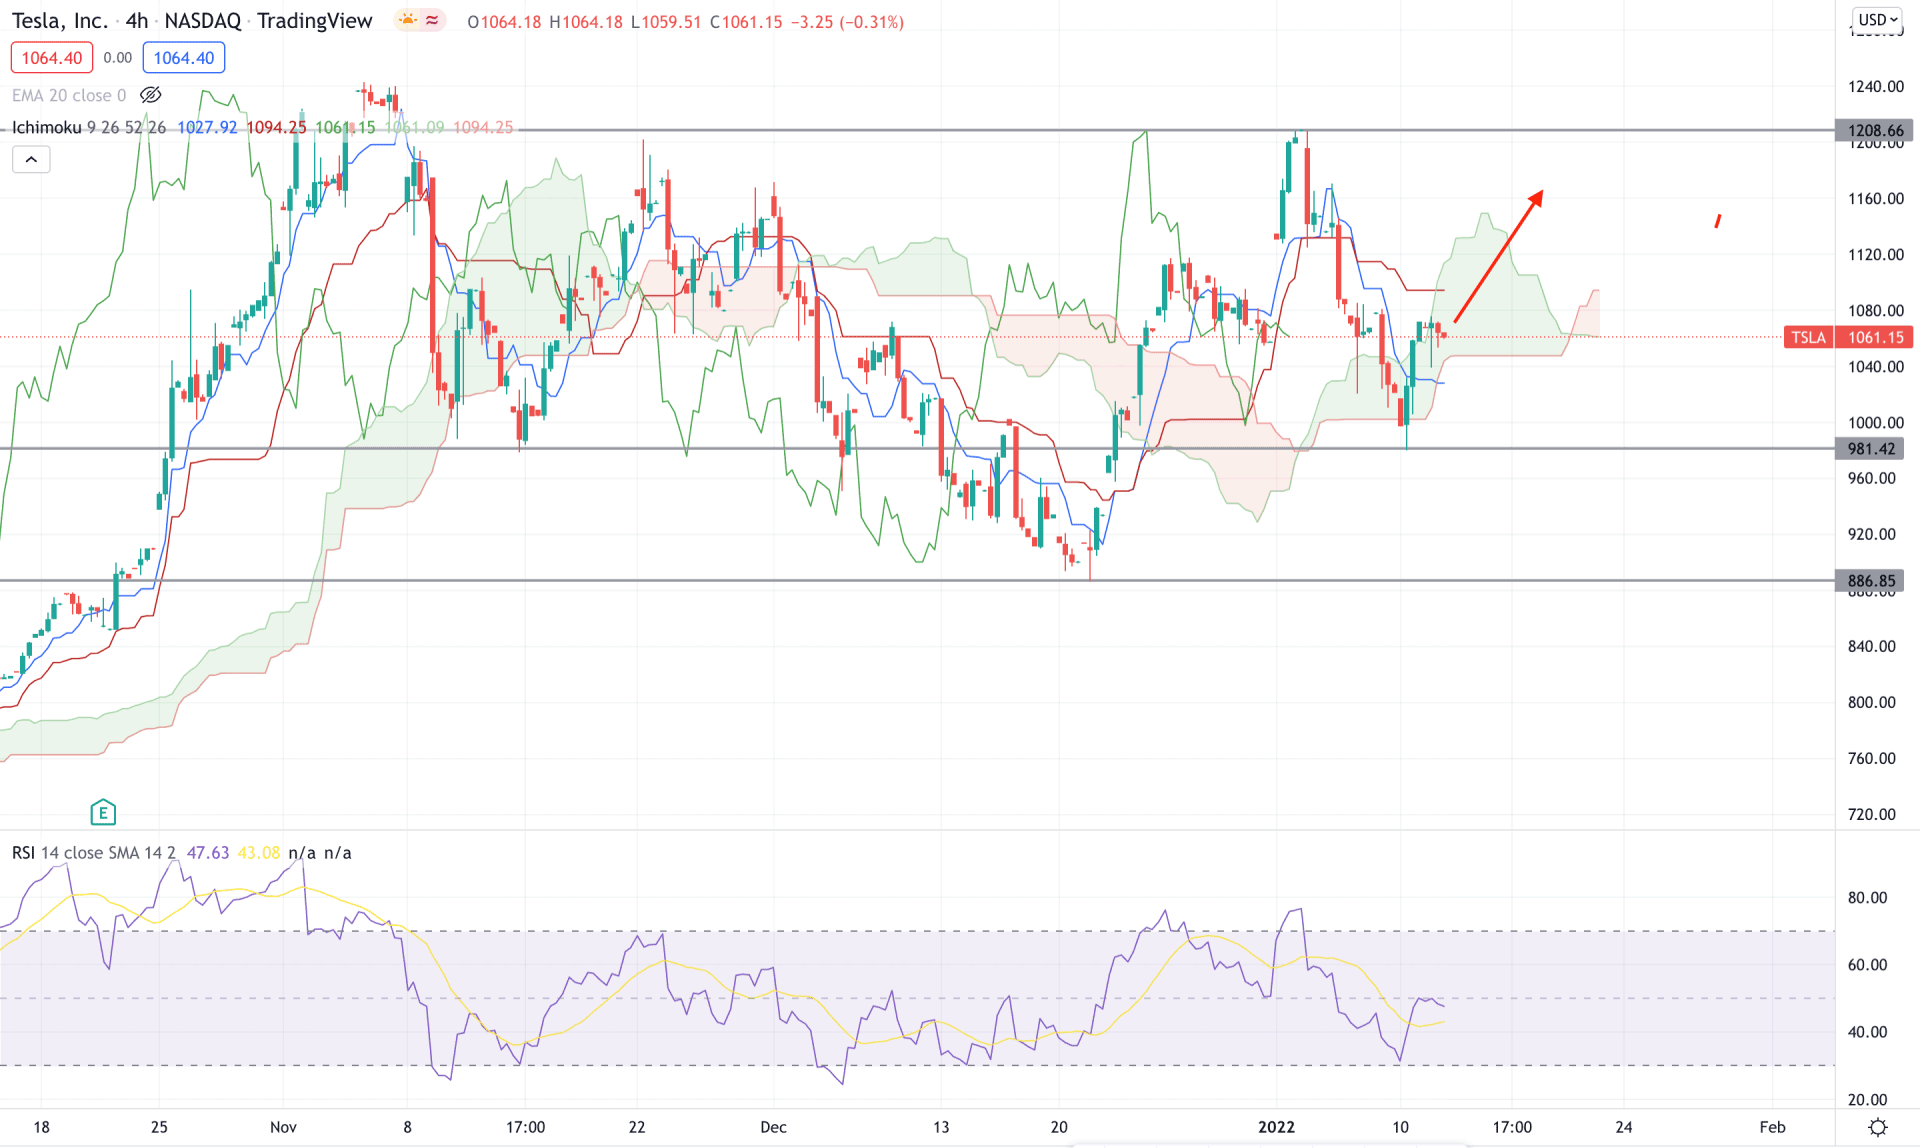
According to the Ichimoku Kinko Hyo, TSLA is trading within a corrective momentum while the future cloud is bullish. The Senkou Span A is above the Senkou Span B and aiming higher, which is the primary sign of the possible bullish pressure in the price. On the other hand, the Lagging Span is below the price and shows a corrective movement.
The above image shows that the RSI is nowhere but corrective at the 50 levels where a bullish breakout is needed to see to rely on the buying possibilities. On the other hand, the price is still within the Tenkan Sen and Kijun Sen where a bullish daily candle above these levels is needed.
Based on the H4 context, investors should see the TSLA price above the dynamic Tenkan Sen in the H4 chart to rely on the buying setup towards the 1208.66 swing high. On the other hand, a break below the 981.42 might increase the selling possibilities towards the 866.85 level.
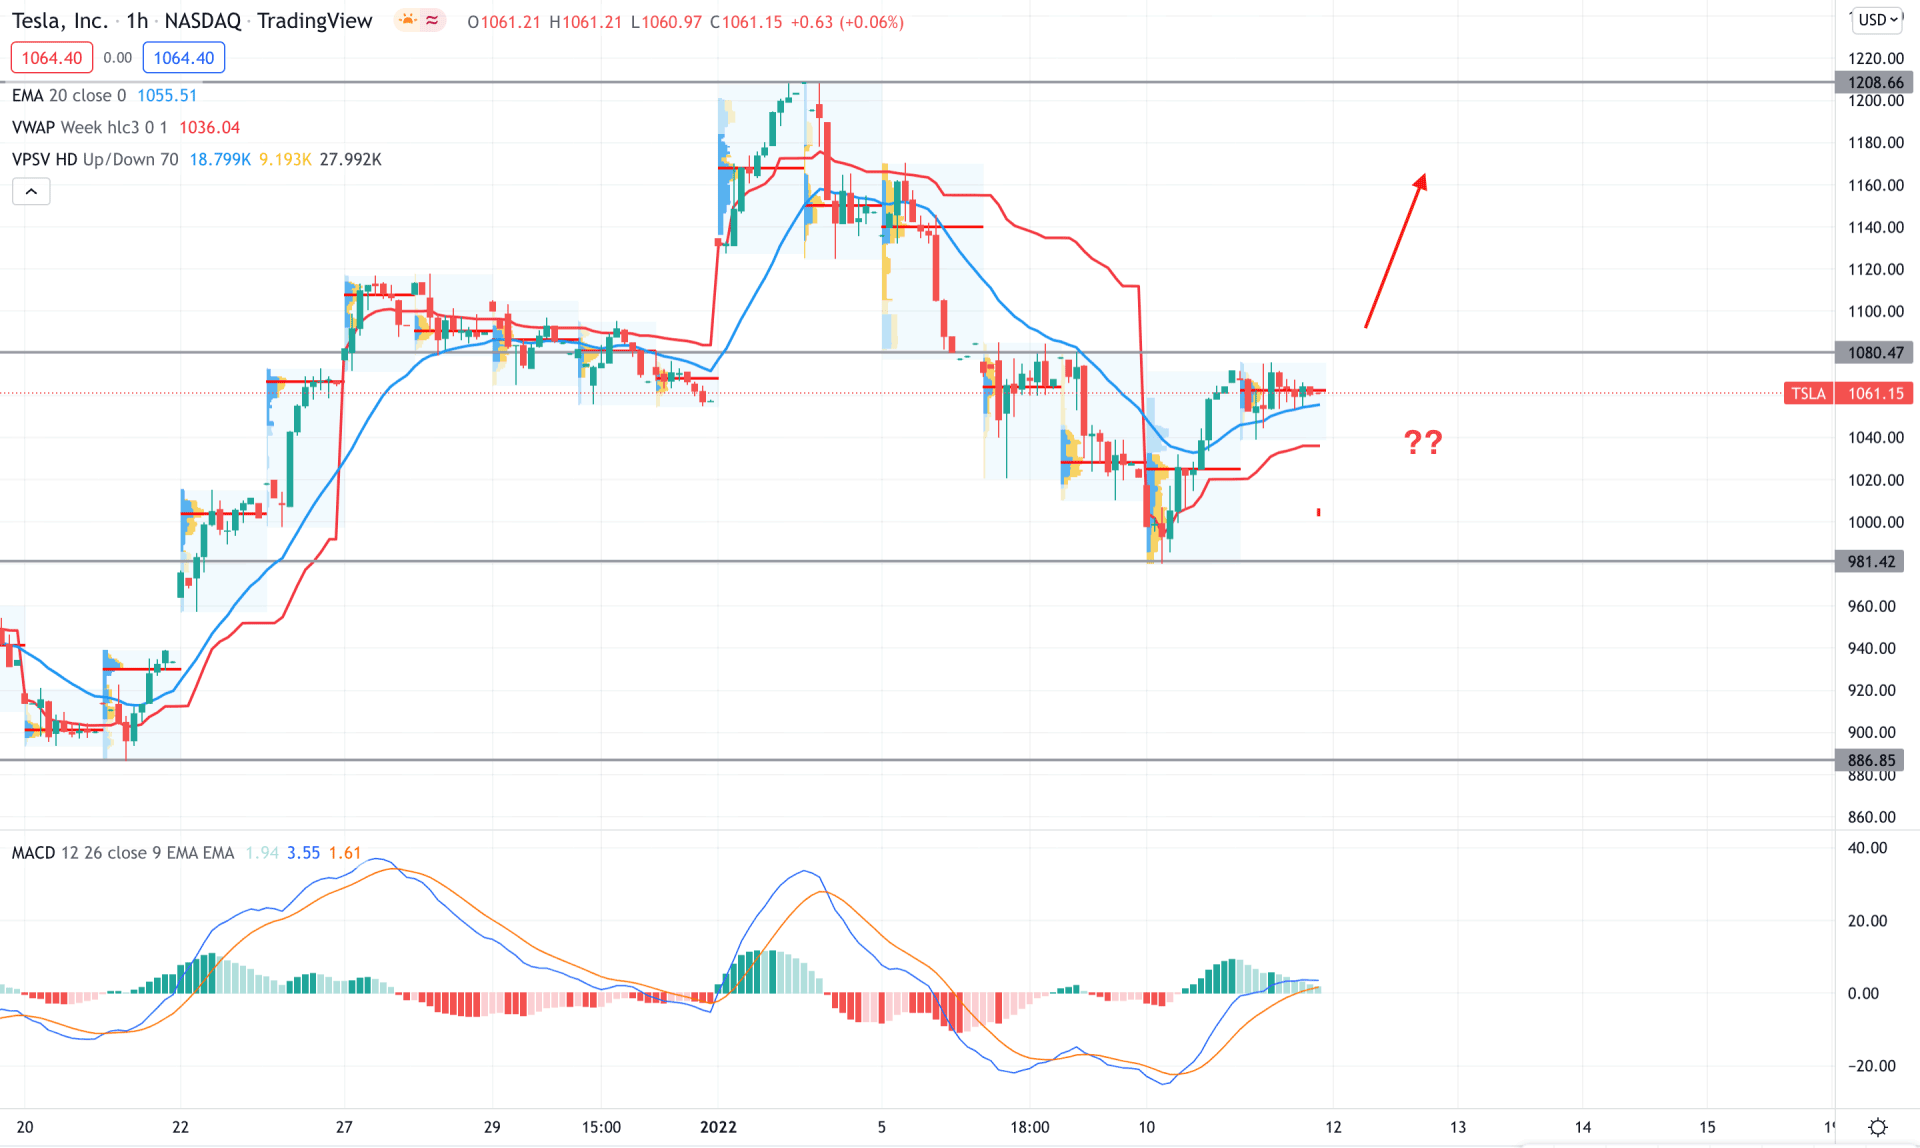
In the intraday chart, Tesla stock is trading within a bearish correction where the current bottom is at 981.42 level. Bulls showed an interest from this level by taking the price above dynamic 20 EMA and weekly VWAP with an H1 close. Therefore, as long as bulls hold the price above the dynamic VWAP, it has a higher possibility of extending the current buying pressure towards the 1208.00 area.
Based on the intraday volume, the current price is corrective at the 1062.50 level, which is the primary sign of the possible buying pressure in the price. A bullish h1 close above the 1080.47 would be a buying opportunity while a break below the 981.42 level may alter the current market structure.
According to the current observation, the broader market direction is bullish for Tesla stock where any buying opportunity from intraday swing levels has a higher possibility of winning. In that case, if the H4 price moves above the dynamic Tenkan Sen, the price may continue the bullish move above the current all-time high.


