
Published: April 21st, 2026
After a 2% decline in the previous session, Tesla, Inc. is under pressure ahead of its initial-quarter earnings announcement.
Despite increasing deliveries, Tesla's company-compiled expert estimate points to a similarly small earnings situation. Revenue of about $21.4 billion, operating revenue of $541 million, operating margin of 2.5%, and GAAP Profit of $0.16 are all anticipated. Additionally, analysts project negative free liquidity of $1.58 billion for the period.
In addition, the findings will be Tesla's first quarterly profit report since the company announced plans to stop producing its Model S sedan and Model X SUV to focus manufacturing capacity on Optimus human-like robots.
Due to production disruptions caused by last year's Model Y transition, Tesla delivered 358,023 automobiles in the first quarter, up from 336,681 units one year earlier. However, with 408,386 cars manufactured, the company's output exceeded shipments by over 50,000 units — the largest disparity in at least four years.
Tesla intends to spend over $20 billion this year, more than twice as much as last year ($8.5 billion). Rather than focusing on its typical EV portfolio, the majority of this investment will go through Cybercab production facilities, Optimus robots, batteries, lithium infrastructure, and AI initiatives.
After surrendering the wider worldwide EV sales title to BYD last year, Tesla reclaimed the lead in battery-electric delivery in the most recent quarter with 358,023 automobiles, in contrast to 310,389 for BYD's battery-electric lineup.
Let's see the upcoming price action from the TSLA price analysis:
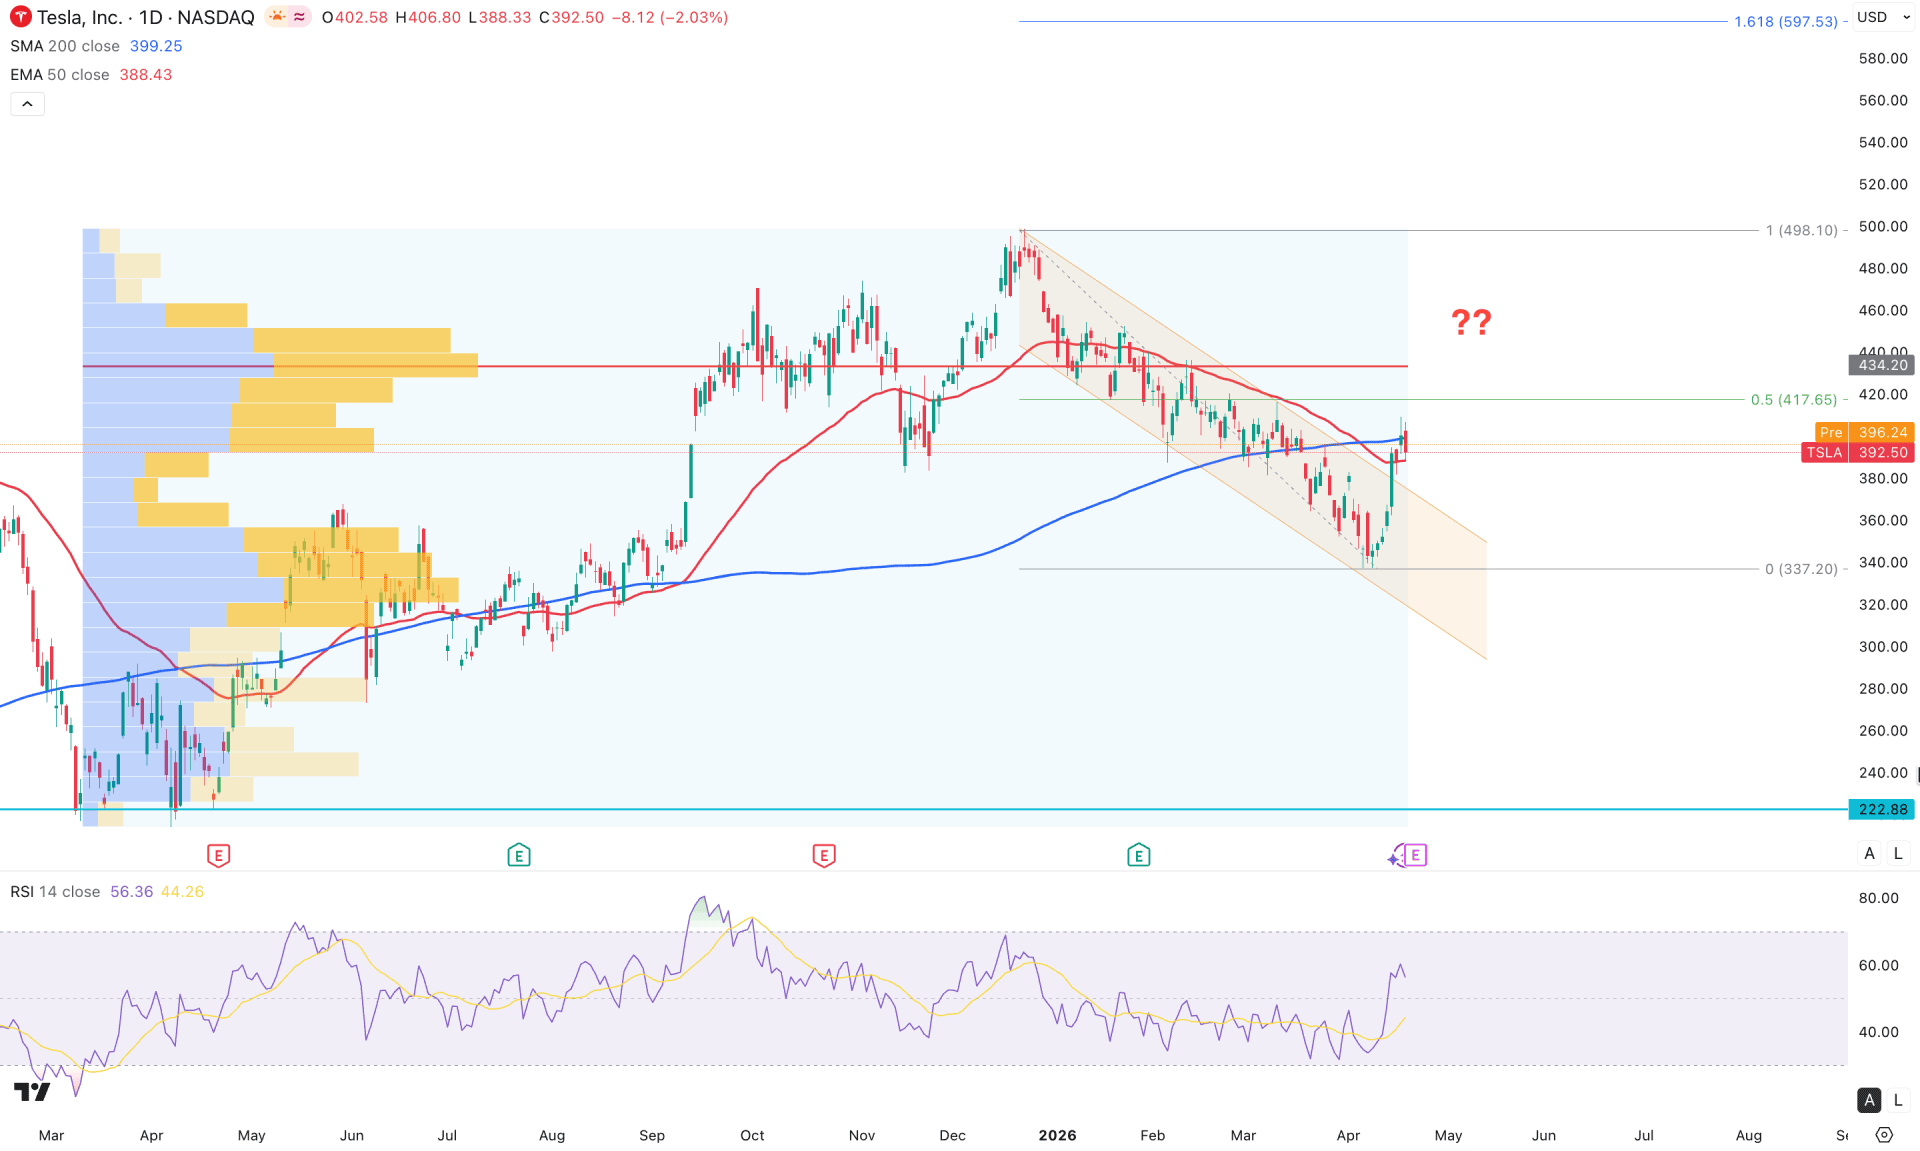
In the daily chart of TSLA, an extensive downside correction is visible as soon as the price reaches the 2024 high. An immediate downside move has come, taking the price 32% below to 337.20. Most of the existing downside pressure was within a descending channel, from which a bullish breakout is visible, indicating a channel breakout.
Looking at the higher timeframe, the price action remains bullish, as the current monthly candle is above the March 2026 high after three consecutive bearish phases. Moreover, the weekly price shows a decent bullish recovery with a strong breakout, taking it above the four-month high on a valid weekly close. As the current price is hovering above the existing swing high, the ongoing momentum may remain bullish.
As per the volume structure, the recent bullish recovery from the 337.20 bottom came with higher volume activity compared to the price action over the last three months. However, the most active level since March 2025 is at 434.20, which is still above the current price. Primarily, overcoming this high-volume level would be a challenging factor for buyers, but a successful breakout could initiate a bullish impulsive wave at any time.
In the main price chart, the recent bullish recovery is facing strong resistance from the 200-day SMA. More about the 50 EMA, it is just below the current price, but both dynamic lines are close together. The current price action within these crucial dynamic lines signals a possible breakout or indecision, which needs more clues before anticipating a valid market trend.
The Relative Strength Index is working as an additional confirmation for buyers, as the current line is hovering around the 50.00 level with more room to grow towards the 70.00 overbought level. The Average Directional Index also maintains momentum above the 20.00 level, signaling a decent trend formation opportunity.
Based on the overall market structure, TSLA's recent bullish breakout from the descending channel is valid, as it came with strong momentum supported by higher volume. However, a minor correction is pending to validate the breakout, where the existing resistance has now become support. Investors should closely monitor how the price trades around the 200-day SMA, as a failure to hold above it could increase the risk of a fakeout. In that case, a daily close below the current channel resistance could resume the existing downside trend, targeting the 300.00 psychological level.
On the other hand, a minor bullish recovery from the 50-day EMA with a stable price above the 200 SMA could increase the possibility of bullish continuation. Moreover, overcoming the 434.20 high-volume level could be another achievement for bulls, as it could open room to take the price beyond the 500.00 psychological level. In both cases, the 498.10 swing high could be a crucial resistance to watch, as a break above this level could open the room for reaching the 597.53 Fibonacci extension level.
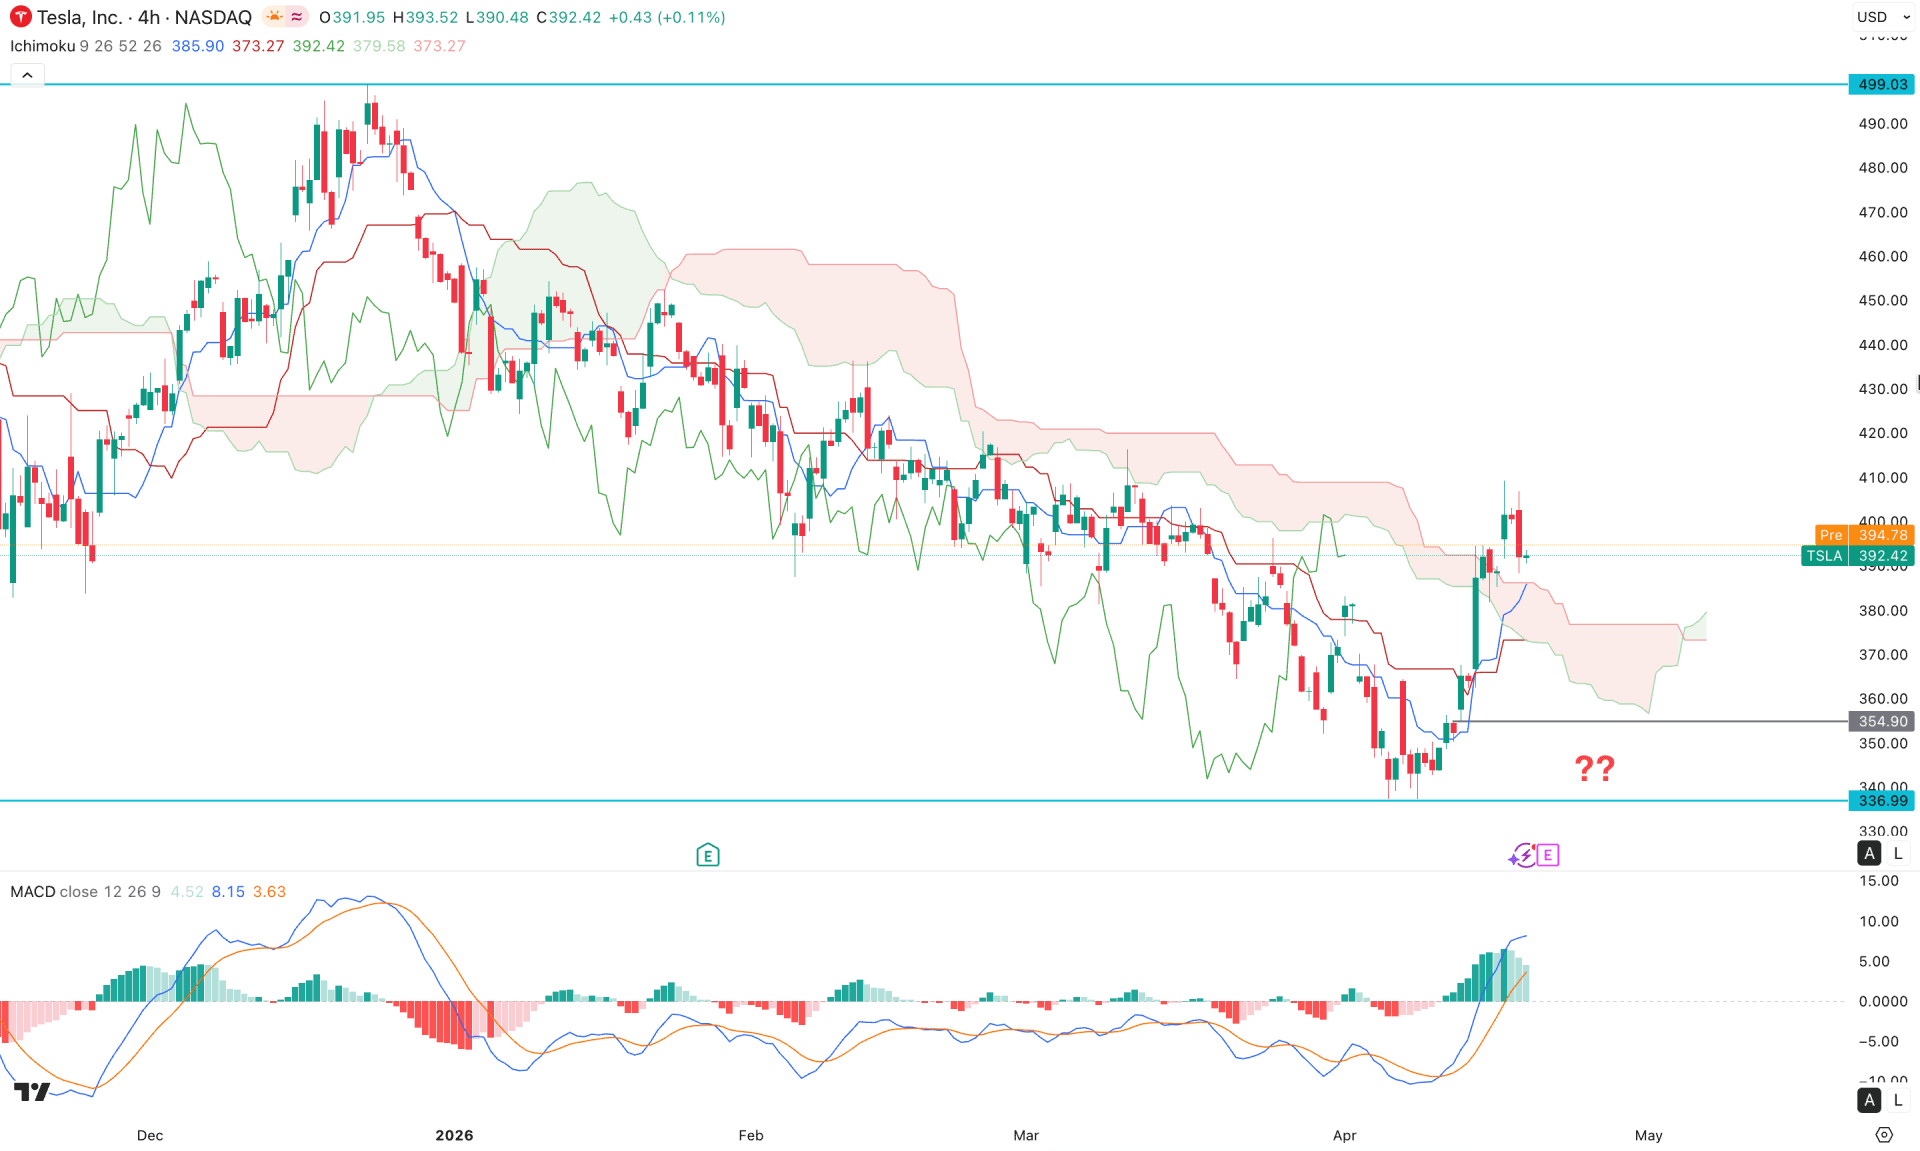
In the four-hour timeframe, TSLA price is showing a bullish breakout with a four-hour close above the cloud support. The bullish four-hour candle has come above the cloud area for the first time in 2026. As it is the primary bullish attempt, it needs more confirmation before confirming the trend change.
In the future cloud, the dynamic lines have flipped position, and support levels are now below the current price.
The Ichimoku components are on the buyers' side, but additional confirmation is still needed from the price action. The MACD histogram is losing bullish momentum even though it remains stable above the neutral level. Moreover, the signal line has likely found a peak and started to move flat near the upper area.
Based on this outlook, the price has a higher possibility of forming a decent downside correction, where the dynamic Kijun level would act as immediate support. However, failure to hold the price above the 354.90 support level could invalidate the bullish structure at any time.
On the other hand, a sideways market above the cloud area or a bullish reversal from near the cloud support could increase the bullish possibility, targeting the 460.00 area.
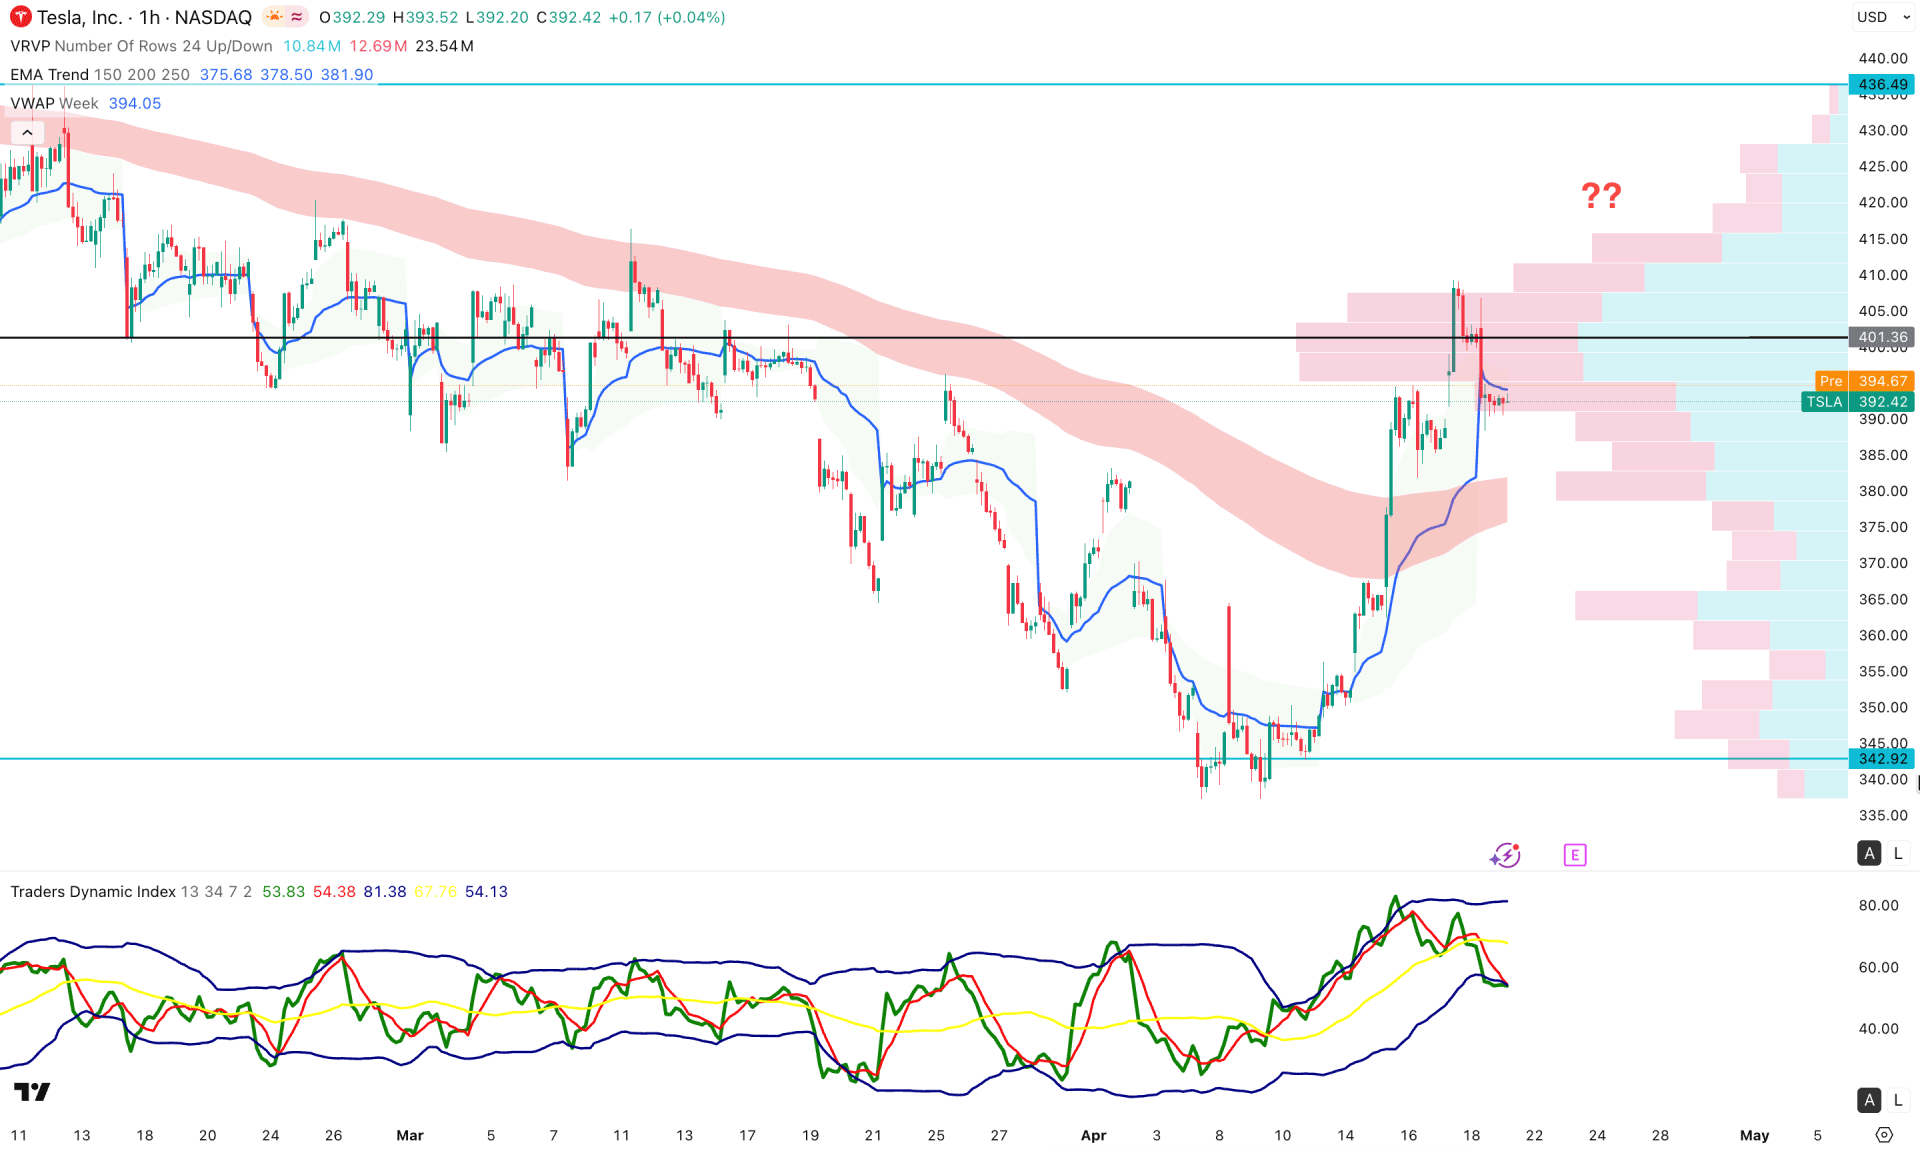
In the hourly timeframe, the TSLA price is trading within a bullish intraday pressure, with the most recent price reaching the session high and exhibiting impulsive momentum.
As a result, the price found resistance at the intraday high-volume line, suggesting pressure on the bulls. However, the weekly VWAP line and EMA wave are below the current price, working as strong supports.
In the indicator window, the Traders Dynamic Index (TDI) rebounded from the upper peak and is now hovering below the 50.00 neutral line.
Based on the current market outlook, the price is likely to move lower as part of a mean-reversion. Immediate support is at the 370.00 level, which could be tested in the coming hours.
Tesla stock (TSLA) is experiencing minor buying pressure amid the broader market trend. It is the primary sign of a bullish trend continuation, which needs more confirmation from the price action. Investors should closely monitor the intraday price as a valid bullish rebound from the near-term support could offer an early long opportunity.


