
Published: July 22nd, 2025
Following the bell on July 23, 2025, Tesla TSLA will release its second-quarter earnings. As consecutive deliveries declined and high prices continued to impact, Wall Street predicted an adjusted earnings per share of $0.39 on sales of $22.22 billion, representing a 25% decrease in earnings and a 13% decrease in sales from a year ago. The stock has lost approximately a third of its December increase and is now 16% lower year-to-date, trailing the S&P 500.
Despite lower delivery, retail investors continue to favour the shares. They will concentrate on a schedule for the long-promised low-cost method, the rate of the Full Self-Driving implementation, and insights from the Austin robotaxi pilot.
Despite fresh rewards squeezing average selling prices, investors will also be watching to see if the automotive gross margin, which was predicted to drop from 18% one year ago, stabilises and how escalating tariffs affect the bottom line. Federal EV tax credits will no longer be available under the recently approved Inflation Reduction Act, which would further strain U.S. demand and reduce regulatory-credit income.
Elon Musk, the CEO, is expected to draw criticism for his public support of Donald Trump, his subsequent feud with him, and his recent creation of his political organisation.
On the positive side, Energy storage and generation still account for a small portion of sales, but they are expanding rapidly. Research showed that momentum is still present and will be sought after by investors. In the meantime, options traders are anticipating a 7% price surge, emphasizing any engaging news on AI and profit margin.
Let's see the further aspect of this stock from the TSLA technical analysis:
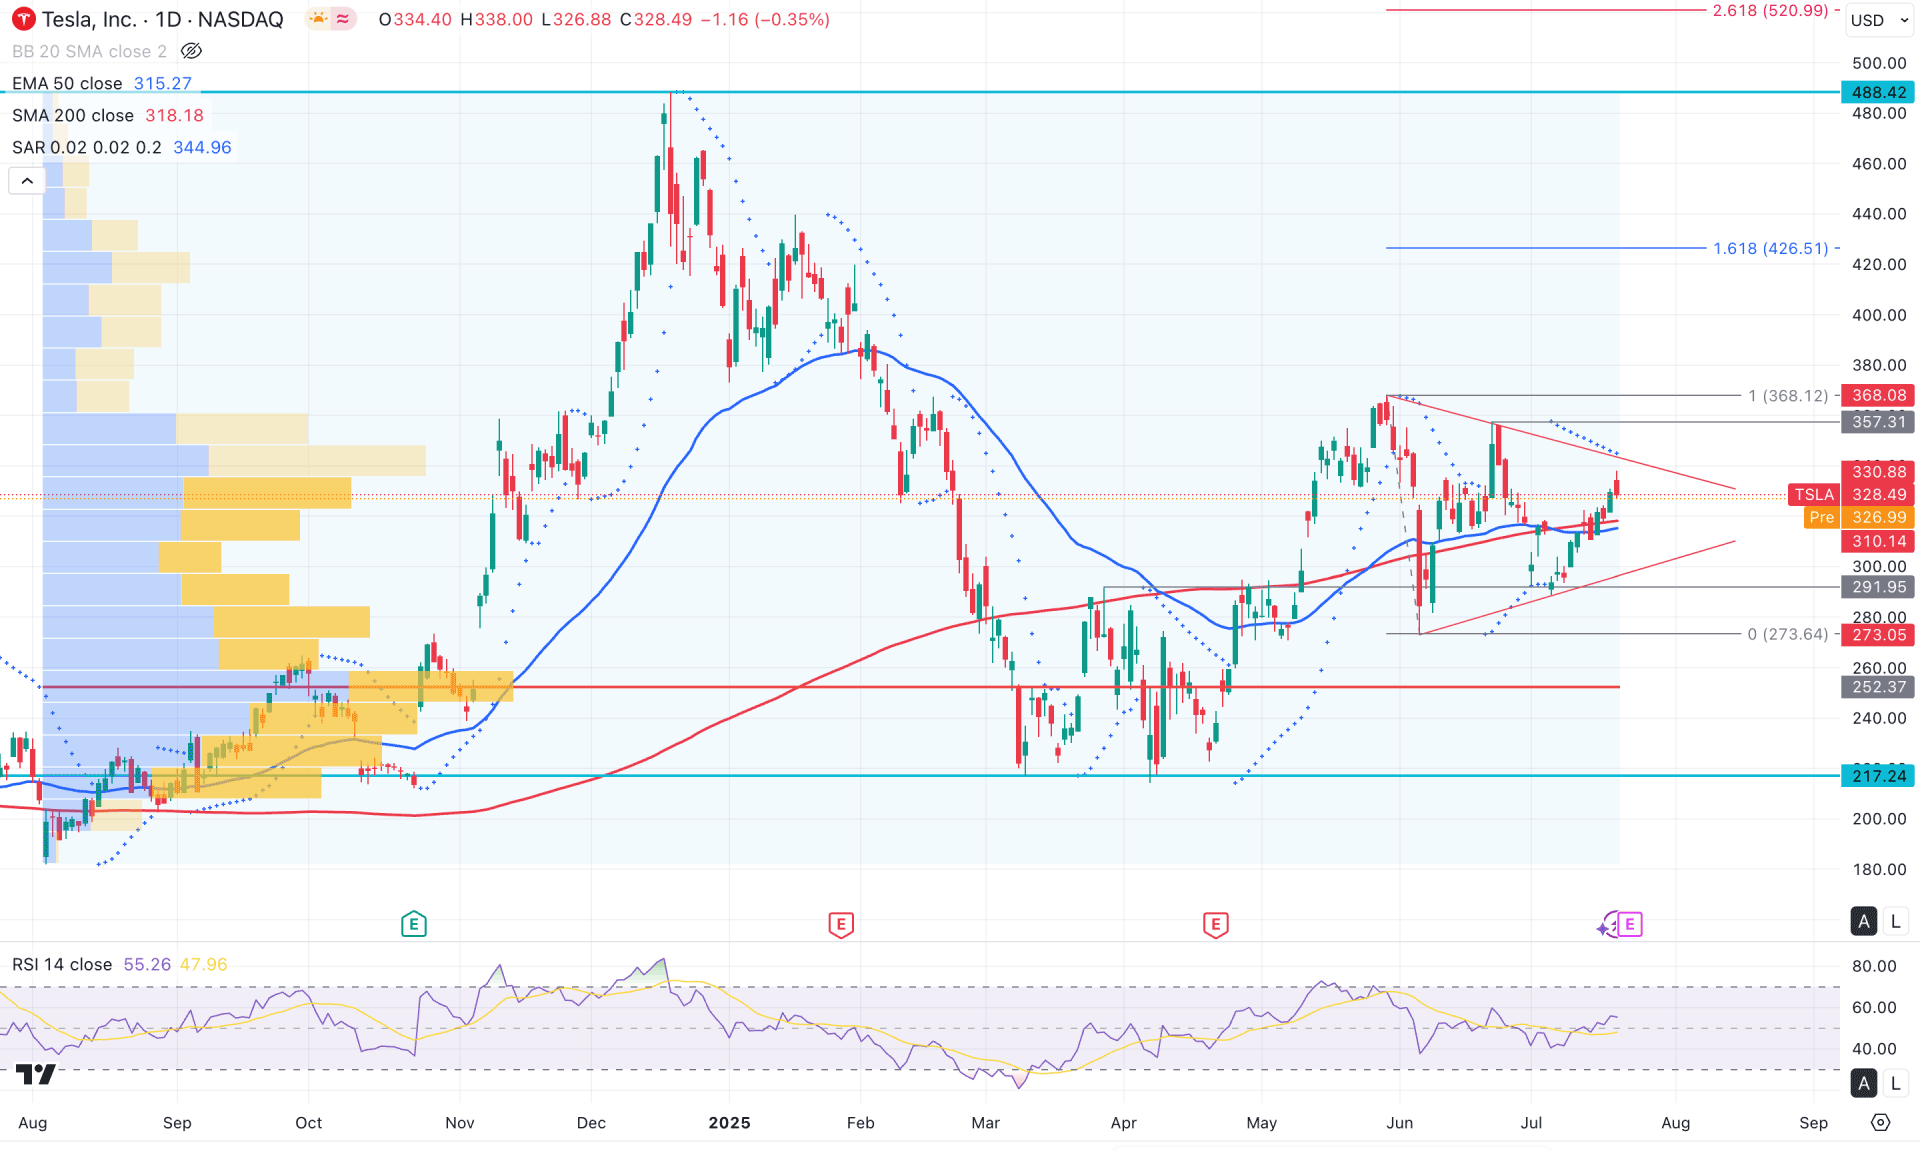
In the daily chart of Tesla stock, the recent price found a bottom at the 207.24 level before entering a consolidation phase. The bottom appears validated by a strong bullish rebound, clearly breaking above the 291.95 swing high level, with the price holding steadily above it. In the near-term price action, the market momentum remains sideways, from where a bullish breakout could resume the prevailing trend in the coming days.
In terms of volume structure, the broader market context remains bullish, as the highest activity level since August 2024 is located at the 252.37 level, well below the current price. This indicates institutional sentiment is bullish as long as the price action stays above this high-volume area. In that case, any minor dip on the intraday chart could present a long opportunity.
Additionally, the broader bullish outlook is supported by the 200-day SM. Both the 200-day SMA and the 50-day exponential moving average are positioned below the current price, suggesting that investors may consider both the short-term and long-term trends as bullish.
However, the price is currently facing minor resistance within a symmetrical triangle. Multiple Parabolic SAR indicators are acting as barriers above the triangle resistance, which must be breached to confirm a bullish continuation.
In the indicator window, the Relative Strength Index (RSI) remains bullish, recently holding above the 50.00 level. However, the strength of the trend is not yet convincing, as the Average Directional Index (ADX) remains below the 25.00 threshold.
Based on the overall market outlook, a bullish breakout above the 357.31 level, followed by consolidation, could offer a long-term bullish opportunity in Tesla stock. In that scenario, investors should closely monitor how the price reacts at the triangle resistance. A strong breakout accompanied by the ADX rising above the 20.00 mark is needed to confirm a valid long signal.
On the other hand, failing to hold above the 50-day EMA could pose a challenge for the bulls. In that case, a minor downward correction toward the 291.95 swing low is possible. However, sustained selling pressure below the 252.37 level could further challenge bullish momentum, potentially extending losses toward new support near the 175.00 area.
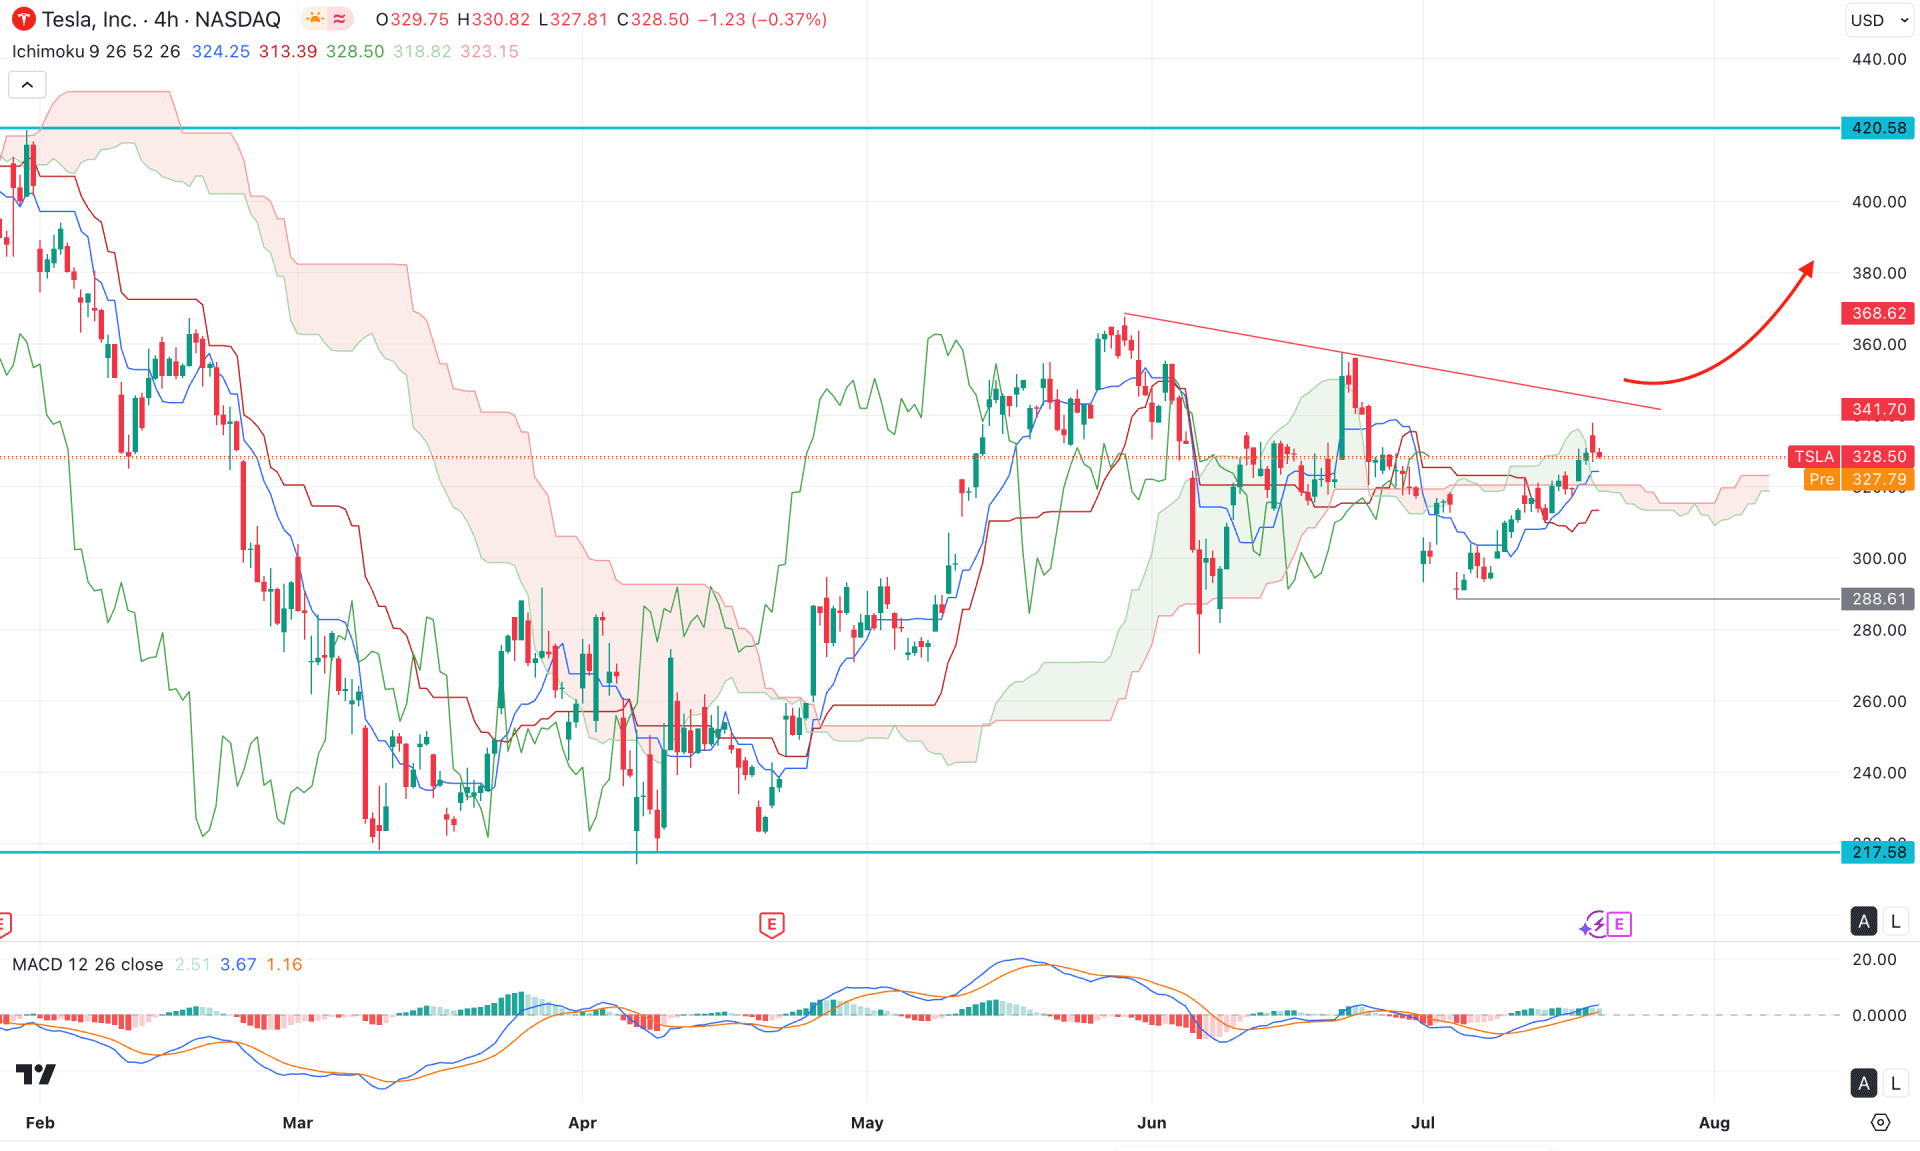
In the four-hour timeframe, the recent price action is showing consolidation, with multiple violations observed around the Ichimoku Cloud area. As the most recent candles are trading above the cloud support, investors should monitor whether the price can sustain momentum above this level. Although the future cloud appears mixed with no clear directional bias from the Senkou Span area, a bullish crossover is visible among the dynamic lines. Additionally, several consecutive bullish four-hour candles have formed above the Kijun-sen line, indicating potential upside strength.
In the secondary indicator window, the market remains bullish, with multiple positive histograms visible on the MACD indicator. Moreover, the signal line has formed a bottom and rebounded above the neutral area, suggesting a possible continuation of the bullish trend.
Based on the current market structure, investors should closely monitor how the price holds above the dynamic support zone. A bullish breakout above the cloud’s trailing line resistance, confirmed by a four-hour candle closing above the 360.00 level, could signal a potential long opportunity with a target toward 440.00.
On the other hand, extended selling pressure may lead the price toward 327.79 or 300.00. A break below the 288.61 support level could invalidate the bullish outlook and open the door for a deeper correction toward the 277.58 support zone.
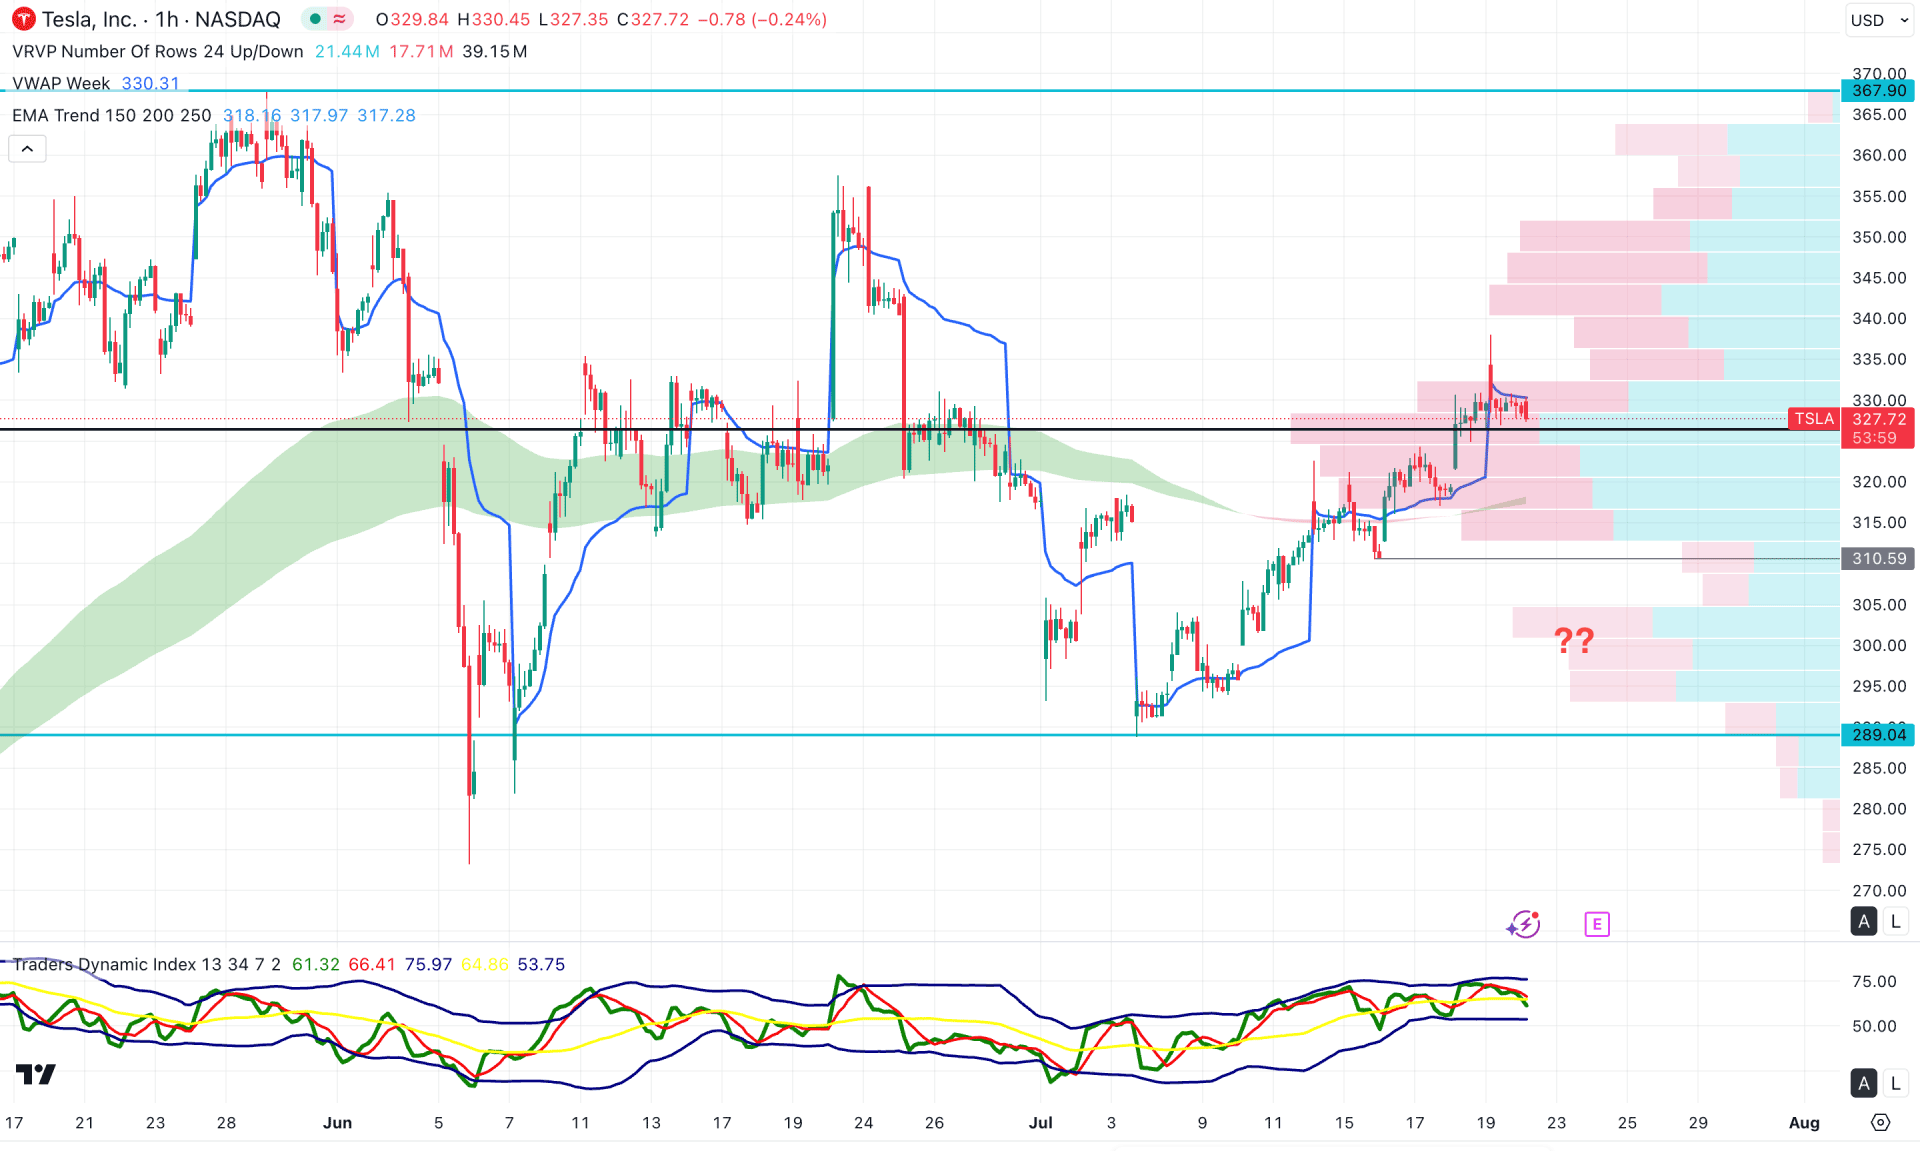
In the daily timeframe, Tesla stock is trading sideways, with the high-volume line positioned just below the current price. Although a rising moving average structure supports bullish pressure, the Ichimoku Cloud lacks sufficient thickness to confirm a strong bullish continuation. Additionally, the weekly VWAP level is acting as resistance within a rectangle pattern.
In the secondary indicator window, downside pressure is evident as the Traders Dynamic Index (TDI) formed a bullish peak before moving back below the 60.00 level.
In this context, a bullish continuation may require a sufficient correction before targeting the 367.90 level. On the downside, immediate support lies at 310.59, which could act as a strong liquidity zone. Any bullish reversal from the 320.00–330.00 area could provide a high-probability long opportunity targeting 367.90.
However, failure to hold the price above the moving average zone, with a strong bearish reversal below the 289.04 level, could invalidate the bullish scenario and push the price down toward the 250.00 area.
Based on the broader market structure, Tesla appears to be trading within a bullish pre-breakout formation, but further confirmation is needed before adopting a long bias. As the price is currently confined within a symmetrical triangle pattern, a bullish breakout followed by consolidation above the triangle resistance could signal a valid long opportunity aligned with the major market trend.


