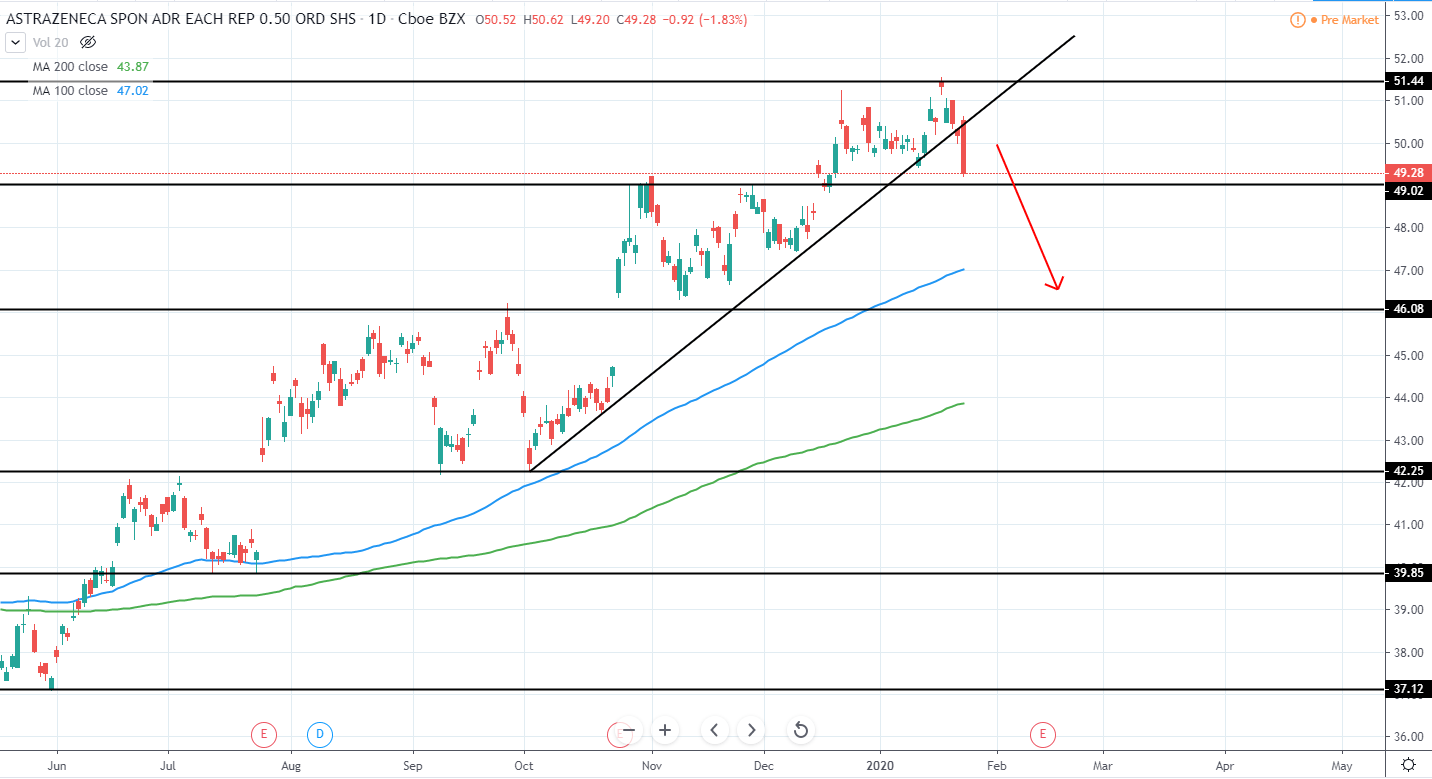
AstraZeneca plc. (AZN) currently has a Market Cap of 129.6B USD and trades around 49.28 USD as it peaked around 51.44 USD and retraced back to the downside with a break of several month ascending trend line of support.
Additionally, previous local swing low was broken and we can expect a substantial retracement in the upcoming weeks as the price looks to retest next support around 46 USD. Therefore, for now, it is best to remain neutral and wait for further price action development.
AZN Daily:
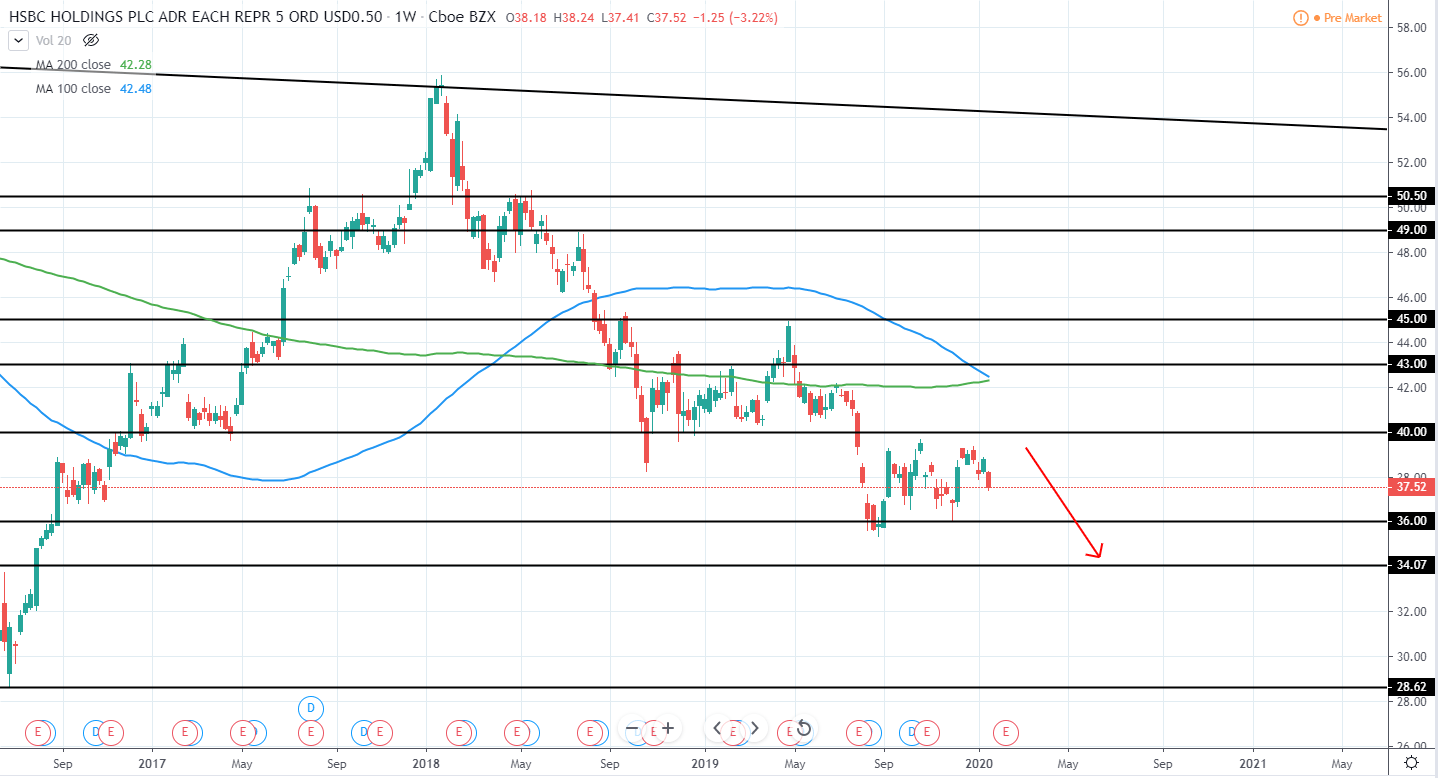
HSBC Holdings plc. (HSBC) currently has a Market Cap of 152.16B USD and trades around 37.52 USD as it continues consolidating around 36-40 USD area after setting a new lower low and retracing back towards 40 USD previous support that now acts as a resistance.
Therefore, a short position can be taken once the price retests range high once again in the expectation that eventually a new lower low will be made towards the next support area around 34 USD. For now, however, best it to remain neutral and wait for further price action development.
HSBC Weekly:
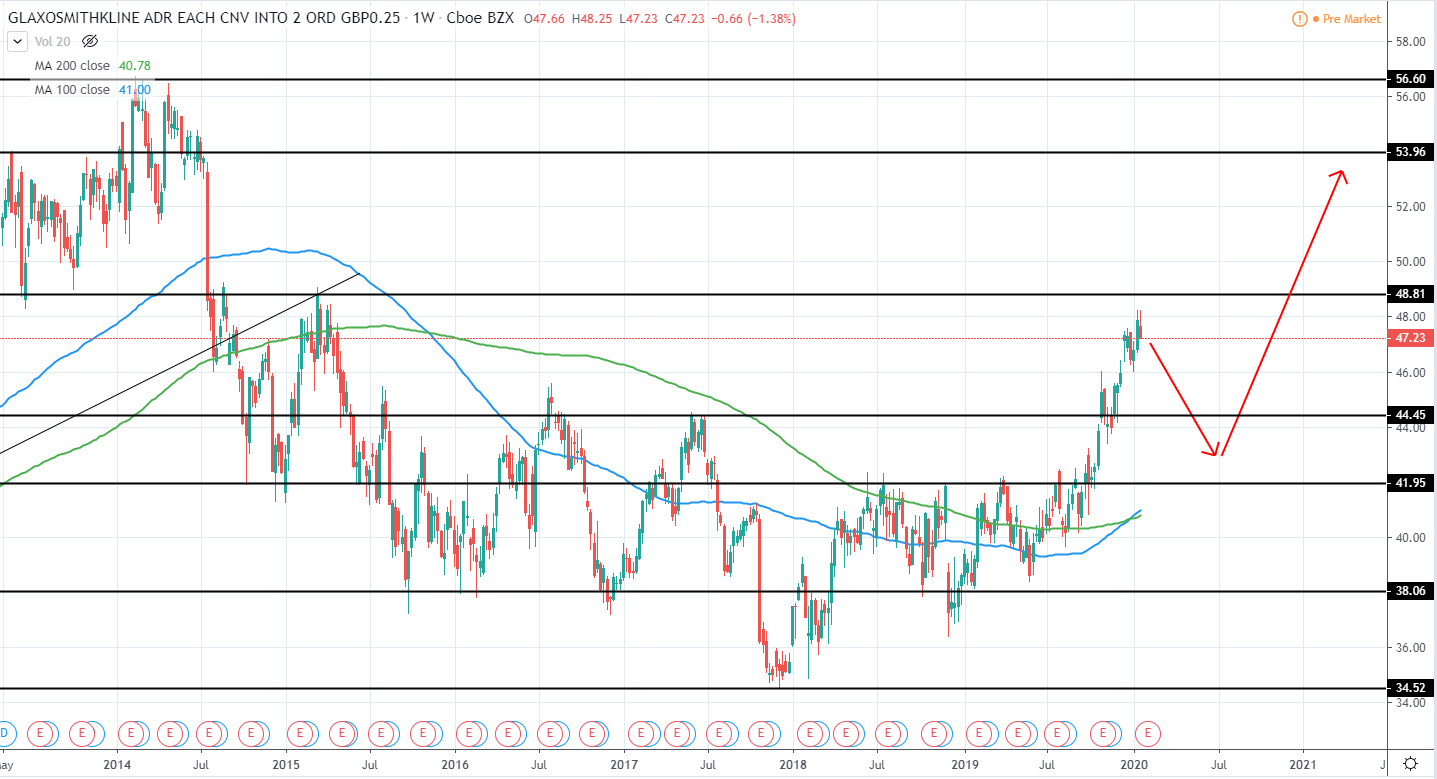
GlaxoSmithKline plc. (GSK) currently has a Market Cap of 118B USD and trades around 47.23 USD as it moved towards the next resistance around 48.8 USD for the past months in an attempt to reverse the several year bearish momentum, however, has extended too far from the previous swing low to consider entering a long position.
Therefore, it is best to stay neutral and wait for a retracement towards previous resistance area around 42-44.5 USD that now will likely act as a support.
GSK Weekly:
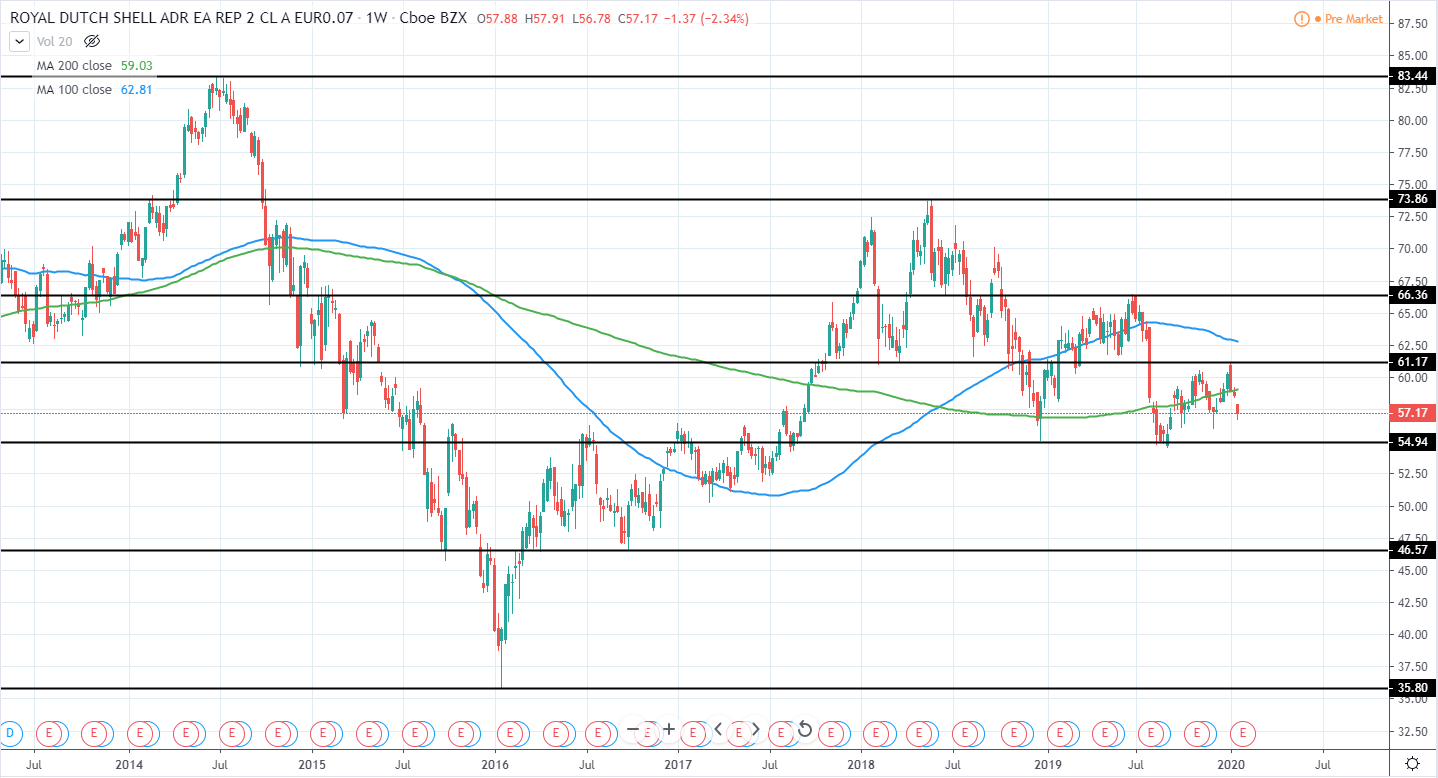
Royal Dutch Shell plc. (RDS.A) currently has a Market Cap of 224.63B USD and trades around 57.17 USD as it continues moving in an increasingly tighter range with both higher lows and lower highs.
Current major support can be seen around 55 USD, while the resistance around 61.17 USD. Until a clear break either above or below this range is seen, it is best to remain neutral and wait for further price action development.
RDS.A Weekly:
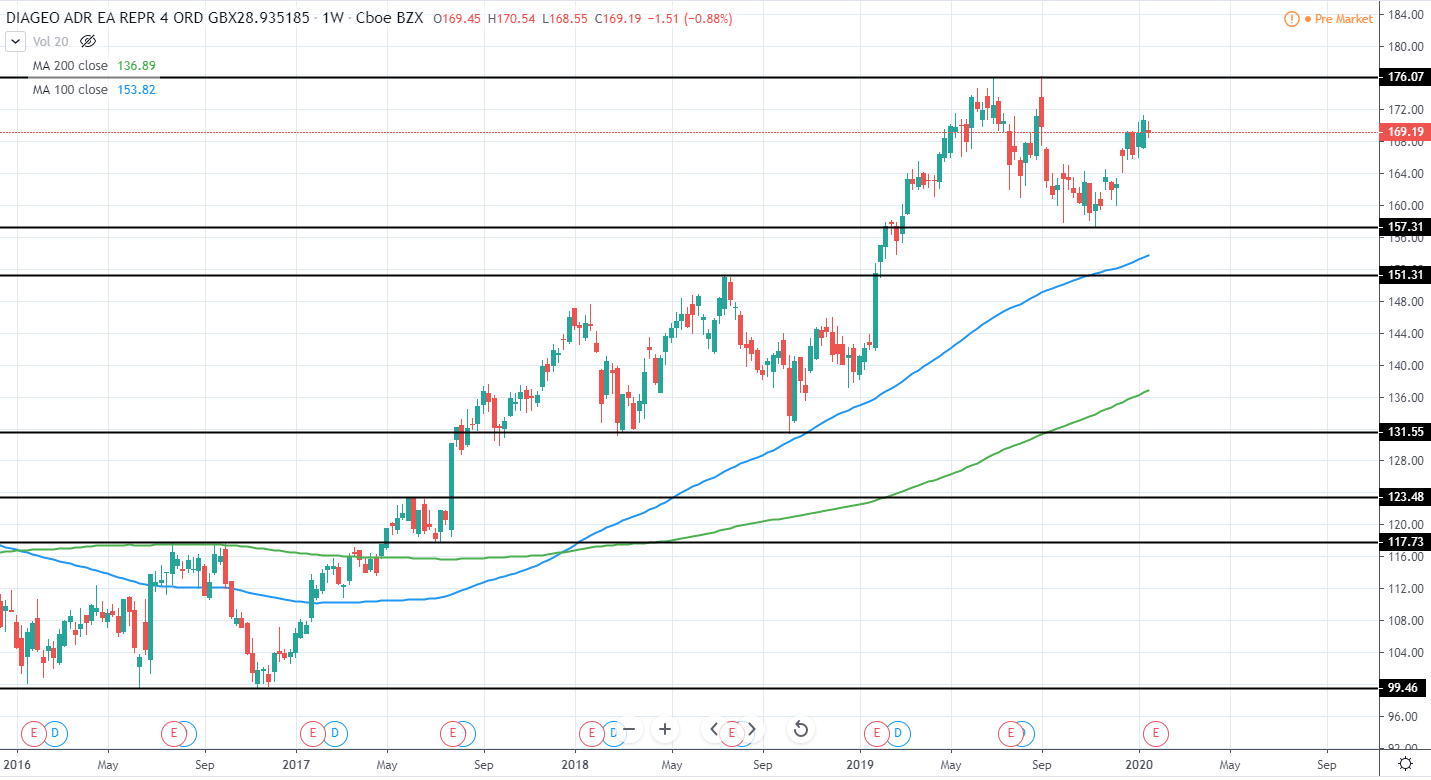
Diageo plc. (DEO) currently has a Market Cap of 99B USD and trades around 169.19 USD as it continues trading in a very strong bullish momentum for the past years and recently retraced towards 157.3 USD and set a clear new higher low, indicating a continuation of bullish momentum.
Currently, however, the price has moved higher significantly once again from the low and a slight retracement is needed to enter a long position once again with optimal risk/reward. Therefore, it is best to stay neutral and wait for further price action development.
DEO Weekly:
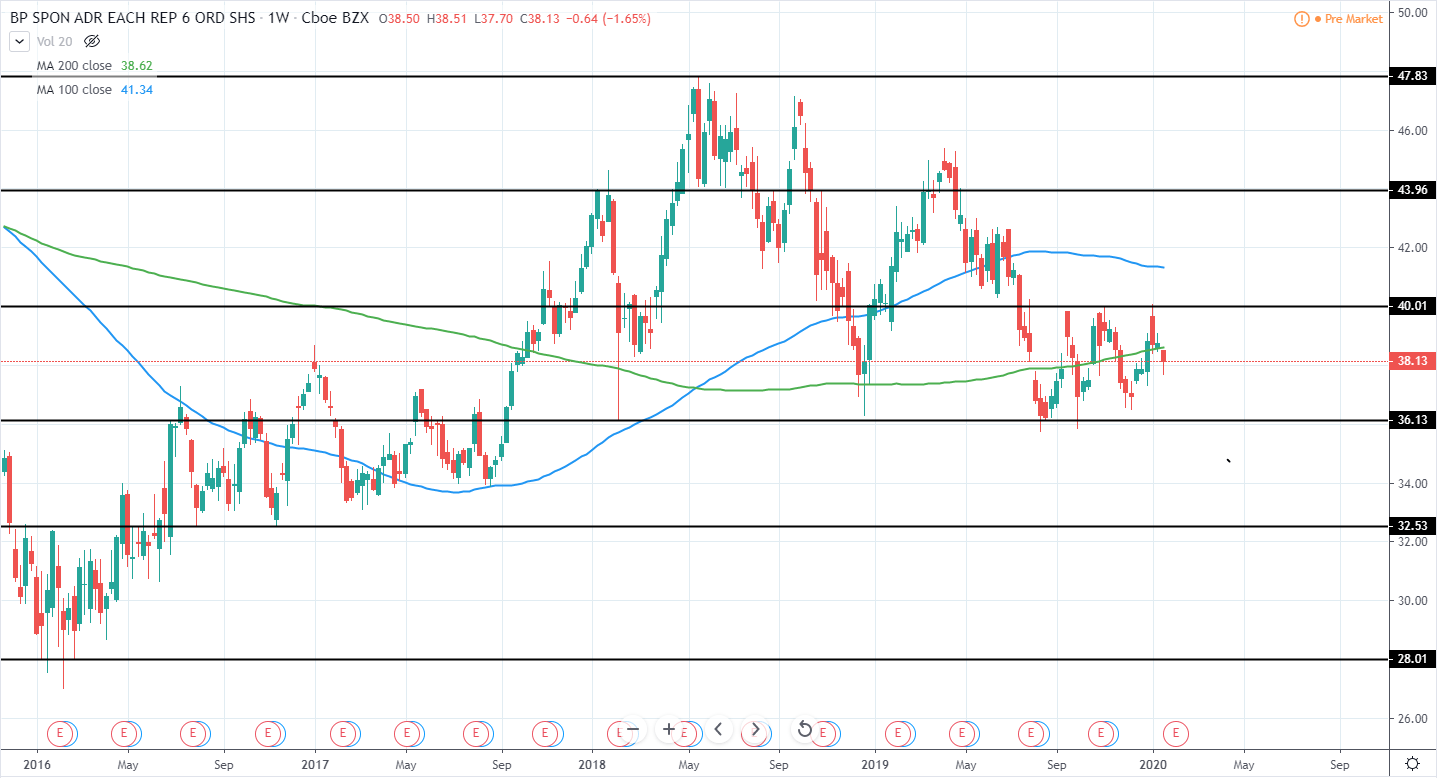
BP plc. (BP) currently has a Market Cap of 128.26B USD and trades around 38.13USD as it continues consolidating in an increasingly tighter range with 36.1 USD level acting as a support and 40 USD level as a resistance after several lower highs were set during the past years.
Therefore, until a break to either side is seen, there is no clear trend and the best option would be to stay neutral and wait for further price action development.
BP Weekly:
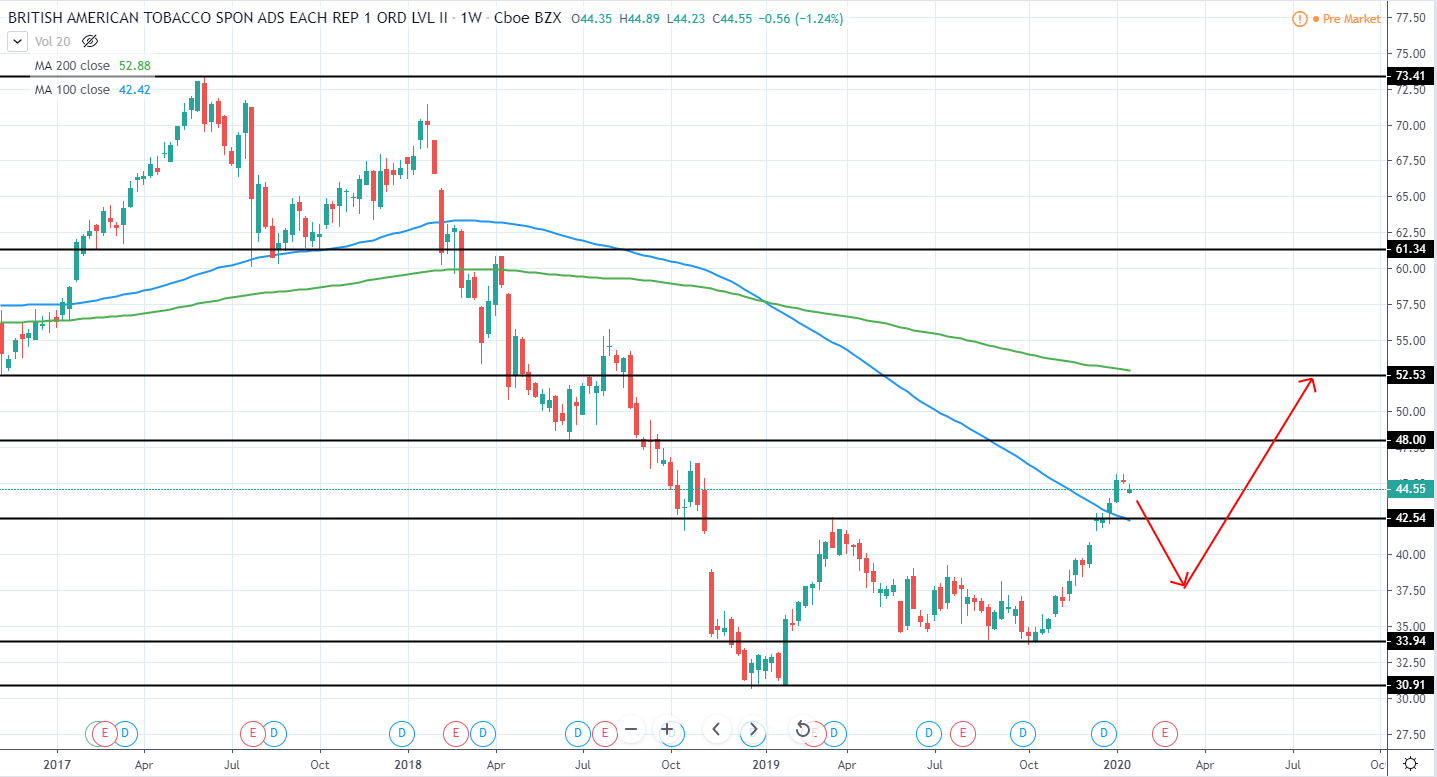
British American Tobacco plc. (BTI) currently has a Market Cap of 102.329B USD and trades around 44.55USD as it has set a new higher high during the bullish momentum that was seen in the past months and looks to reverse back to the upside after a very bearish 2018.
Therefore, once the current upswing retraces and sets another higher low, preferably, not close to the previous one around 33.94 USD, a long position can be made in the expectation that the next resistance around 52.5 USD will be reached in the following months.
BTI Weekly:
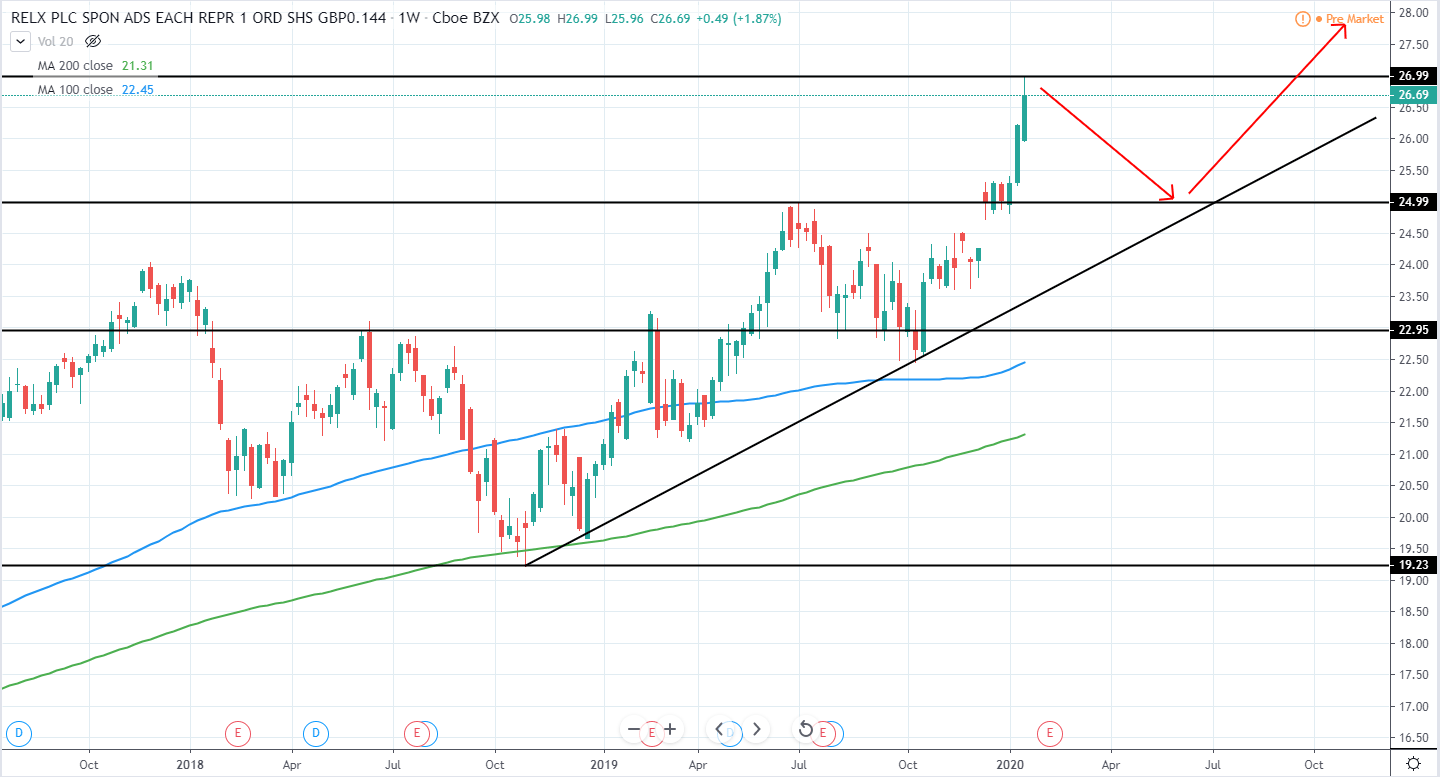
RELX plc. (RELX) currently has a Market Cap of 52B USD and trades around 26.69USD as it continues setting new all-time highs for the past weeks after breaking above previous high around 25 USD.
Since the current bullish momentum has extended quite far away from the previous low, we expect a retracement to be seen in the upcoming months towards previous resistance, turned support around 25 USD as well as towards a yearlong ascending support trend line that is yet to be confirmed with a third touch. Once this area is tested, a long position can be made in the expectation that a new all-time high will be made in the following weeks.
RELX Weekly: