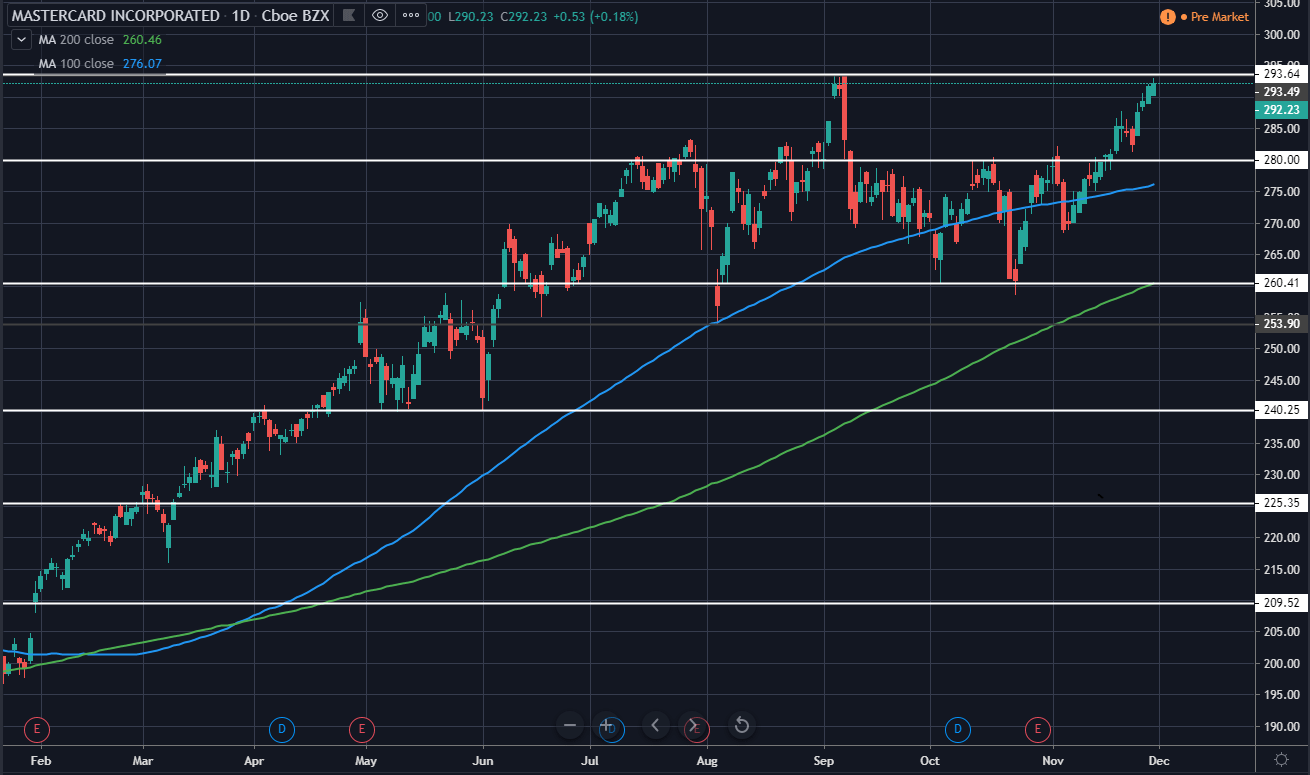
Mastercard Incorporated (MA) currently has a market Cap 294B USD and trades around 292 USD as it looks to set a new all-time high above 293.64 USD previous one that was set at the beginning of September. The overall trend is very bullish as the price has increased 70.74 USD from the previous major low of 171.89 USD that was set at the end of 2018 after a strong retracement of around 23.72% was made during 12 weeks of bearish price action.
Currently, a breakout trade could be made once the price moves above 293.64 USD high, however, it would not provide the best risk/reward setup and therefore it would be best to wait for another retracement before entering long position. Potential support can be currently seen around 280 USD as well as 100 week moving average blue line around 176 USD, however, if reached as of now would indicate a slowdown on the major trend.
Therefore, the best option would be to see a clear break above the current high and subsequent retracement towards 293 USD level as resistance turned support.
MA Daily:
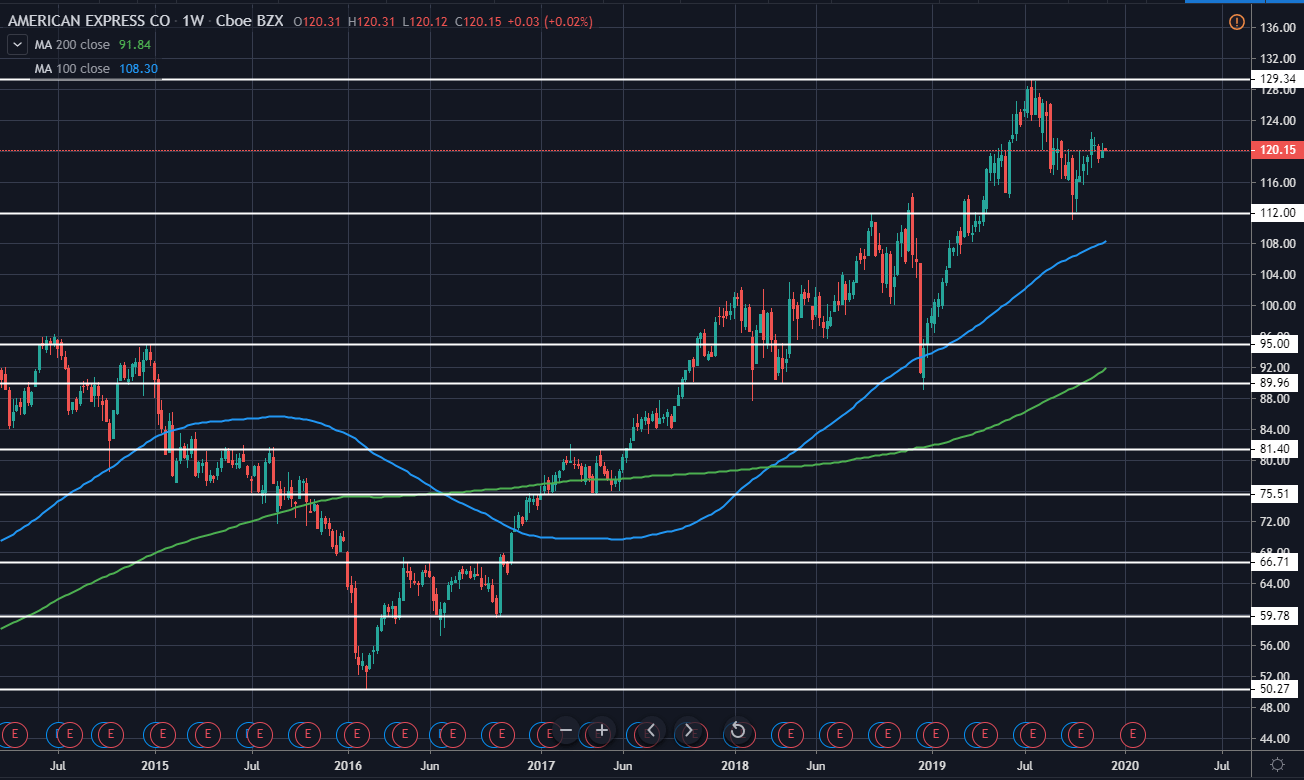
American Express Company (AXP) currently has a market cap of 98.3B USD and trades around 120.12 USD as it looks to move higher after a slight retracement towards 112 USD support that was quickly rejected back to the upside and indicates that we will likely see further upside in the upcoming months.
The overall trend is still very bullish as the price has gained around 157.3% from the previous major swing low around 50.27 which was set after a considerable retracement of around 47.45% that was seen from the middle of 2014 until February of 2016. Therefore we remain bullish for the price action in the upcoming months.
AXP Weekly:
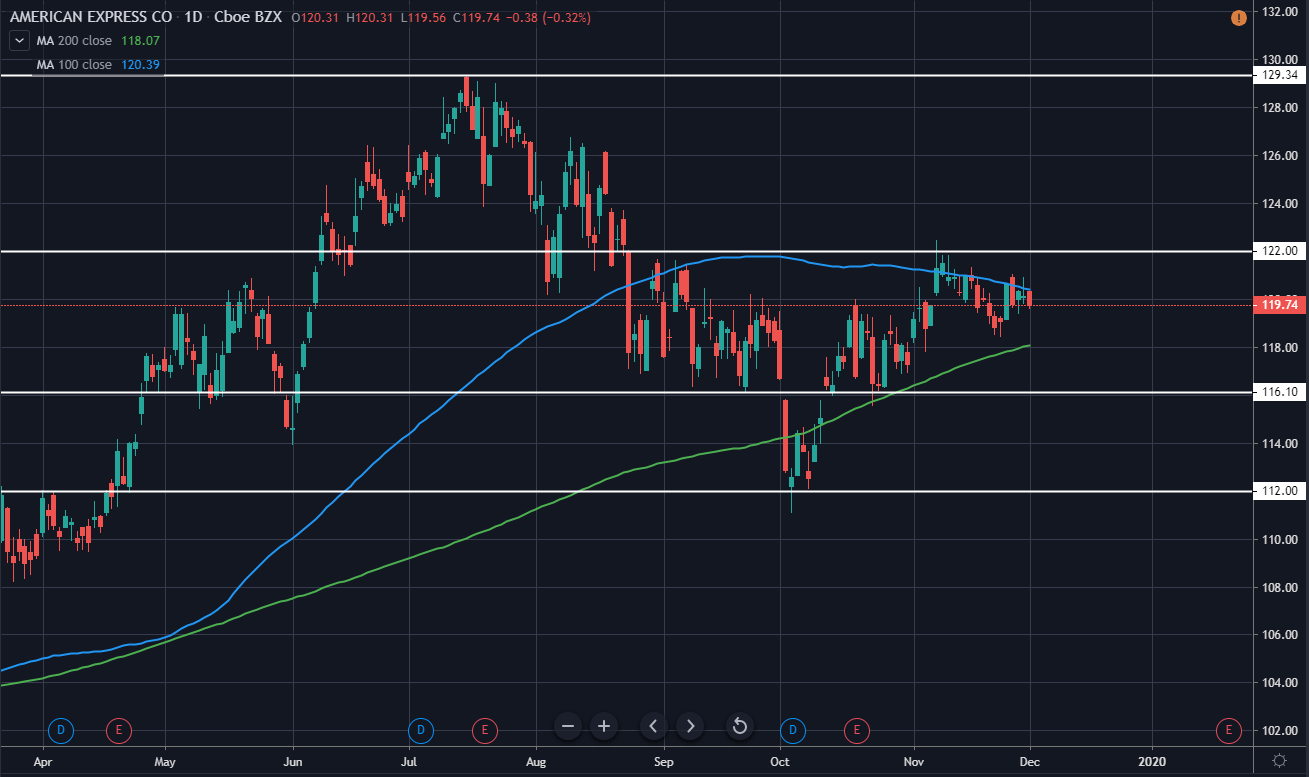
On the daily chart, we can see the price currently trading above 200 day moving average green line that has provided strong support in the past months. Additionally, 100 day moving average that is seen as a blue line on the chart currently provides resistance in addition to horizontal resistance of around 122 USD and has send the price in minor correction for the past weeks.
This can be used as a potential entry opportunity with a good risk/reward ratio as we expect new all-time highs being made next year and a break of 200 MA to invalidate this bullish momentum. The first major target can be seen around the all-time high of 129.34 USD and if reached from the current price would mean a gain of around 7.75% and as long as there are no signs of rejection, the position can be easily held to much further highs.
AXP Daily:
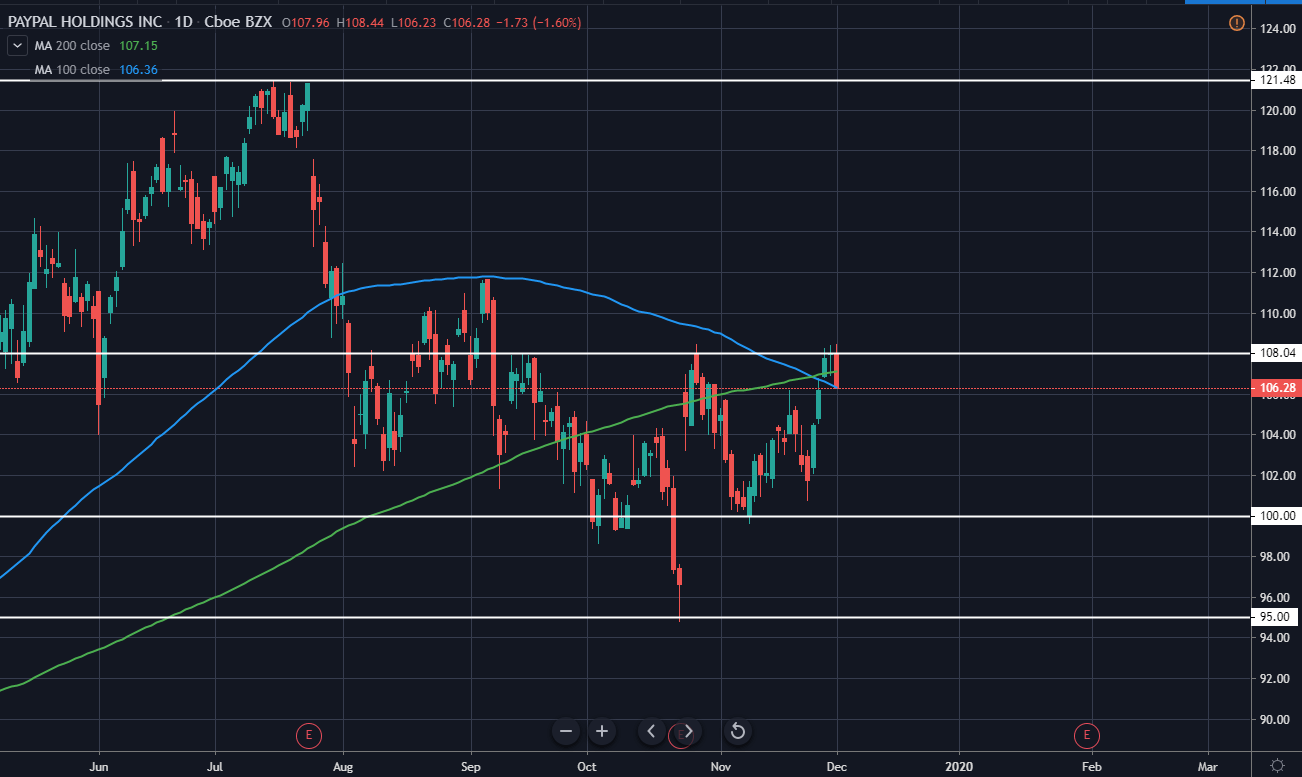
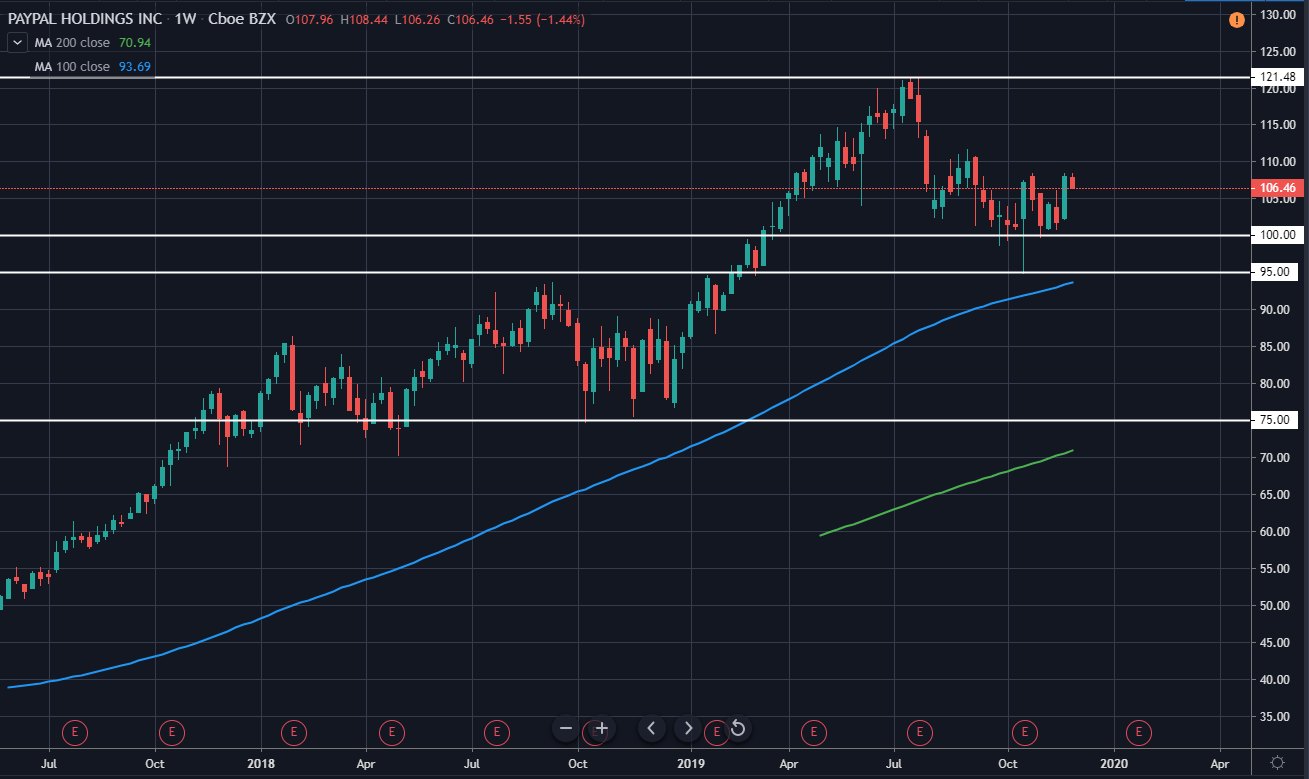
PayPal Holdings, Inc. (PYPL) currently has a market cap of 126.8B USD and trades around 1108.0 USD as it consolidates above 100 USD support for the past months, likely in preparation for further upside next year as the overall trend is still very bullish. During the previous upswing, the price gained around 62.5% from the low of 75 USD to the high of 121.5 USD and we could expect similar results for the next major upswing which would mean a potential target to the upside of around 150-155 USD.
PYPL Weekly:
Therefore, we can start to look for an entry on the daily timeframe. Currently, the price has reached and seems to be rejecting local resistance of 108 USD after strong bullish momentum last week. For those who look to enter the market, this is a good sign as further retracement would offer a much better risk/reward potential and area, where entry could be made, is seen around 100-102 USD.
This would mean a potential gain of around 20% if the current all-time high is reached and, therefore, would offer a good entry with very good potential for further upside during the next months.
PYPL Daily: