
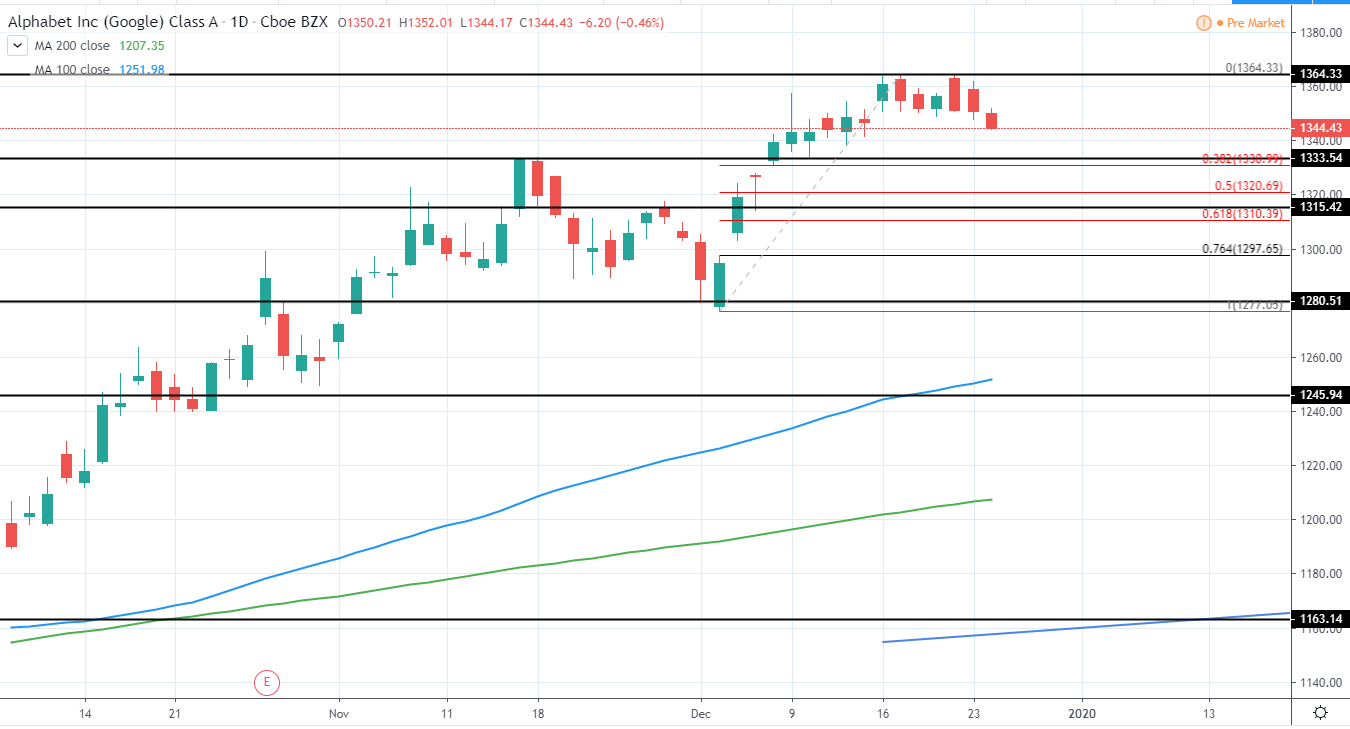
Alphabet, Inc. (GOOGL) currently trades around 1,344 USD with a market cap of 927B USD as it continues to retrace after setting a new all-time high around 1364 USD.
Since the previous upswing resulted in a decently higher high a retracement right now is a healthy sign and can be used in order to reenter the market. The optimal area for entry can be seen around 1315-1333 previous support, now turned resistance. 50-61.8% retracement from the previous upswing can be seen around 1310-1320 USD and offers additional confluence for potential support.
Therefore, for now, we are bearish, as a retracement is in progress, however, once the entry area is reached a long position can definitely be taken as the overall trend is still very bullish.
GOOGL Daily:
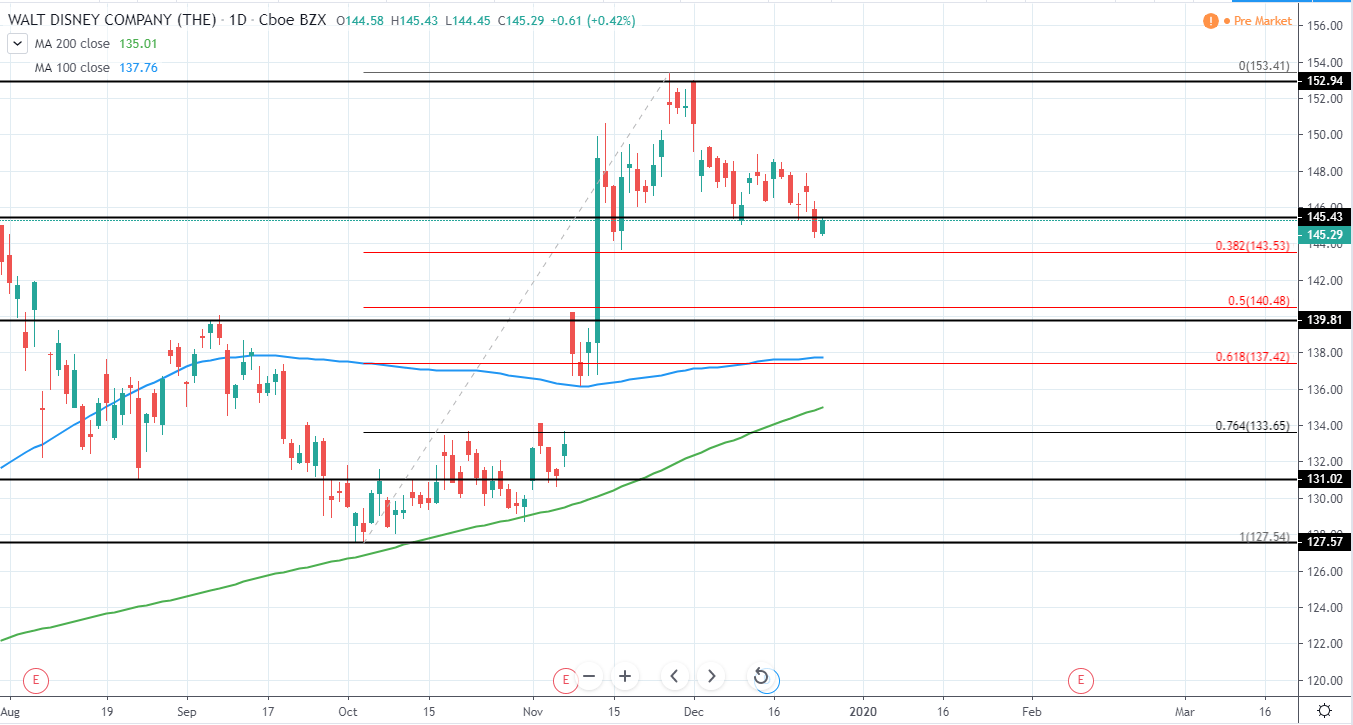
The Walt Disney Company (DIS) currently has a Market Cap of 262B USD and trades around 145.29 USD as it set a new all-time high around 153.41 USD as it continues to trade in a very strong uptrend for the past years.
Currently, retracement can be seen for the past week which can be used in order to reenter the market early next year with the entry area being around 137-140 USD, where 50-61.8% Fib retracement can be seen from the previous move as well as previous minor resistance turned support horizontal level of 139.8 USD. Additionally, both 100 and 200 day moving averages are currently looking to reach this area and adds an additional confluence for potential support.
Therefore, once the entry area is reached, we are very bullish for the stock and expect new all-time highs to be made early next year.
DIS Daily:
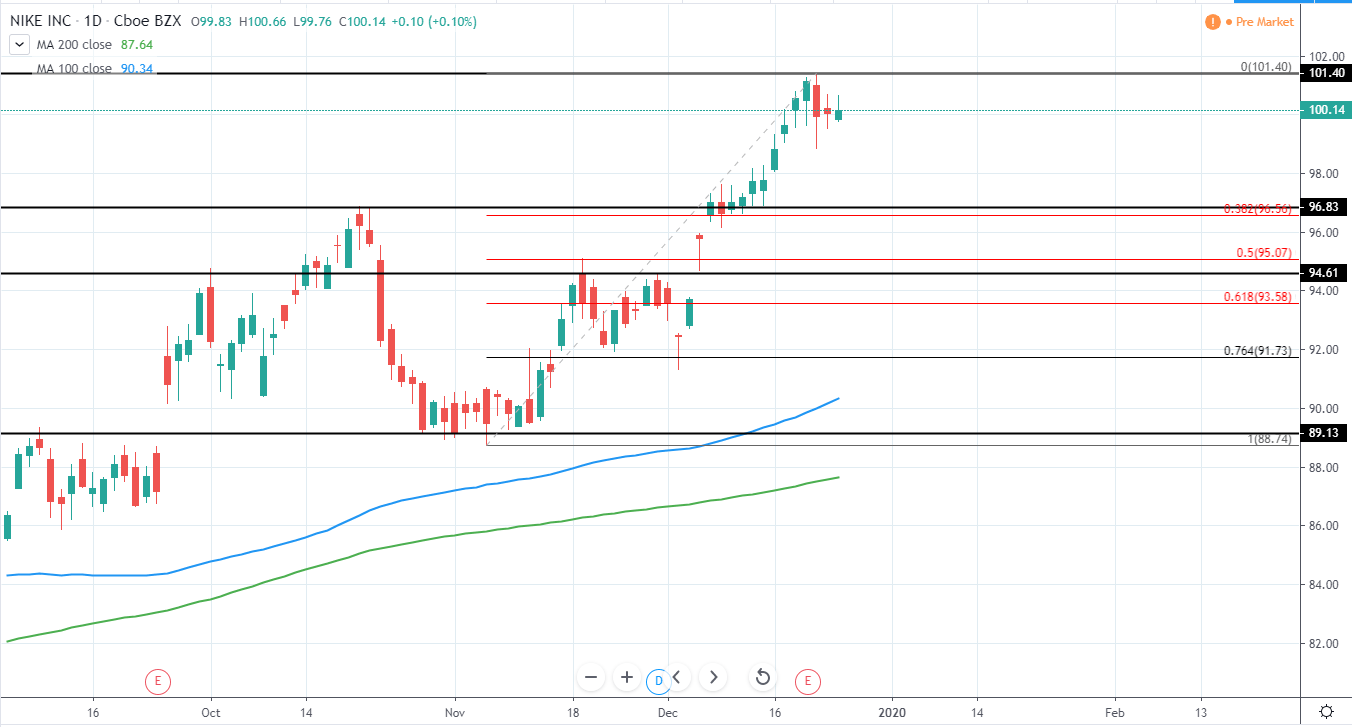
Nike, Inc. (NKE) currently has a Market Cap 156B USD and trades around 100.14 USD as it set a new all-time high around 101.4 USD last week and starts to show signs of potential retracement that could be used to reenter a long position.
Area, where optimal entry could be made, can be seen around 61.8-50% (93.58-95.07 USD) Fib retracement as well as previous consolidation around 92-94.5 USD and will likely be supported by 100 day moving average blue line that is steadily catching up with the price action.
Therefore, we are very bullish once retracement is made as the overall trend is still very bullish.
NKE Daily:
Micron Technology, Inc. (MU) currently has a Market Cap 61B USD and trades around 55.42 USD as it has reached a new yearly high around 56.11 USD and set a new higher high as the price continues to move in bullish momentum after reversing around 28.5 USD from a retracement that was seen last year
Since the price has extended so much, a retracement is needed in order to enter a market and potential area can be seen around 48-50.5 USD, where various minor support levels can be seen in addition to 61.8-50% Fib retracement. 100 day moving average blue line will likely catch up with this area in the upcoming weeks and provide further support.
The target for next move to the upside can be seen around 64.4 USD 2018 high as well as 61.85 USD minor resistance and 61.8% Fib extension around 63.25 USD, meaning a potential gain of around 24-29% if entered form 50 USD level and a very good risk/reward trade setup.
Therefore, once a retracement is made, we are very bullish for the stock and expect 2018 high to be reached in 2020.
MU Daily:


