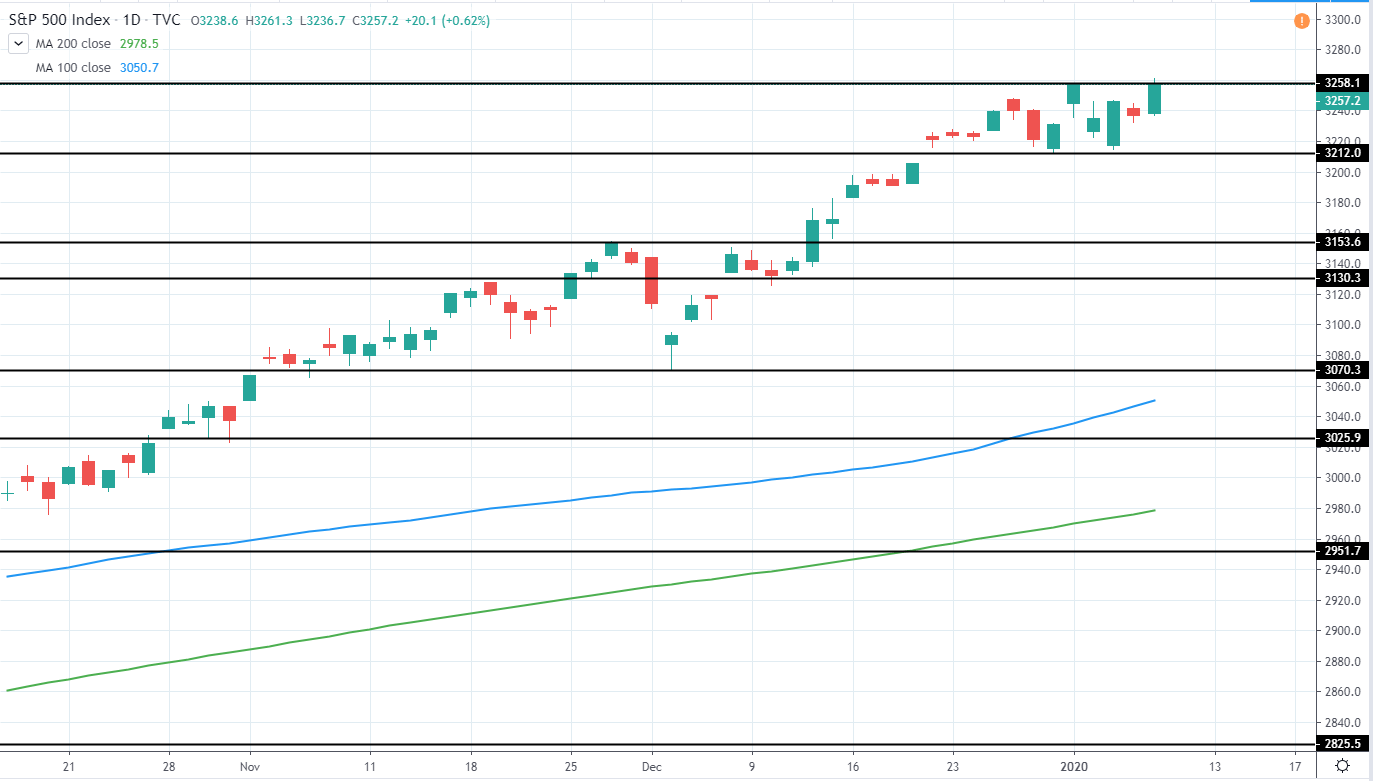
S&P 500 (^GSPC) currently trades around 3,257 USD as it set a new all-time high today as it slightly broke above 3258.1 USD previous high and peaked around 3261.3 USD after retesting support around 3212 USD.
The overall trend still continues being very bullish as the price has gained more than 14% since the previous major low around 2,855 USD, however, since the current has extended so far without a significant retracement, an entry opportunity with good potential risk/reward does not currently exist.
Therefore, until a significant retracement is seen it is best to stay neutral and wait for further price action development. A potential area where long position could be made once again can be seen around 3025 previous highs as well as 3,070 USD previous minor support. Additional support will likely be made by the area between 100 and 200 day moving averages which currently trade around 3050 and 2978 USD respectively.
S&P 500 (^GSPC) Daily:

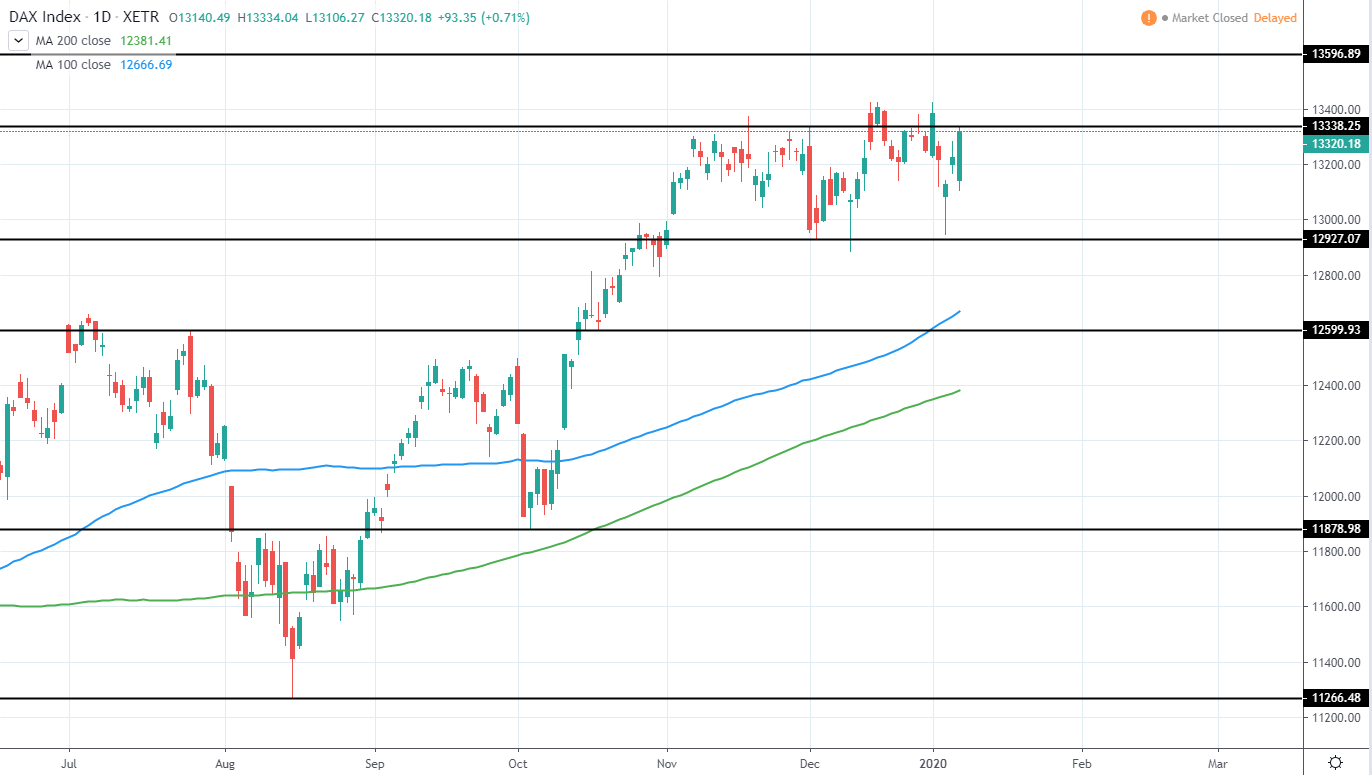
DAX (^GDAXI) trades around 13,320 EUR as it set a new yearly high around 13,423 EUR and quickly rejected to the downside and closed very bearish in the middle of December and retested this high again in 2nd of January after which another retest of support around 12925 USD was made with a clear rejection.
The overall several month is still bullish, however, considering the current lack of further bullish momentum we can expect to see a strong retracement in the upcoming months. This could be used in order to enter a long position once again with a good risk/reward potential.
Area, where support could be found following a retracement, can be seen around previous highs of 12.6k EUR as well as the area between 100 and 200 day moving averages that are currently trading around 12,666 and 12,381 EUR respectively.
Therefore, until then, it is best to stay neutral and wait for further price action development, preferably, in the form of retracement to the downside.
DAX (^GDAXI) Daily:

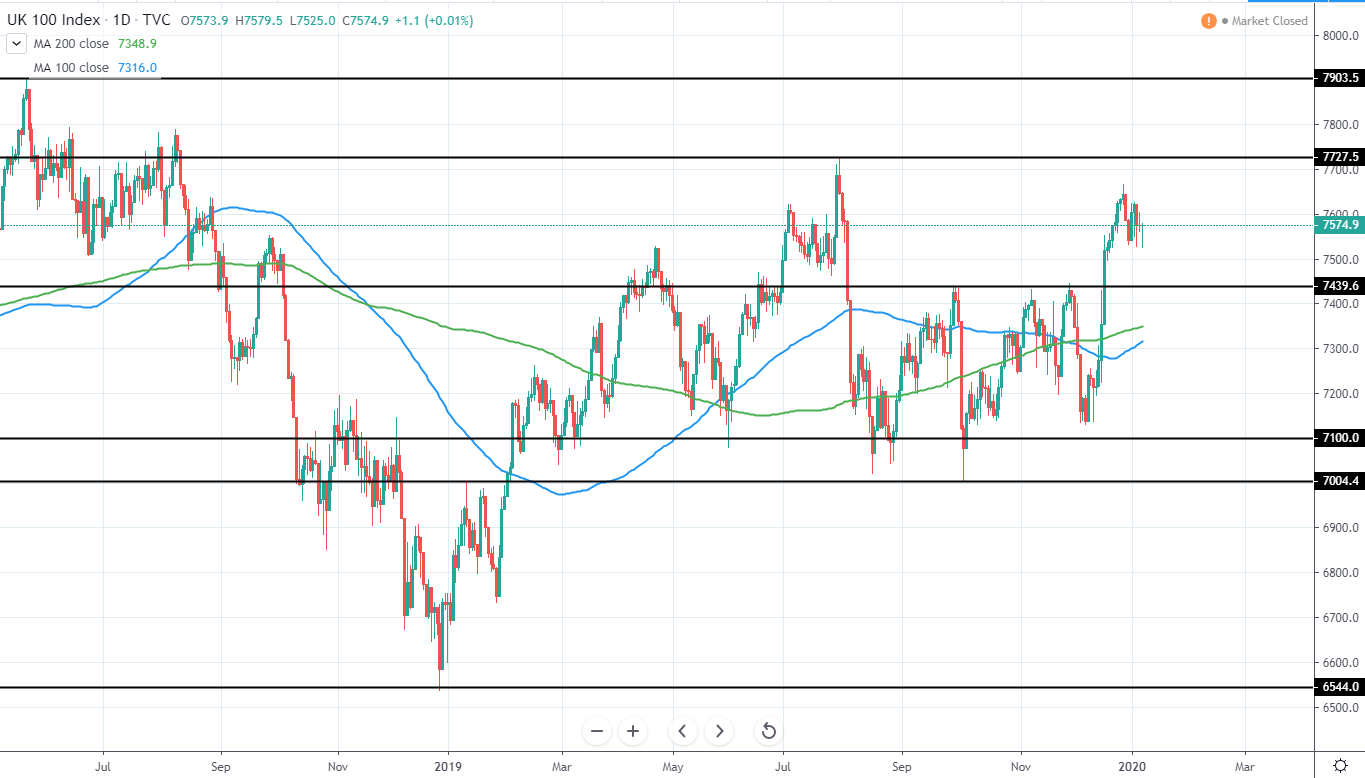
FTSE 100 (^FTSE) currently trades around 7,575 GBP as it broke above the previous several week resistance of 7,440 GBP, which reversed the price action several times in the past months and set a new high, peaking around 7,665 GBP, after which, signs of potential retracement to the downside can be seen during the past weeks.
The overall trend is still unclear as the price failed to move above 2019 high of 7,727 GBP, however, it made a higher low around 7,140 GBP at the beginning of December, which indicates potential bullish momentum forming, however, still needs to be confirmed with another higher low.
Therefore, we can expect a move towards previous major resistance of around 7,440 GBP as well as the area around 100 and 200 day moving averages, currently trading around 7216 and 7348 GBP respectively as the price looks to set another higher low, which would be a very bullish sign for the upcoming year.
Until then, a short position could possibly be taken towards previously mentioned support levels, however, it would be best to stay neutral and wait for further price action development.
FTSE 100 (^FTSE) Daily:
