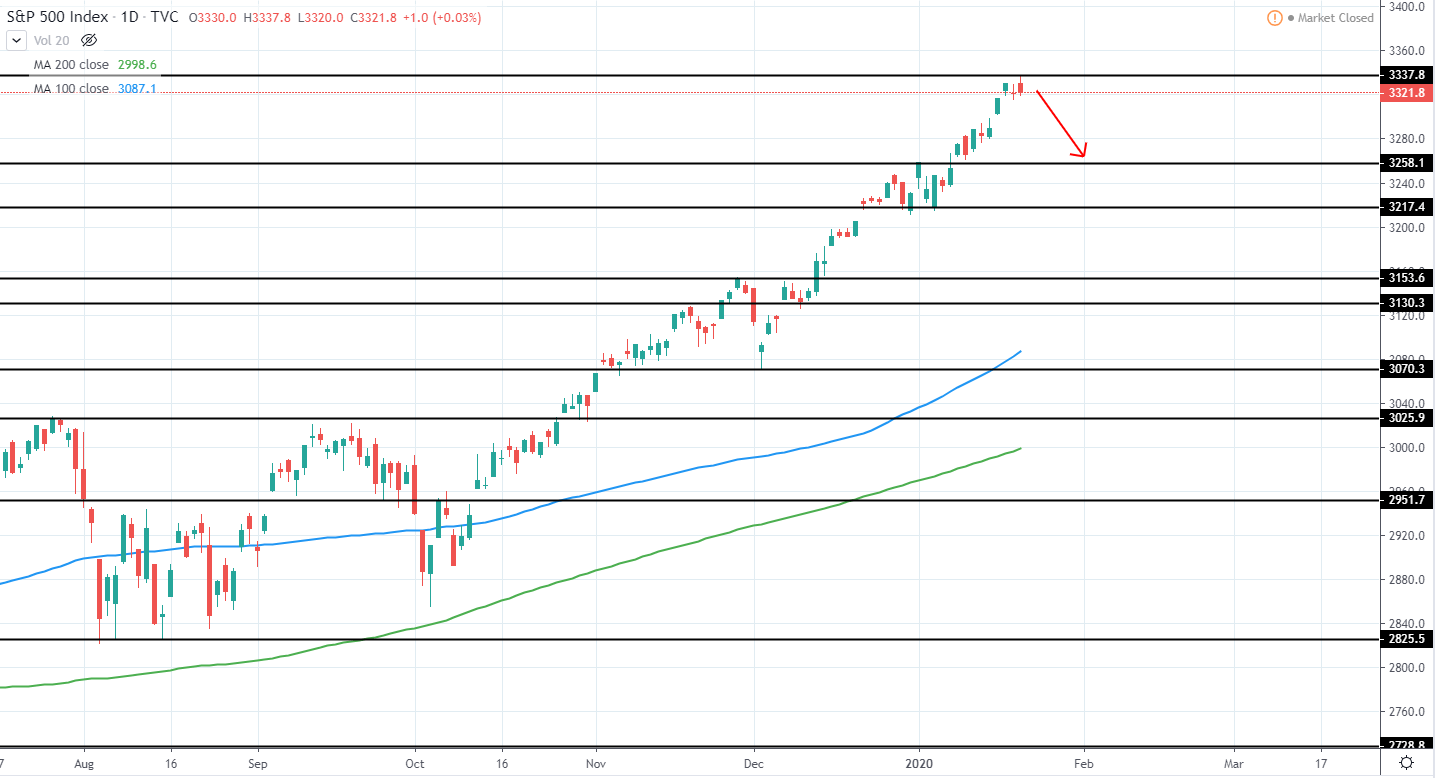
S&P 500 (SPX) currently trades around 3,321.8 USD as it has set another all-time high yesterday around 3,337.8 USD and slightly moved lower afterward.
The overall several month trend still continues being very bullish and shows no signs of slowing down. From the previous major retracement in October, when the price tested 2855 USD support, a gain of around 16.87% has been made, therefore a retracement is needed to enter a long position once again with a good risk/reward potential.
The potential target of support for a short-term retracement can be currently seen around the previous high of 3,258 USD, which could be used to reenter the trend. A much more considerable retracement target can be seen around 3070 USD, where 100 day moving average blue line is currently located and 200 day MA green line is closing in.
Therefore, until at least a short-term retracement is seen, best would be to stay neutral and wait for further price action development.
SPX Daily:
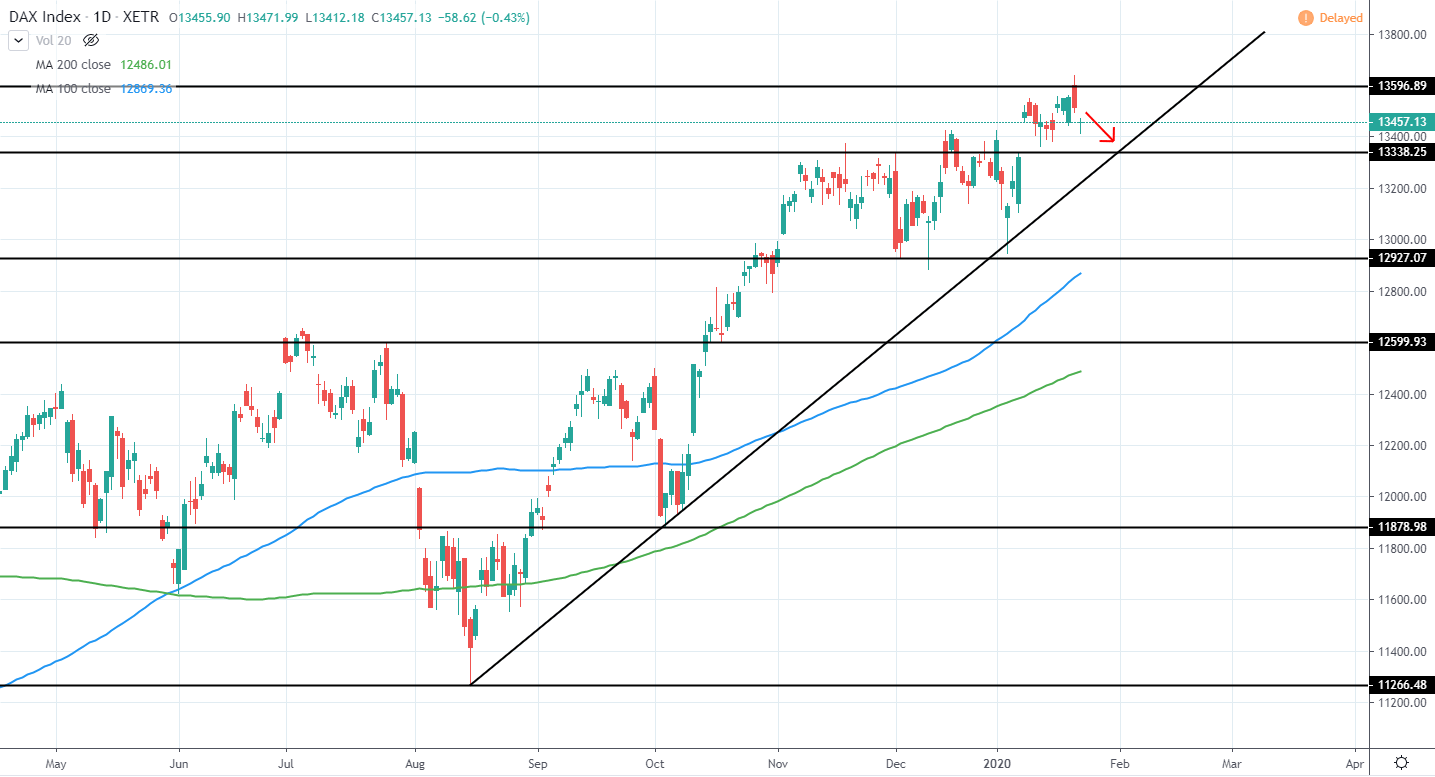
DAX (DAX) trades around 13,457 EUR as it has also set a new all-time high after moving slightly above the previous one of 13,596 and peaking around 13,640 USD.
Currently, the price looks to retest previous resistance now turned support around 13,338 EUR as well as the several month trend line that was confirmed with a third touch on the 6th of January. Once this area is reached, we can look for an entry opportunity in the expectation that the current bullish momentum will continue and a new all-time high will be made in the upcoming weeks.
Alternatively, a move below the trend line would be a very bearish indication for the upcoming months, however, as long as the previous major low around 12,925 EUR is not broken, we should see further upside.
DAX Daily:
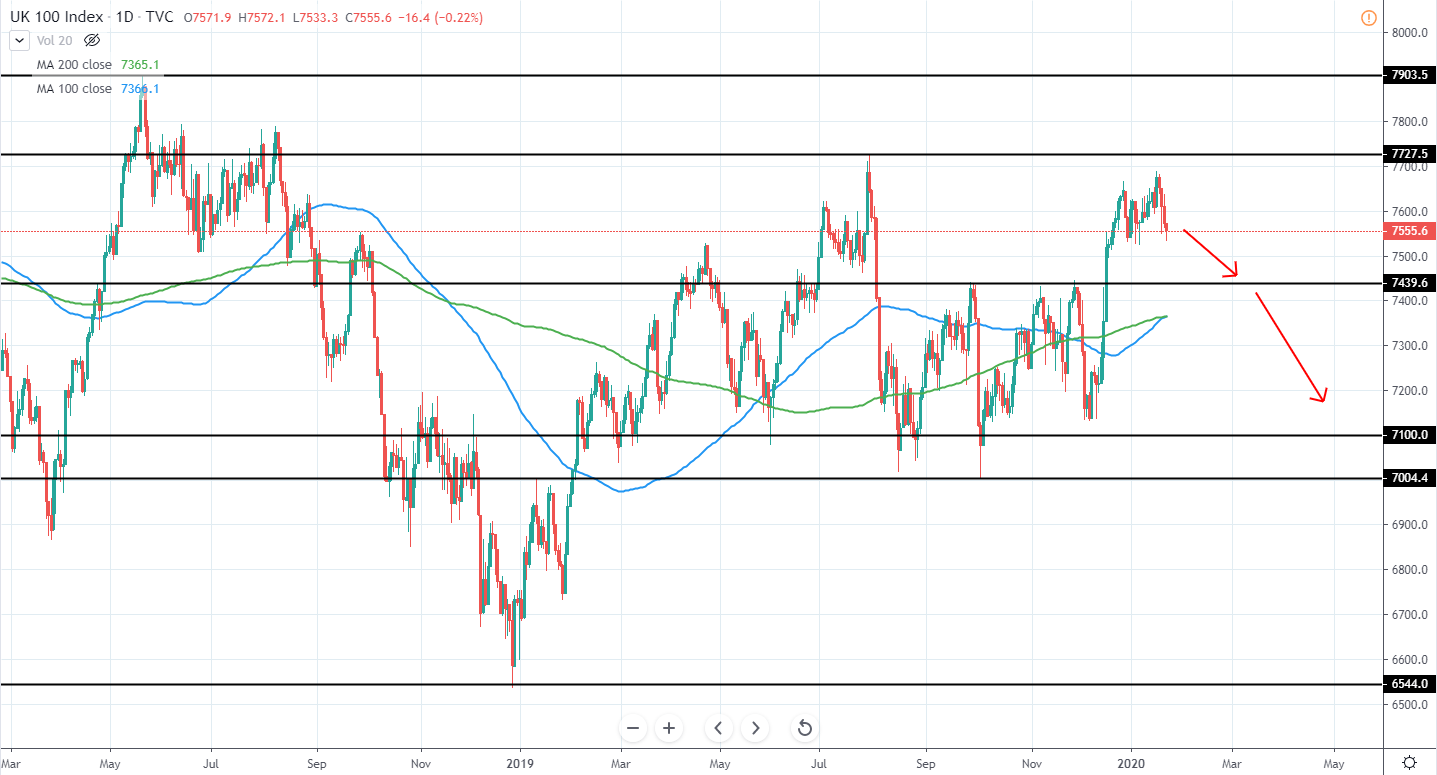
FTSE 100 (UKX) currently trades around 7,555 GBP as it still looks to move above 2019 high of 7727 GBP and the all-time high of 7903 GBP, however, continued to show signs of exhaustion for the current bullish momentum last week as well.
The overall trend has been neutral as both lower highs and higher lows have been made during the past year, however, the previous upswing, that broke above 7439 GBP previous resistance, that reversed the price several times, indicates a very strong bullish momentum forming after another higher low was made. Therefore, once a retracement that sets another higher low is made, a long position can be taken in the expectation that the price will look to test the all-time high around 7903 GBP in the upcoming months.
Potential support area where the price could set another higher low and reverse back to the upside can be seen around 7440 GBP previous major resistance as well as area around both 100 and 200 day moving averages that are seen as a blue and green line on the chart around 7339 and 7258 GBP respectively. Alternatively, we could see a move towards the previous major support area around 7-7.1k GBP. This would also indicate a further sideways price action in the upcoming months.
Therefore, until a retracement is seen, it is best to stay neutral and wait for further price action development in the form of a retracement, however, a short position could be made as the market continues indicating an upcoming retracement.
UKX Daily: