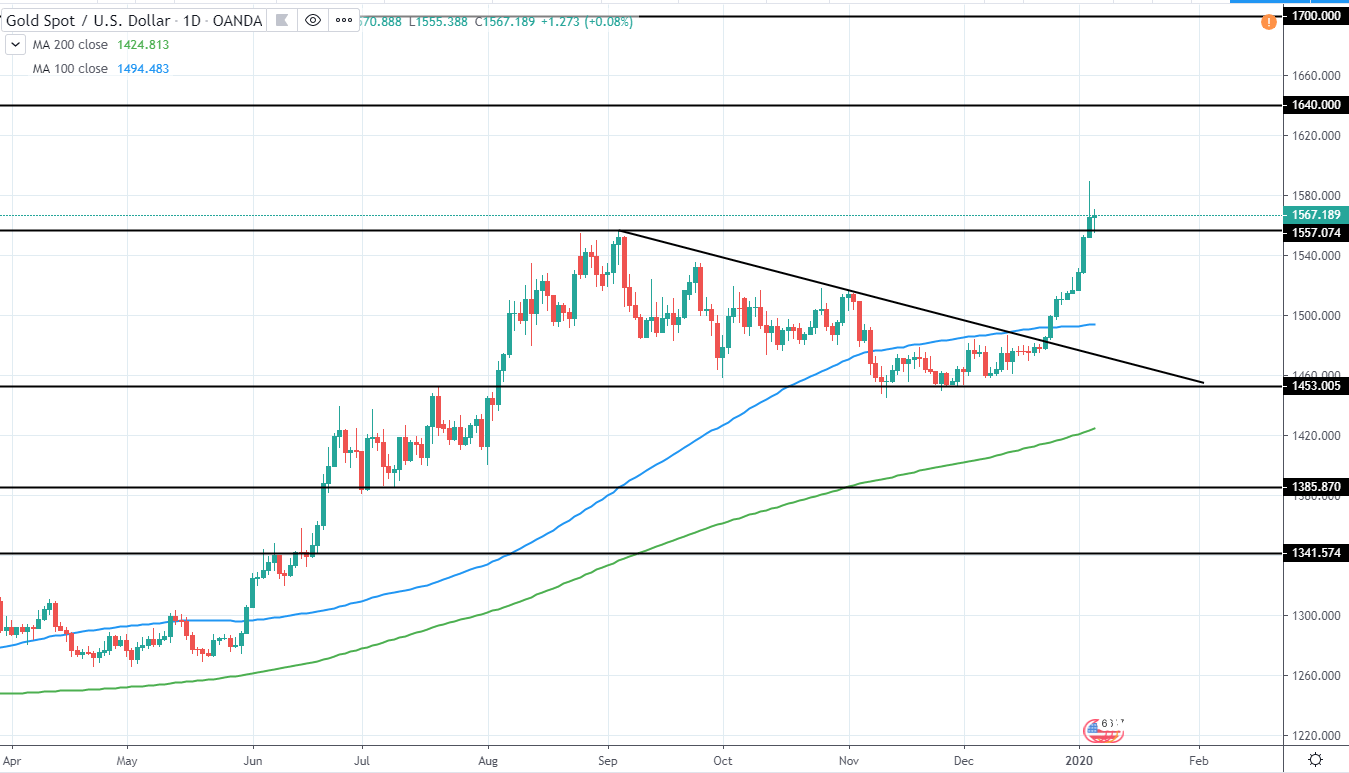
Gold has set another higher high this week as it peaked around 1589 USD and saw a slight rejection during the same trading session. This was seen after a several month consolidation above 1450 USD support and descending trend line was broken at the end of December and indicates further continuation to the upside along the 1.5-year long bullish momentum as the price looks to reach next major resistance around 1640 USD.
For now, however, the price has extended too far in order to consider entering a position and, therefore, it would be best to stay neutral and wait for further price action development, preferably, further higher high and a clear retracement setting a higher low.
GOLD Daily:
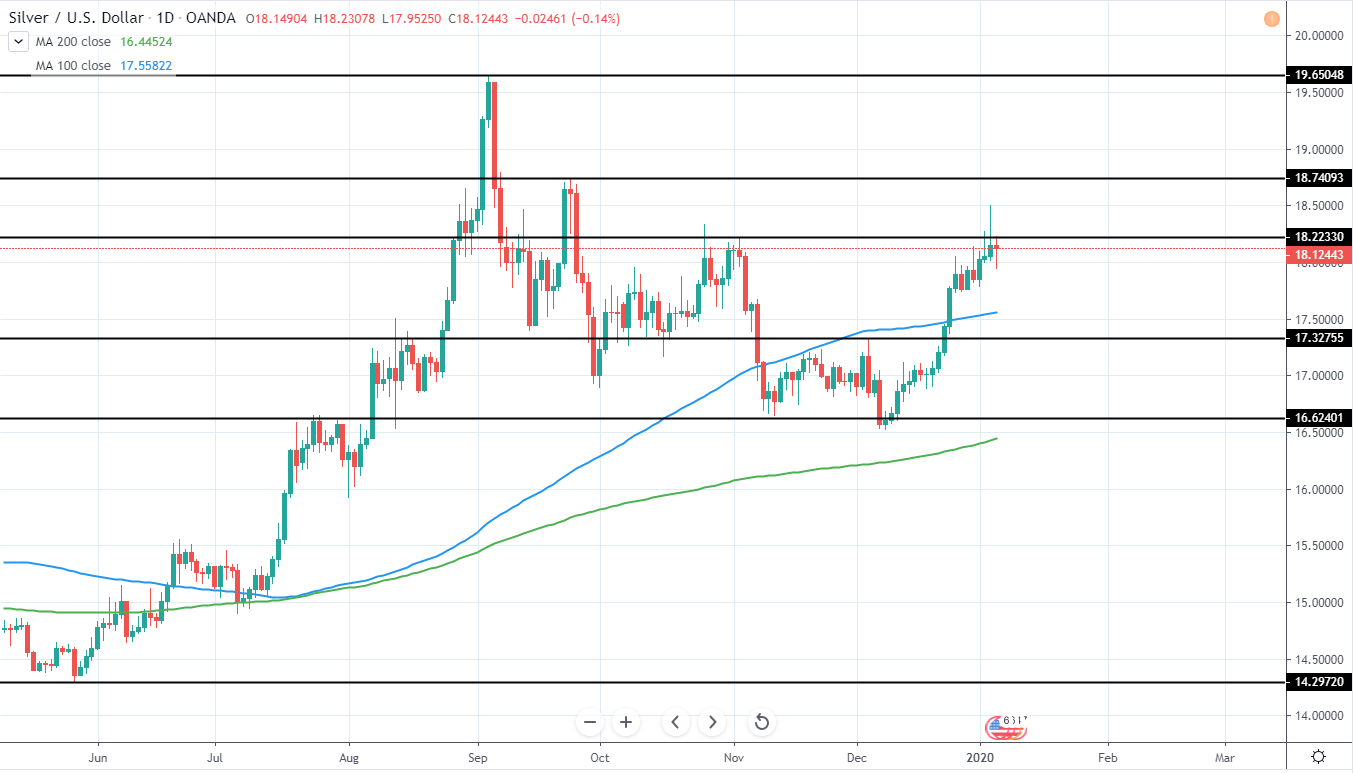
Silver continues to retrace for the past months after setting a 2019 high around 19.65 USD in September and has lost around 15.8% to the low of 16.6 USD
Yesterday the price set a higher high, however, briefly, as it saw rejection back below 18.2 USD resistance after peaking around 18.505 USD. Therefore, we can expect another move to the downside in the upcoming weeks as previous low around 16.6 USD will likely be tested and would mean a downside of around 8.5% from the current price with a decent risk/reward short opportunity.
If a higher low is set during the next bearish move, we could start to look for entry opportunities to the upside.
SILVER Daily:
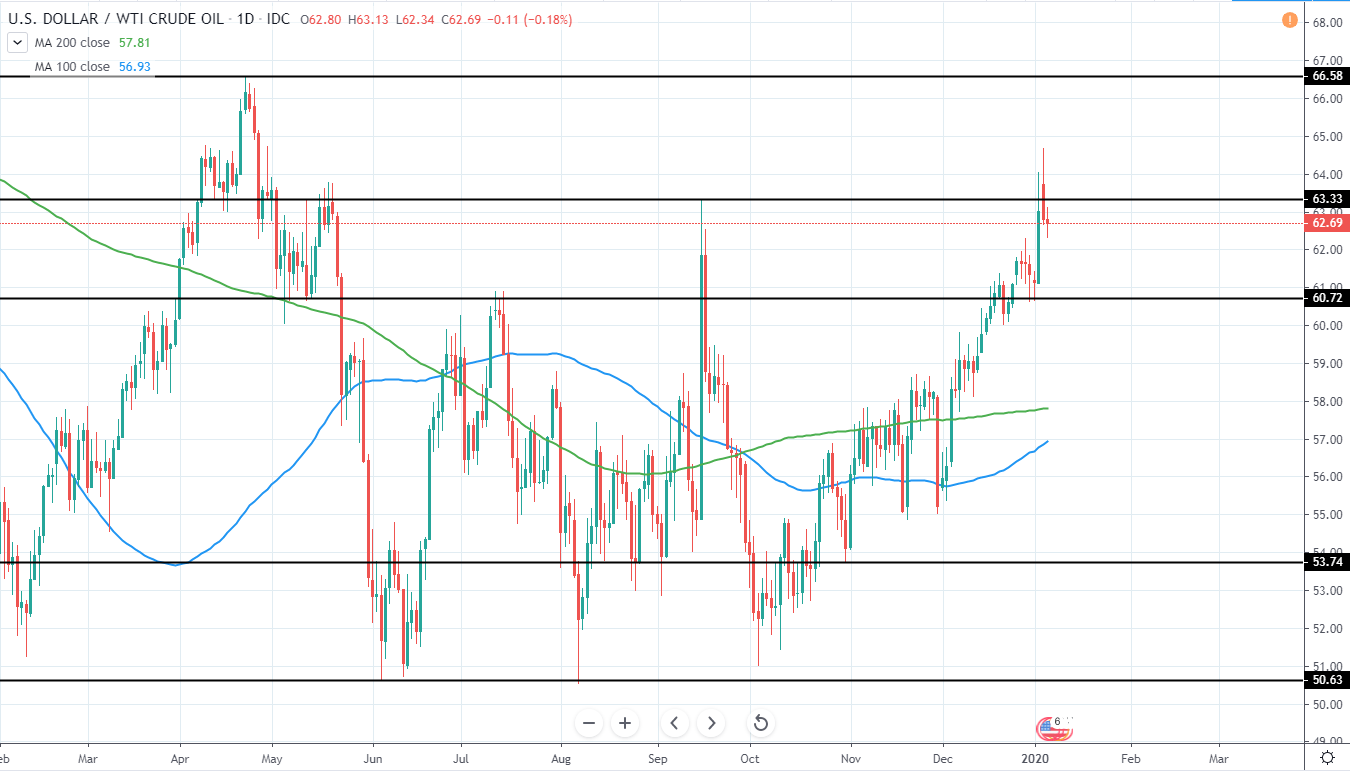
WTI has continued to move higher for the past weeks as it tests previous range highs around 63-66.5 USD and yesterday a sharp rejection for further upside was seen just above the previous high of 63.33 USD.
This indicates that we will likely see price reversal back to the downside and a move towards 2019 major support area around 50.6-53 USD, which would mean a downside of around 15-18% and a very good risk/reward potential for a short position if a stop is placed above around 65 USD. Additional support could be found in the middle of the range where both 100 and 200 day moving averages are located around 56.93 and 57.81 USD respectively and price needs to be monitored around these levels.
Therefore, we are bearish for the upcoming months and expect a considerable move lower.
WTI Daily:
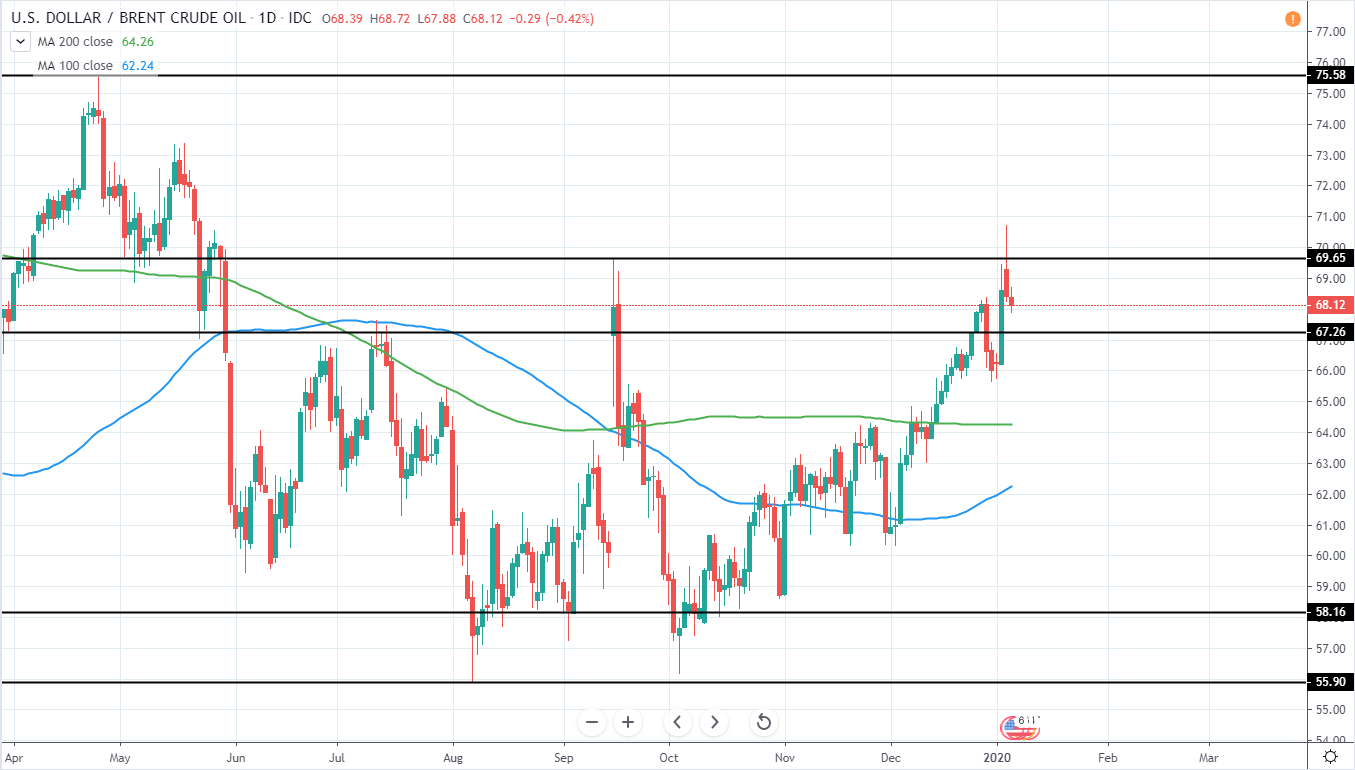
BRENT has also made a slightly higher high above 69.65 USD previous high, however, quickly rejected back below and closing very bearish yesterday, therefore, indicating more downside likely to be seen in the upcoming months.
A short position, therefore, could be taken in the expectation that the 2019 major support area around 56-58 USD will likely be tested once again, meaning a potential downside of around 15-18% and a very good risk/reward trade setup for a short position.
Additional support could be found around 61-64 USD area with both 100 and 200 day moving averages trading close by around 62.24 and 64.27 USD respectively.
BRENT Daily:
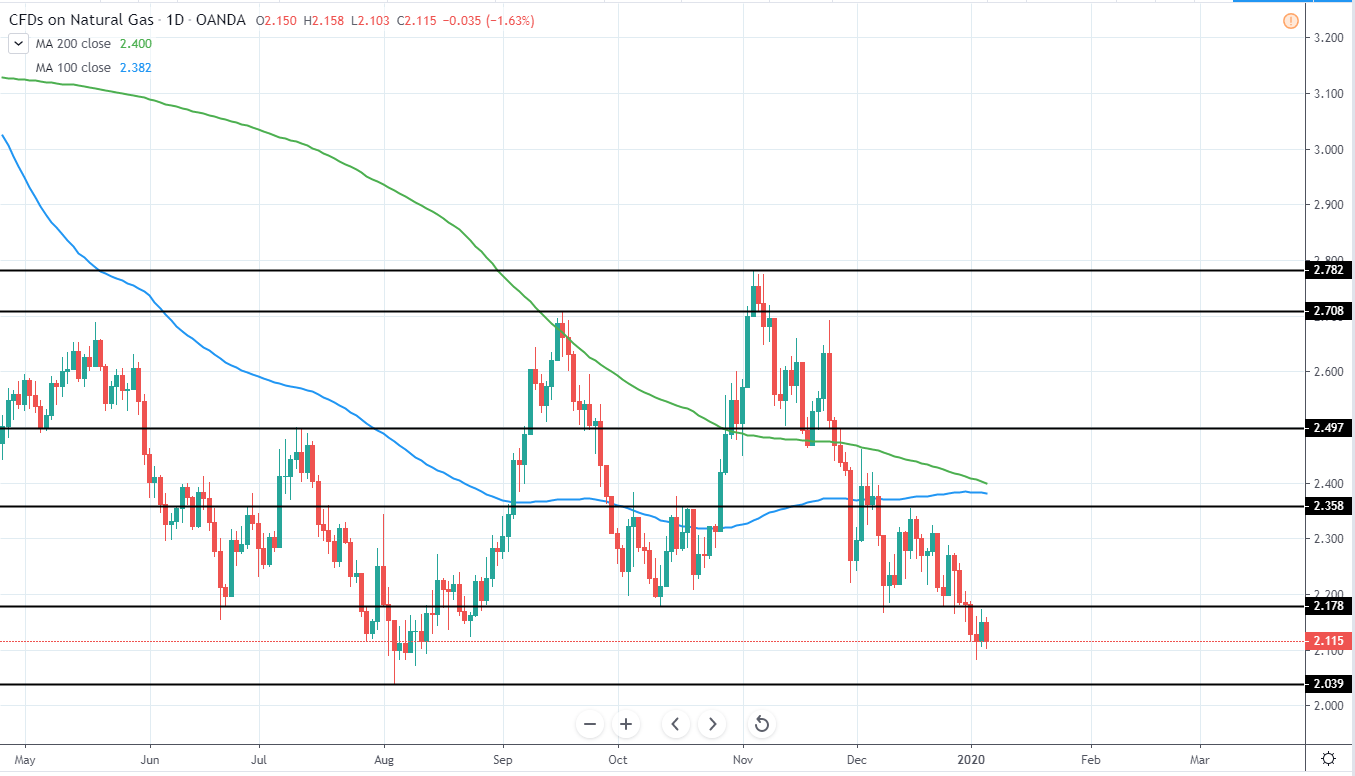
NAT GAS continues moving lower as it looks to retest 2019 low of 2.039 USD after the price set a slightly higher high around 2.78 USD and declined by 24.9% to the current low, breaking below 2.178 USD previous higher low and, therefore, invalidating potential signs for a bullish reversal.
Considering this, it would be best to stay neutral for now and wait for further price action development with the next trade setup potentially being after the price retraces back to the upside and a new lower high is set around 2.5 USD
NAT GAS Daily: