Published: January 6th, 2026
Following three years of 18% compound yearly EPS growth, 6.9% revenue growth and consistent EBIT margins, TD Synnex (SNX) is garnering attention. Following a rather mild 90-day share price return of 3.29%, the most recent share cost of $153.43 was reached.
Nonetheless, the three-year overall return on equity of 59.67% and the one-year total investor return of 31.44% indicate more momentum over an extended amount of time.
The ongoing adoption of AI and enterprise-wide digital change, as evidenced by double-digit software growth. The growth in cloud, virtualization, cybersecurity, and infrastructure software, are expanding TD SYNNEX's addressable marketplace and producing higher recurring streams of revenue.
The desire for sophisticated integration and lifetime services is rising due to ongoing data center build-outs and the spread of hybrid/cloud IT infrastructures, as demonstrated by the rapid expansion of the Advanced Solutions and Hyve businesses. Increased net margins through higher-value offers are supported by these dynamics.
Let's see the full market outlook from the SNX market outlook:
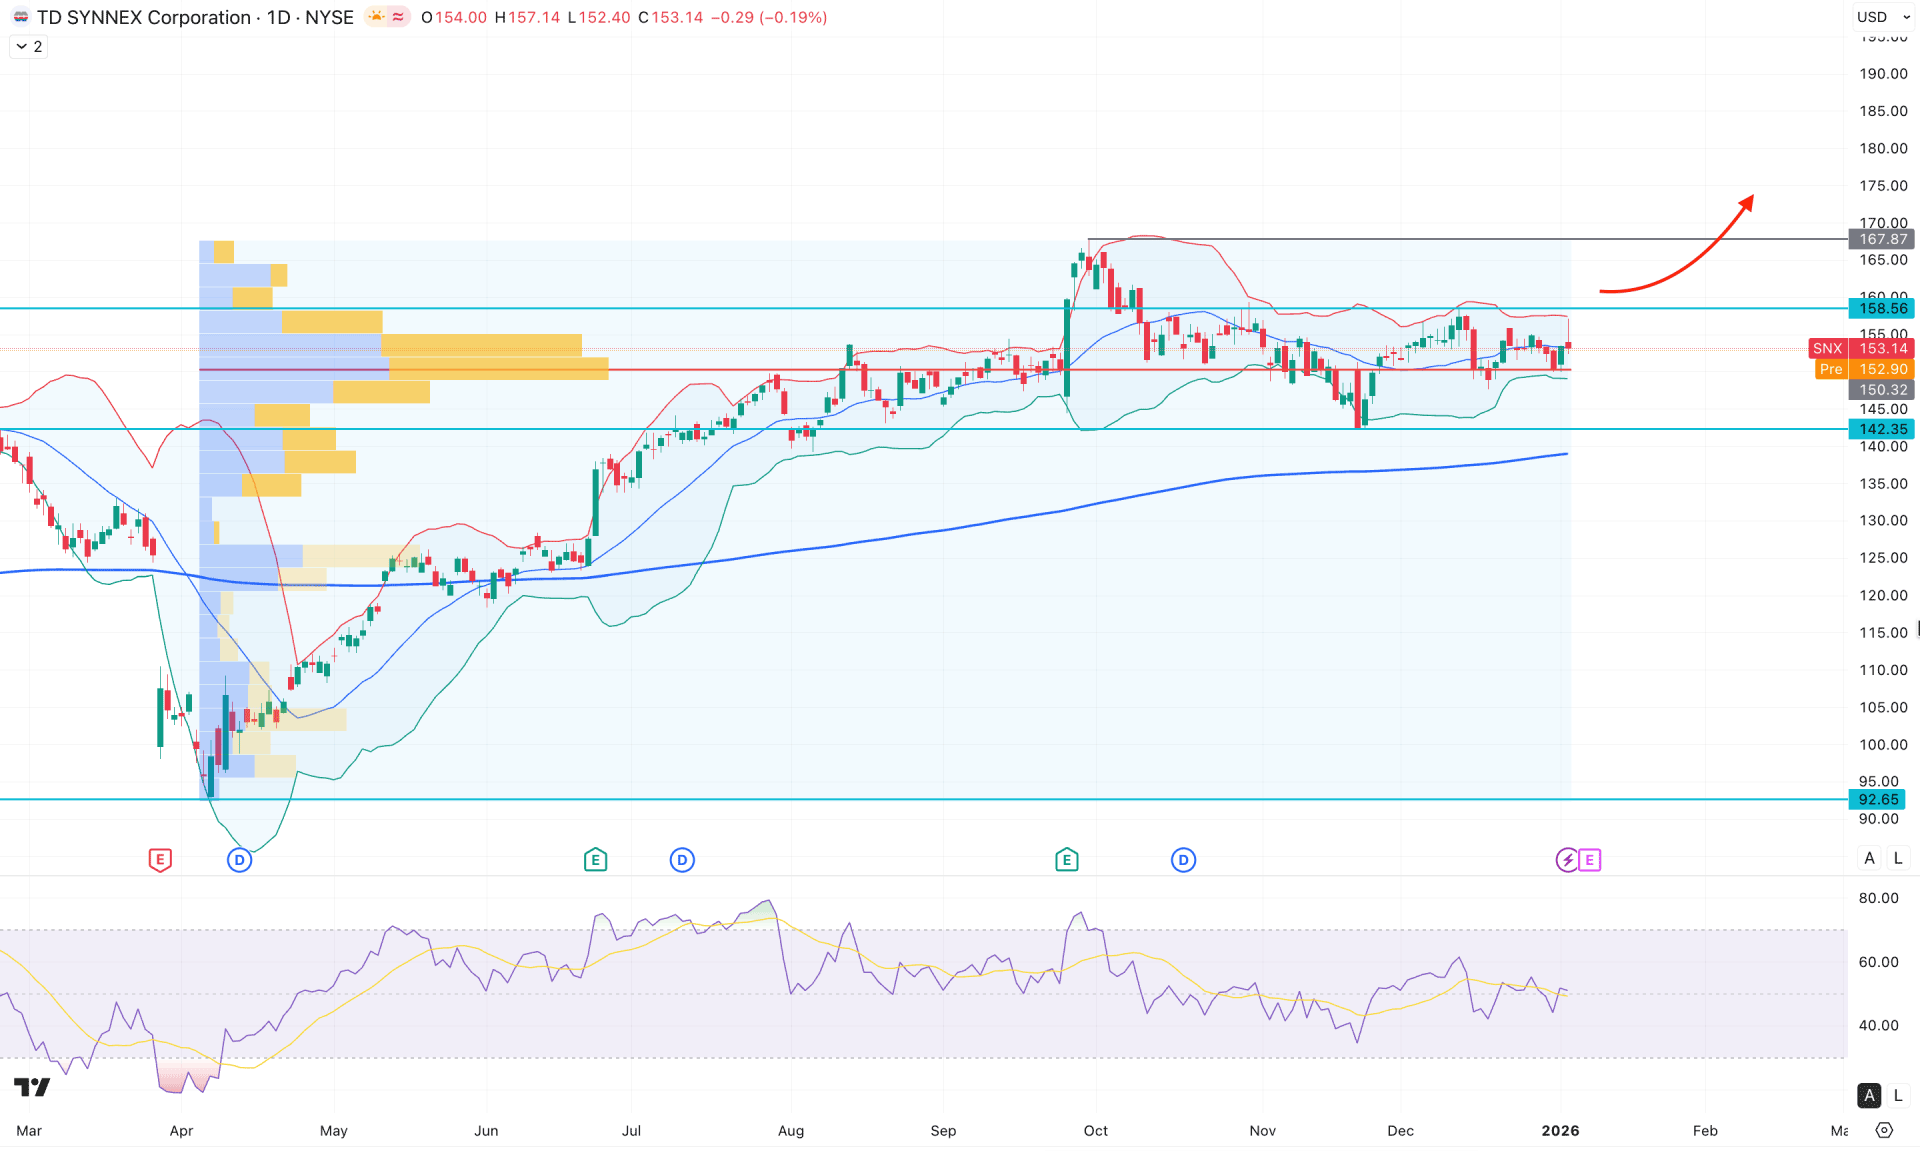
In the daily chart of SNX, the ongoing market momentum is bullish, where the most recent price has been trading sideways within a rectangle pattern. Primarily, sufficient bullish pressure from the range low with a valid price action could be a long opportunity, following the major trend.
Looking at the higher timeframe, the monthly candle indicates renewed buying pressure after three consecutive bearish months. Although selling pressure was present in the recent quarter, the broader market structure has remained bullish since the beginning of 2025. On the weekly chart, price action reflects sideways momentum, from which a higher-probability breakout could initiate trend continuation.
From the volume's perspective, price is still trading within the order-building zone where the most active level since April 2025 is located near the 150.32 level. As long as the price holds above this high-volume line, the broader market momentum is likely to remain biased toward the buyers' side.
On the main price chart, sideways momentum is evident from the Bollinger Bands, as both the upper and lower bands remain flat. Meanwhile, the 200-day SMA is acting as a strong dynamic support below the 132.35 level. Overall, the primary market trend remains bullish, as indicated by the 200-day SMA. However, a trend-continuation setup would require confirmation through a potential Bollinger Bands breakout.
In the secondary indicator window, the Relative Strength Index shows sideways behavior, with the current reading hovering near the 50.0 neutral level.
Based on the overall market structure, a bullish daily close above the median Bollinger Band could present a primary opportunity to anticipate bullish continuation toward the 158.56 range high. However, a strong bullish rejection from the high-volume area could increase the probability of an extended move toward the 167.87 level.
On the bearish side, investors should closely monitor how the price behaves around the 200-day simple moving average. Failure to maintain the price above the 132.35 static level could increase bearish risk and open the door for a downside test of the 120.00 psychological support.
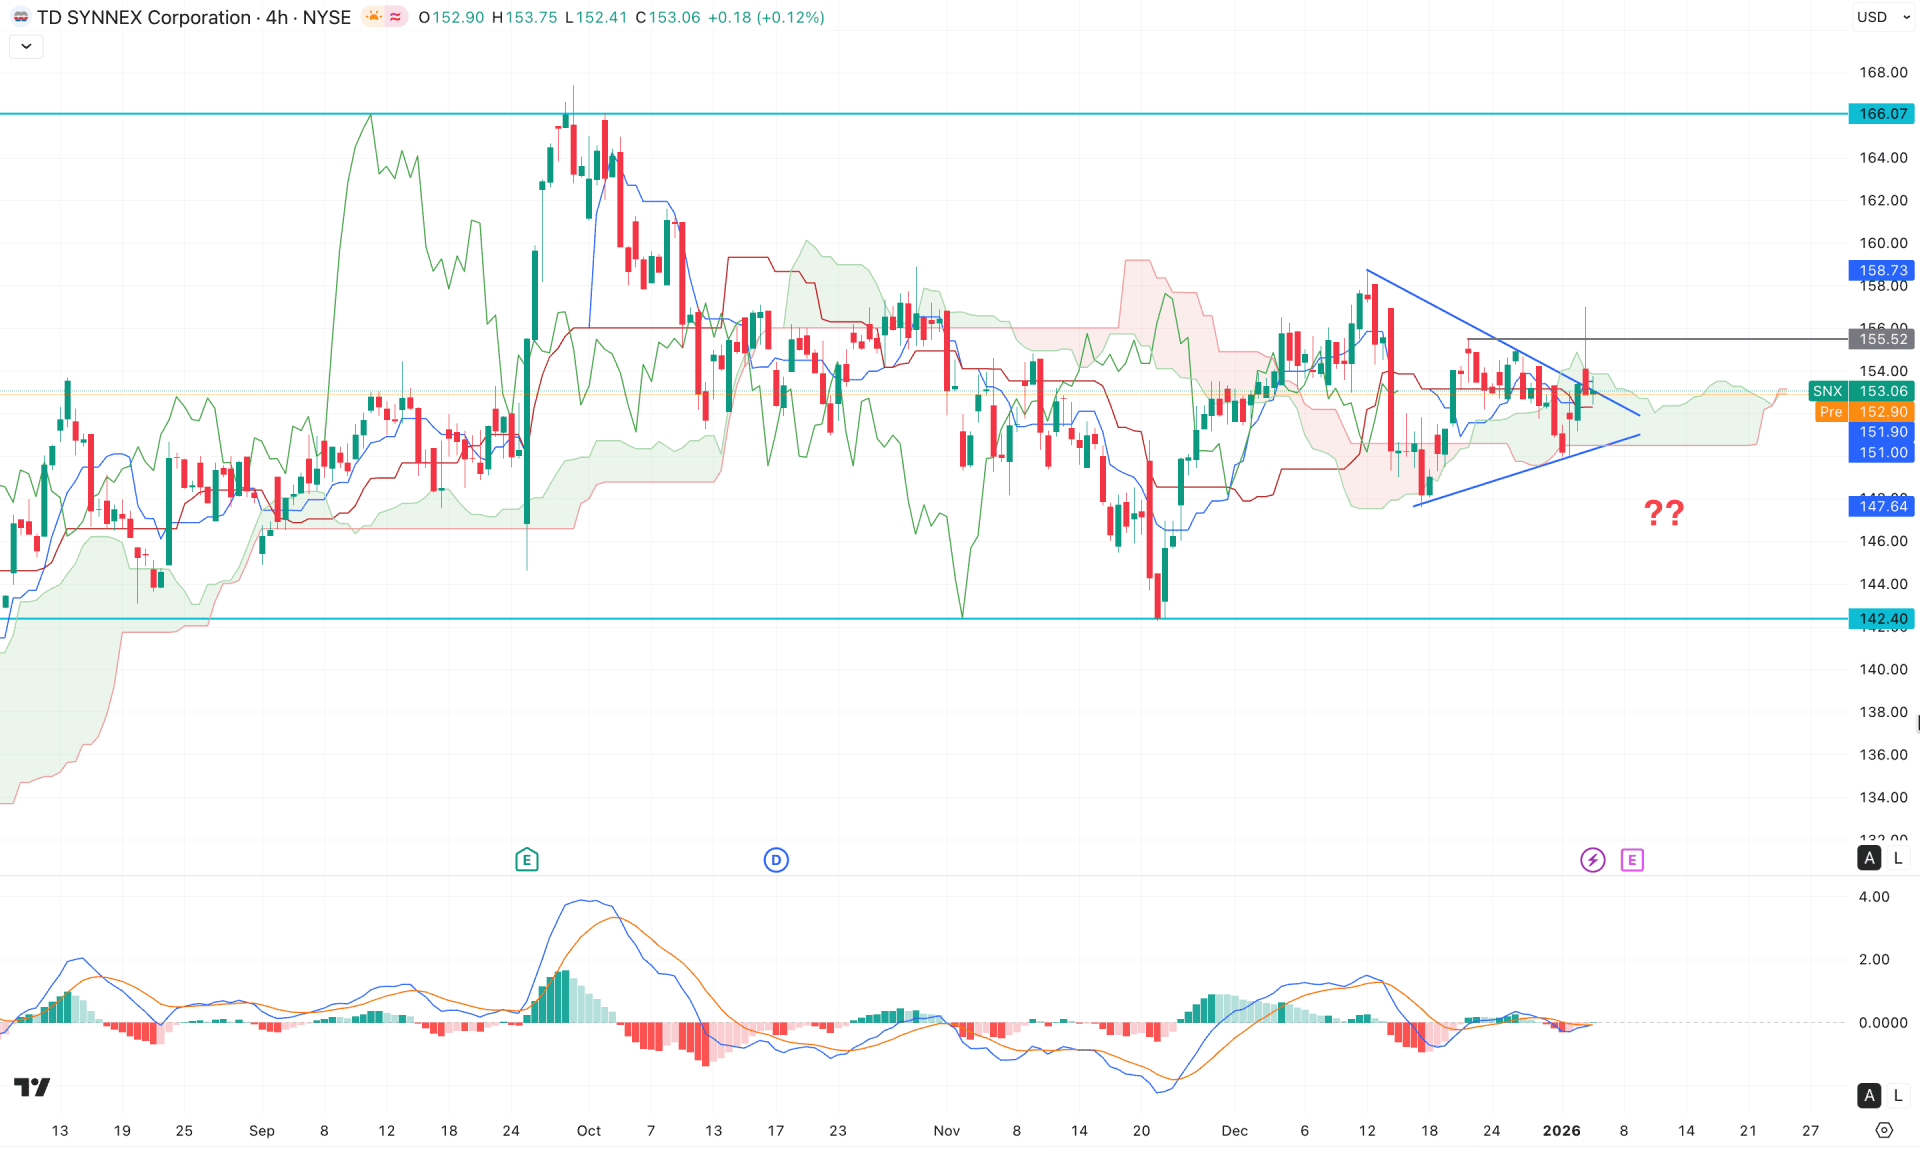
On the H4 chart, a potential bullish breakout is emerging from the 142.40 bottom, which formed a valid swing high after a corrective pullback into the cloud area. However, price is still trading within a symmetrical triangle formation, from which a valid bullish breakout remains possible.
In the Future Cloud, both leading spans are sloping upward, signaling a potential bullish continuation, while momentum within the dynamic lines remains sideways.
In the secondary indicator window, corrective market momentum is evident, as the MACD and signal lines are compressed near the neutral level.
Based on the overall market structure, a bullish breakout confirmed by a four-hour close above the 155.52 swing high could validate a long opportunity targeting the 166.07 level. The bullish continuation scenario remains intact as long as the price holds above the cloud area.
Conversely, a break below the 147.64 level could confirm a bearish cloud breakout, potentially extending selling pressure toward the 132.40 level before presenting another long-term buying opportunity.
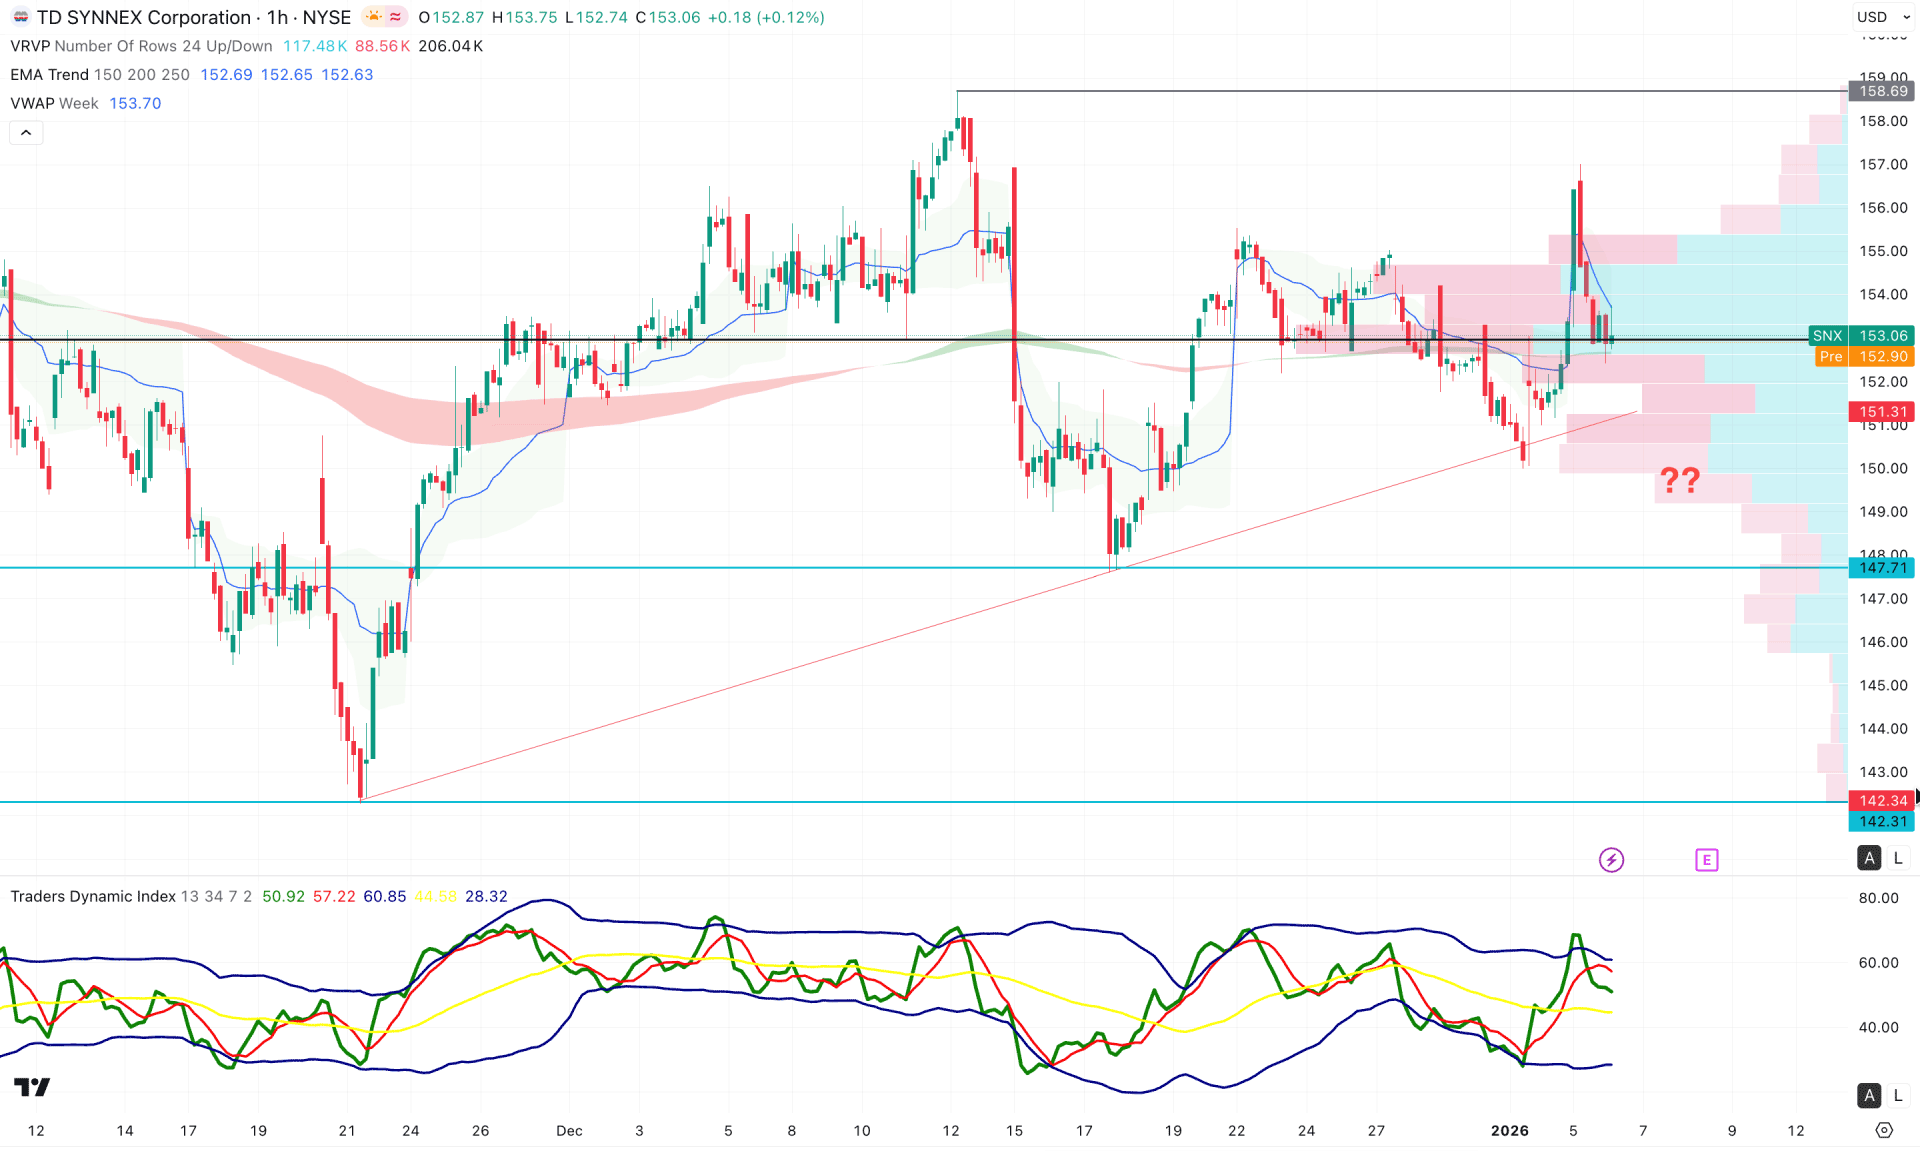
On the hourly chart, corrective market momentum is evident, with the most recent price trading near the high-volume line. Bullish pressure is supported by a rising trendline, and a bullish break of structure is visible above the 155.58 swing high.
The weekly VWAP line remains below the current price and is acting as a major support, reinforced by a bullish continuation signal from the EMA wave.
In the secondary indicator window, the Traders Dynamic Index has reached the upper peak area and continues to hold momentum above the 50.00 neutral level.
Based on the overall market structure, bullish continuation remains possible as long as the price trades above the 150.00 psychological level. A bullish breakout from the current price area, confirmed by an hourly close above the VWAP line, could validate a long opportunity targeting the 158.69 level.
Conversely, failure to hold above the 147.70 level could increase volatility and drive the price toward the 132.34 support area.
In line with the broader market structure, SNX remains positioned within a long-term bullish trend. A trend-continuation setup may present a valid investment opportunity; however, investors should closely monitor intraday price action, as a confirmed bullish reaction from key support zones is required before aligning with the prevailing trend.


