
Published: June 27th, 2023
T-Mobile US, Inc. (TMUS) has partnered with Google Cloud to expedite the development of 5G capabilities for the next generation.
By 2030, the global edge computing market is expected to attain a valuation of $155.9 billion, a significant increase from its current level. As the foremost provider of 5G networks in the United States, T-Mobile intends to leverage Google Distributed Cloud Edge capabilities to unlock a variety of use cases.
T-Mobile has also introduced the "magic mirror" in retail spaces in collaboration with Google Cloud. The "magic mirror" is an interactive display that provides real-time on screen information via interactive videos or product details when users hold the product in front of the mirror.
Also, T-Mobile is expanding its 5G deployment using Sprint's mid-band 2.5 GHz spectrum in an effort to encompass 99 per cent of the U.S. population. The company's business strategy involves providing 50 Mbps average 5G speeds to 90% of rural America, which is twice as fast as broadband.
TMUS competes across multiple price points in the consumer market, ensuring all customers, which might result in huge growth for the stock.
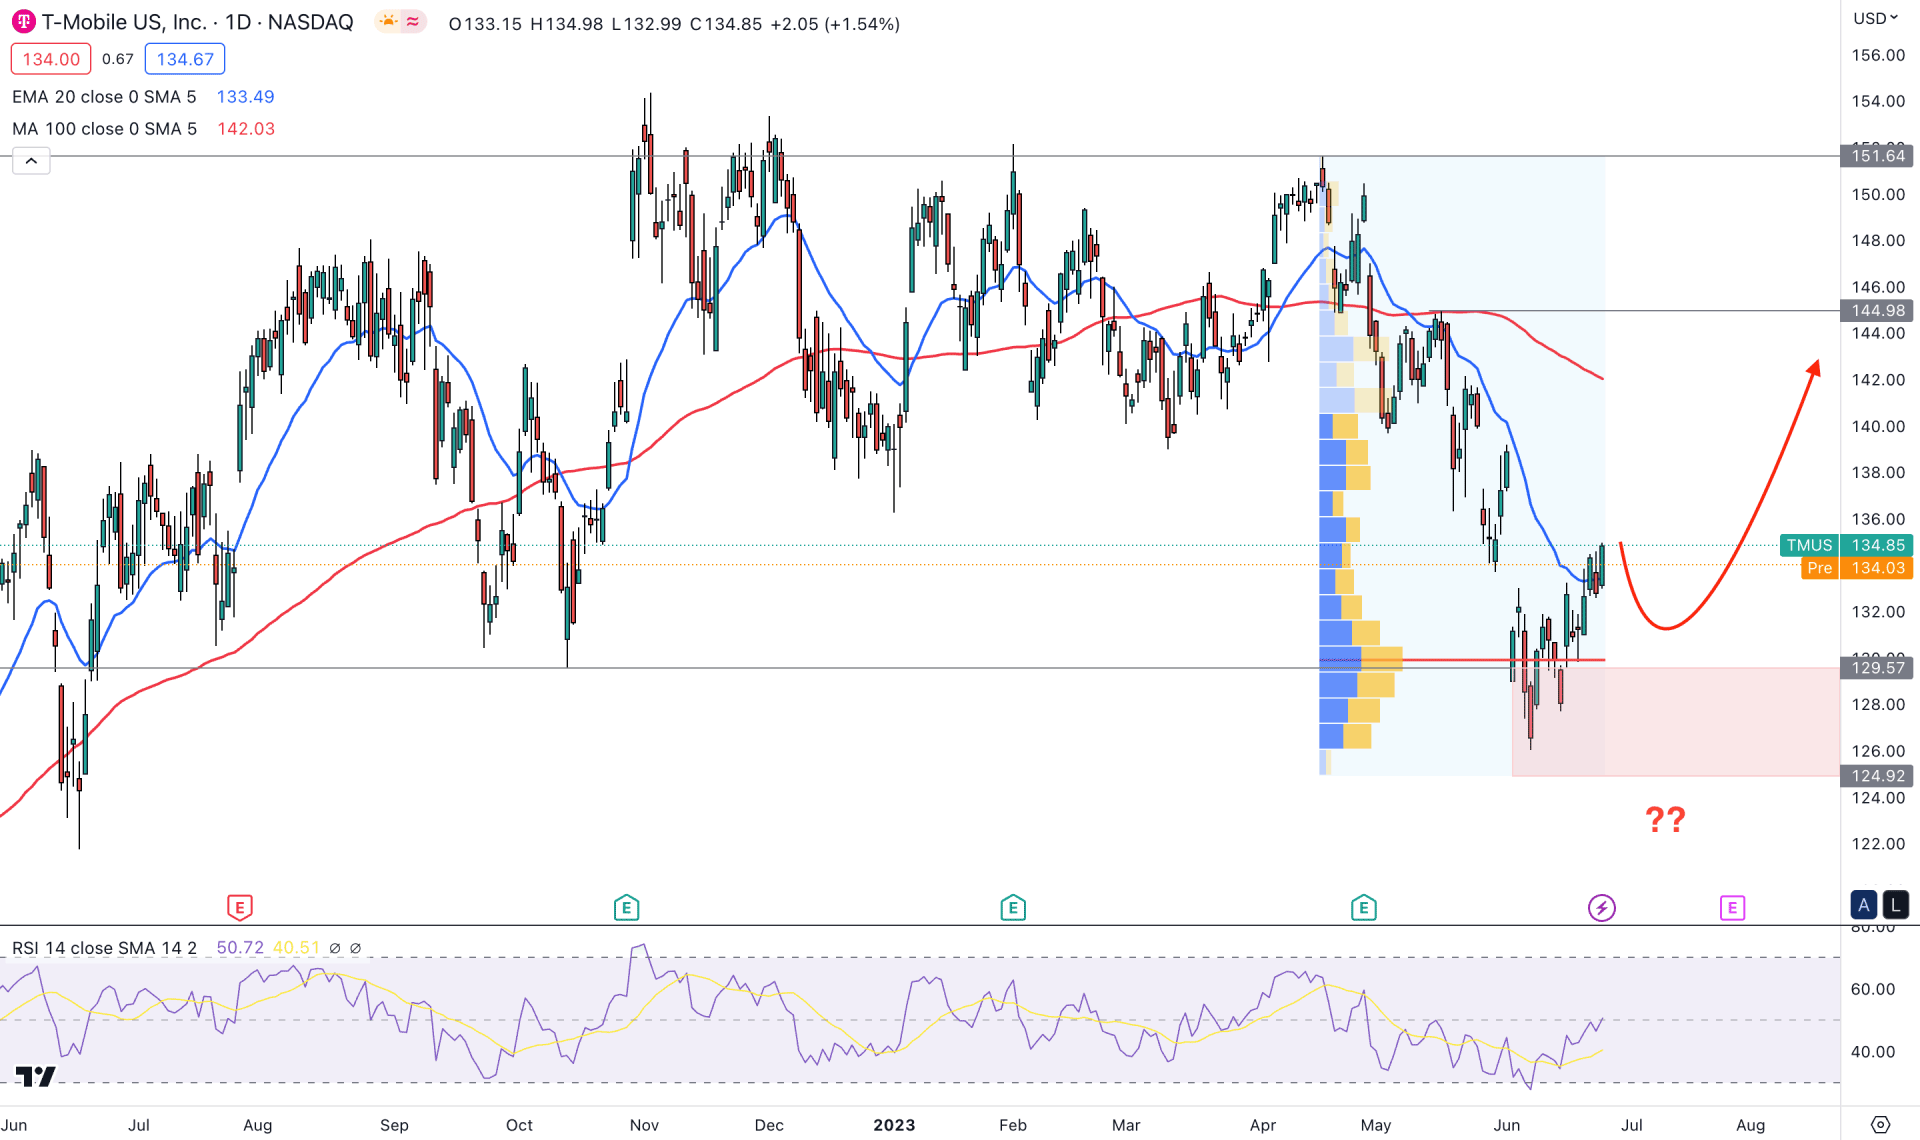
In the daily price of TMUS, the broader market outlook is corrective, where the recent price showed extensive selling pressure with the creation of a 2023 low. However, the price went extremely volatile after breaching the 13 October 2022 low, from where bullish exhaustion appeared. It is a clear sign that selling pressure faced a counter-push from bulls, which may result in a trend reversal.
According to the visible range high volume level, the current highest activity level was spotted at 129.86 level, which is at the exhaustion area. It is a sign that the buying pressure from the near-term bullish order block has buyer pressure. In that case, any short-term long opportunity might work as a potentially bullish signal for this instrument.
In the long-term outlook, the current 100-day SMA level is 5.4% higher than the current price, while the recent price formed a bullish D1 candle above the 20-day EMA. Based on this structure, the bullish trend might be established after moving above the 100-day SMA, while the current structure represents a need for a minor upside recovery.
If we look at the secondary window, we would see a U-shape reversal in the Relative Strength Index (RSI), where the current level is above the 50.00 line. It indicates that bulls are active in the market and can extend the buying pressure until the RSI reaches the 70.00 line.
Based on the current daily price outlook, TMUS price is more likely to increase the buying pressure in the coming days, where the current target level is the 100-day SMA. Moreover, a bullish break above this level could extend the price towards the 160.00 line.
On the other hand, the buying possibility is potent as long as the price holds momentum above the 129.57-124.92 demand zone. A break below the 124.00 level with a daily close could lower the price towards the 108.00 level.
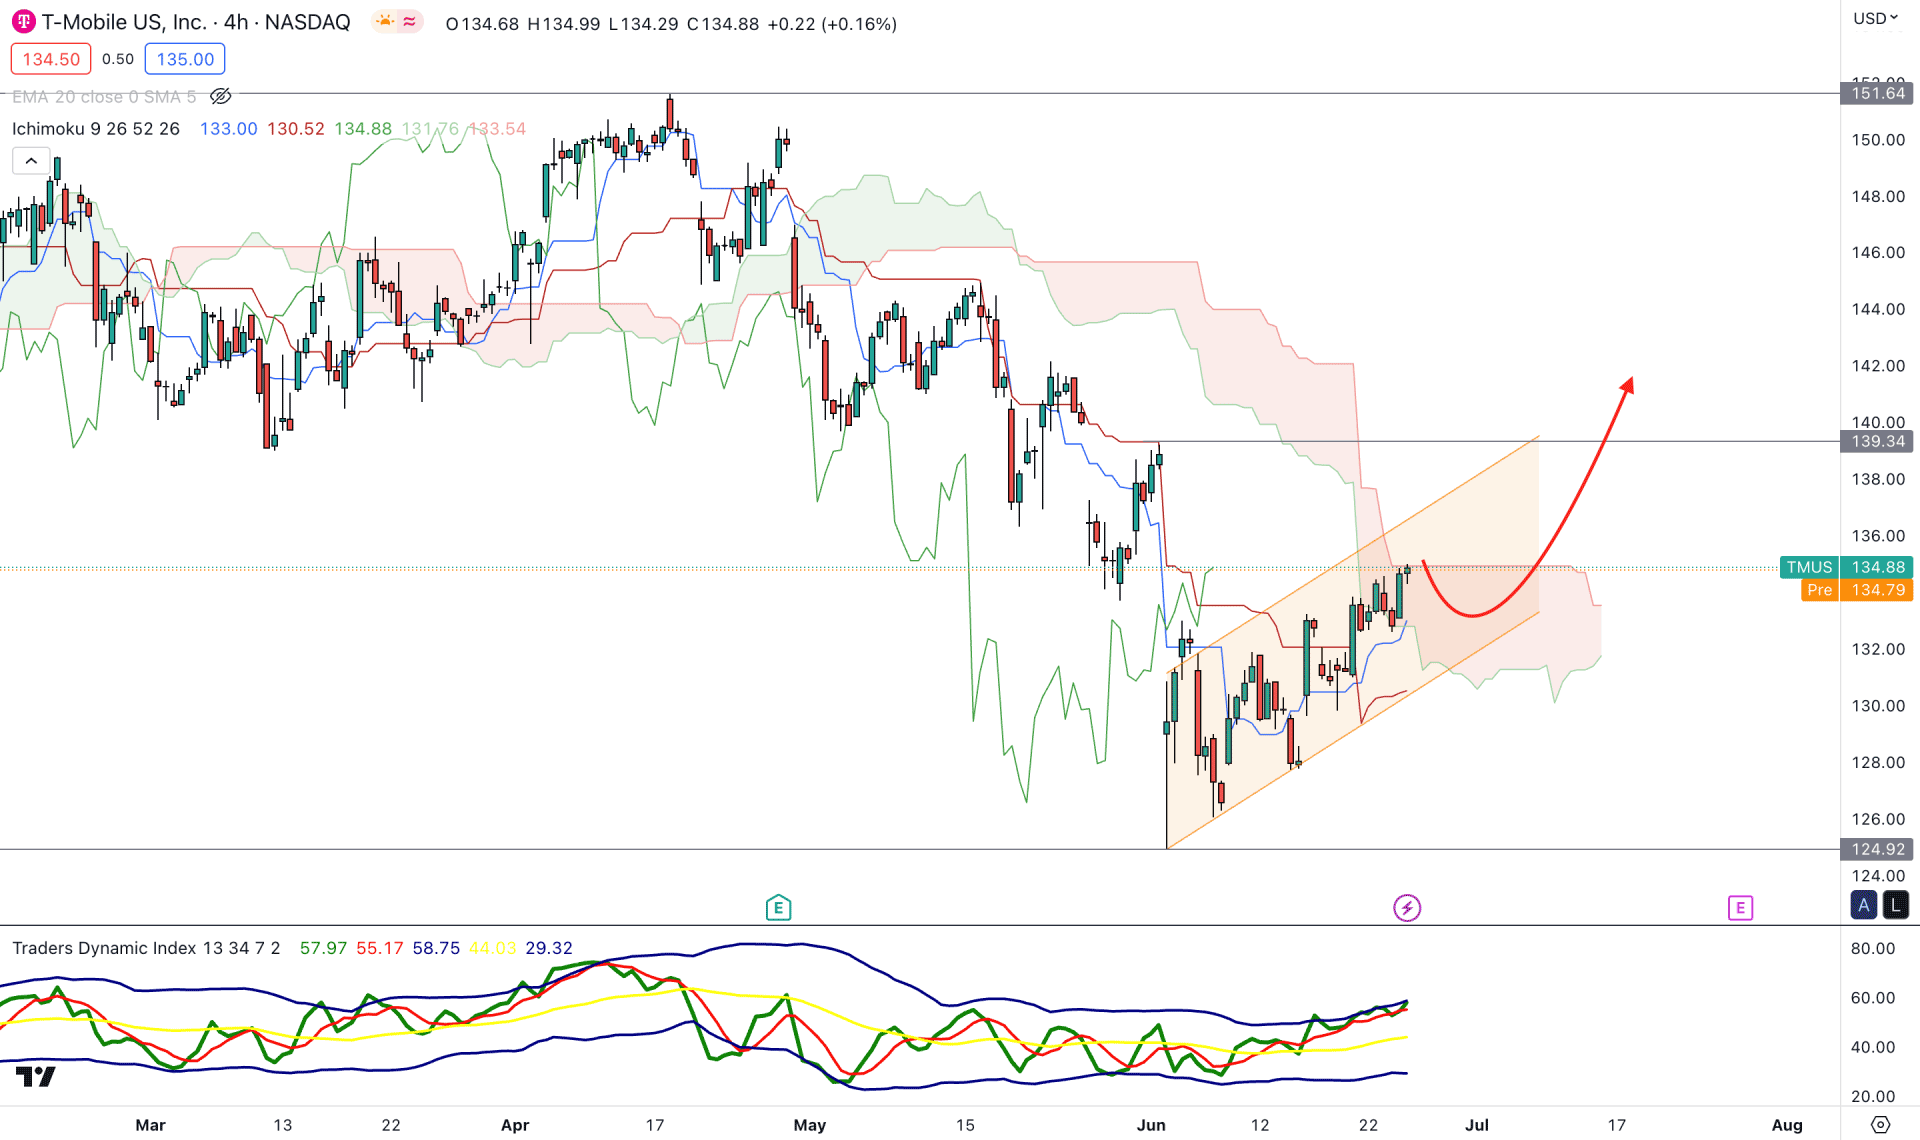
The broader market outlook is corrective in the H4 chart of TMUS, where the recent price faced strong selling pressure below the Ichimoku Kumo Cloud.
In the most recent chart, the price went sideways after making a new swing low at the 124.92 level from where an ascending channel is emerging. As per the current market context, a bearish break from the channel support could work as a bearish signal in this instrument.
In the future cloud, the downside possibility is still valid as the Senkou Span A is below the Senkou Span B. Moreover, the current TDI level is overbought, which signals a strong bullish momentum.
Based on the current market outlook, a bullish break above the 139.34 level is needed before considering the current outlook as bullish. On the other hand, a solid break below the Kijun Sen and Cloud support could work as a bearish signal for this instrument.
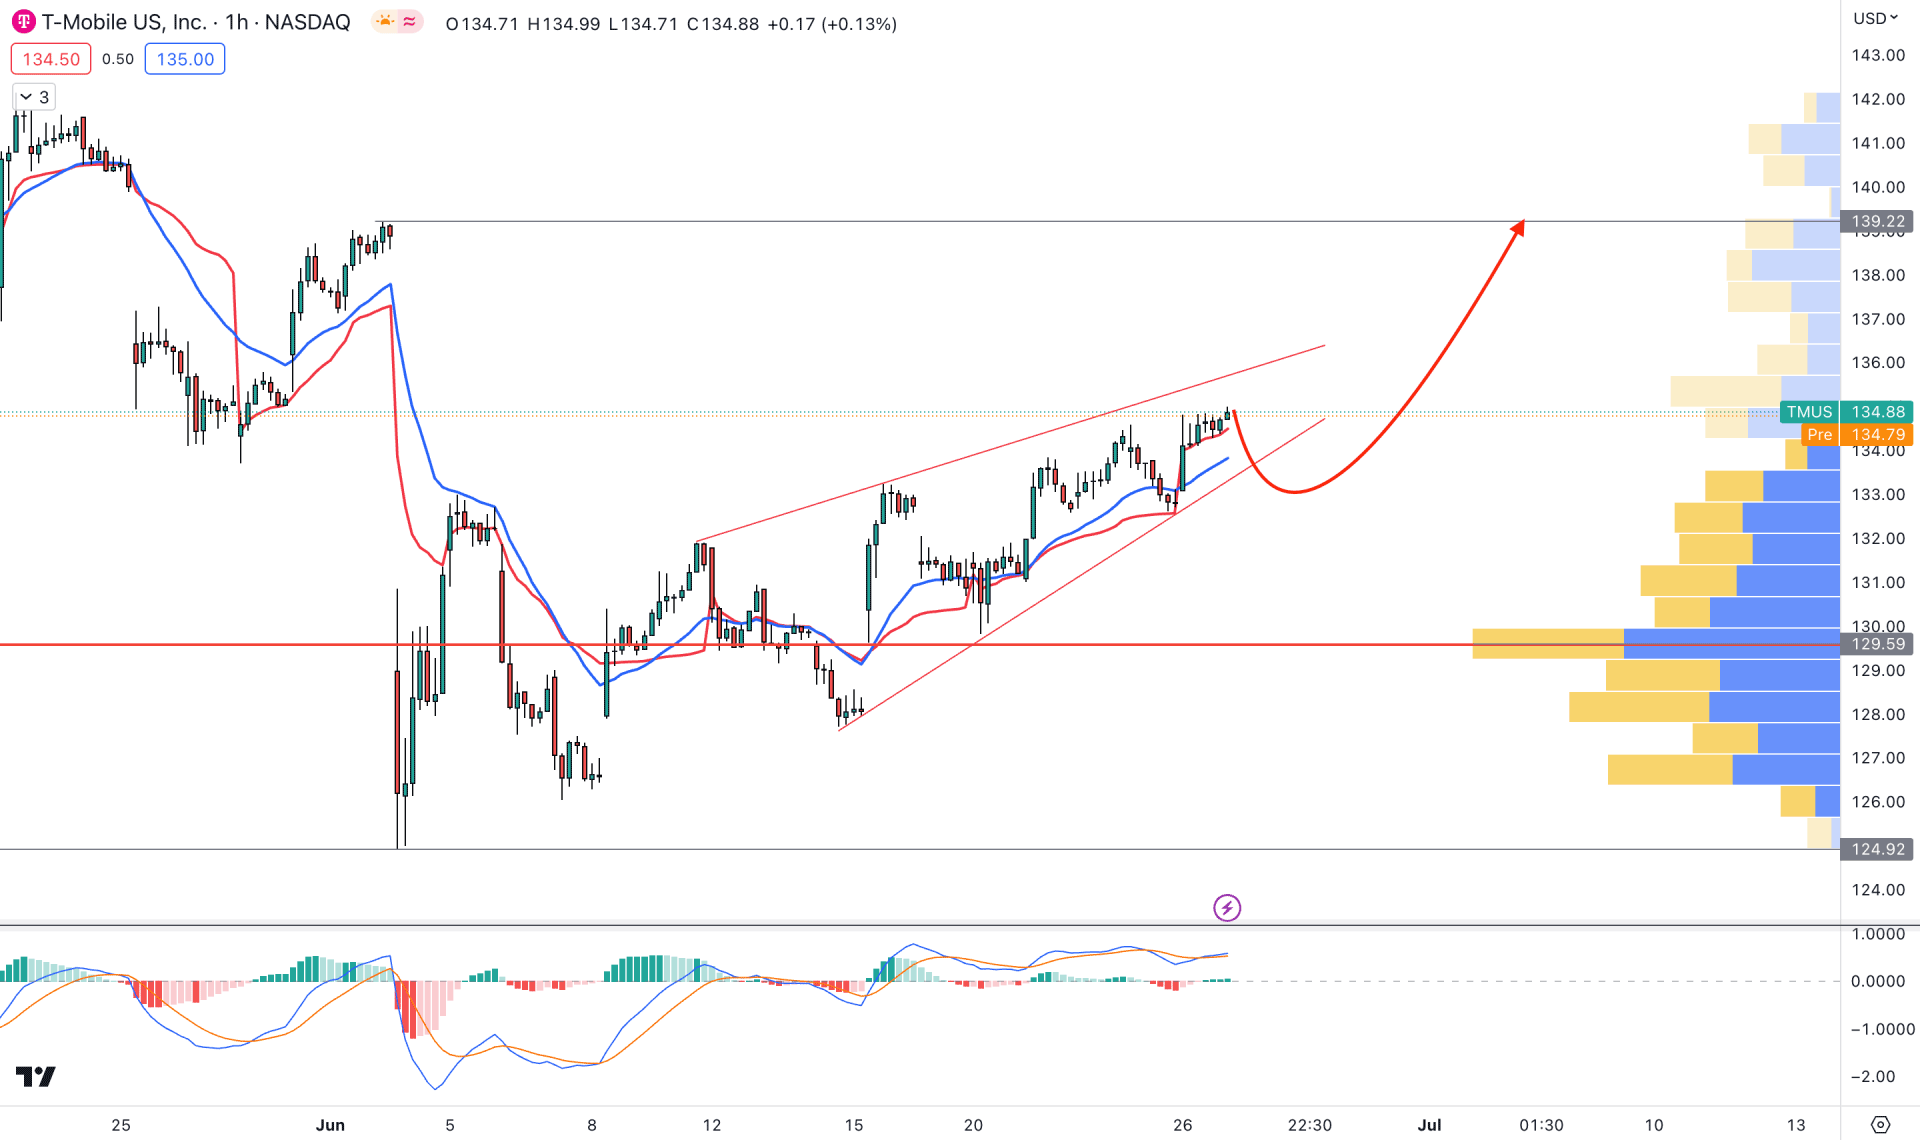
In the H1 timeframe, the current market outlook is bullish as the price is trading above the visible range volume level. However, a strong bearish pressure may come from the rising wedge pattern, allowing bulls to join the buying momentum from a discounted price.
The dynamic 20 EMA is the immediate support in this structure, where the current MACD Histogram is extremely corrective.
Based on this outlook, we may expect the buying pressure may extend after a solid recovery from the wedge breakout. However, breaking below the 124.90 level could eliminate the buying possibility and lower the price in the coming hours.
Based on this multi-timeframe analysis, TMUS has a higher possibility of extending the buying pressure in the coming days. Investors should closely monitor the intraday support levels from where a storing reversal might offer an early buying opportunity.


