
Published: February 10th, 2026
T-Mobile, Inc is scheduled to release its fourth-quarter 2025 results this week. The company exceeded all prior-quarter predictions with an earnings surprise of 7.02% in the most recently reported quarter, after delivering a profit surprise of 9.09% in the preceding four quarters.
Even as statewide connectivity and coverage have improved, T-Mobile still faces rising operating and capital expenses due to ongoing network expansion and upgrades.
T-Mobile's enterprise services were bolstered by the introduction of T-Platform and Edge Control during the quarter. However, the short-term revenue benefit may have been limited by slow uptake, high rollout costs, and fierce competition.
According to analysts' projections, full-service revenues could come in at $18.6 billion, higher than the $16.9 billion reported in the same period last year. Equipment revenues are expected to reach $5 billion, up from $4.7 billion in the same quarter last year.
Compared with the announced $21.9 billion for the same quarter last year, the analysts' Consensus Estimate for total sales for the period ending in December is $23.6 billion.
Let's see the further outlook of this stock from the TMUS price analysis:
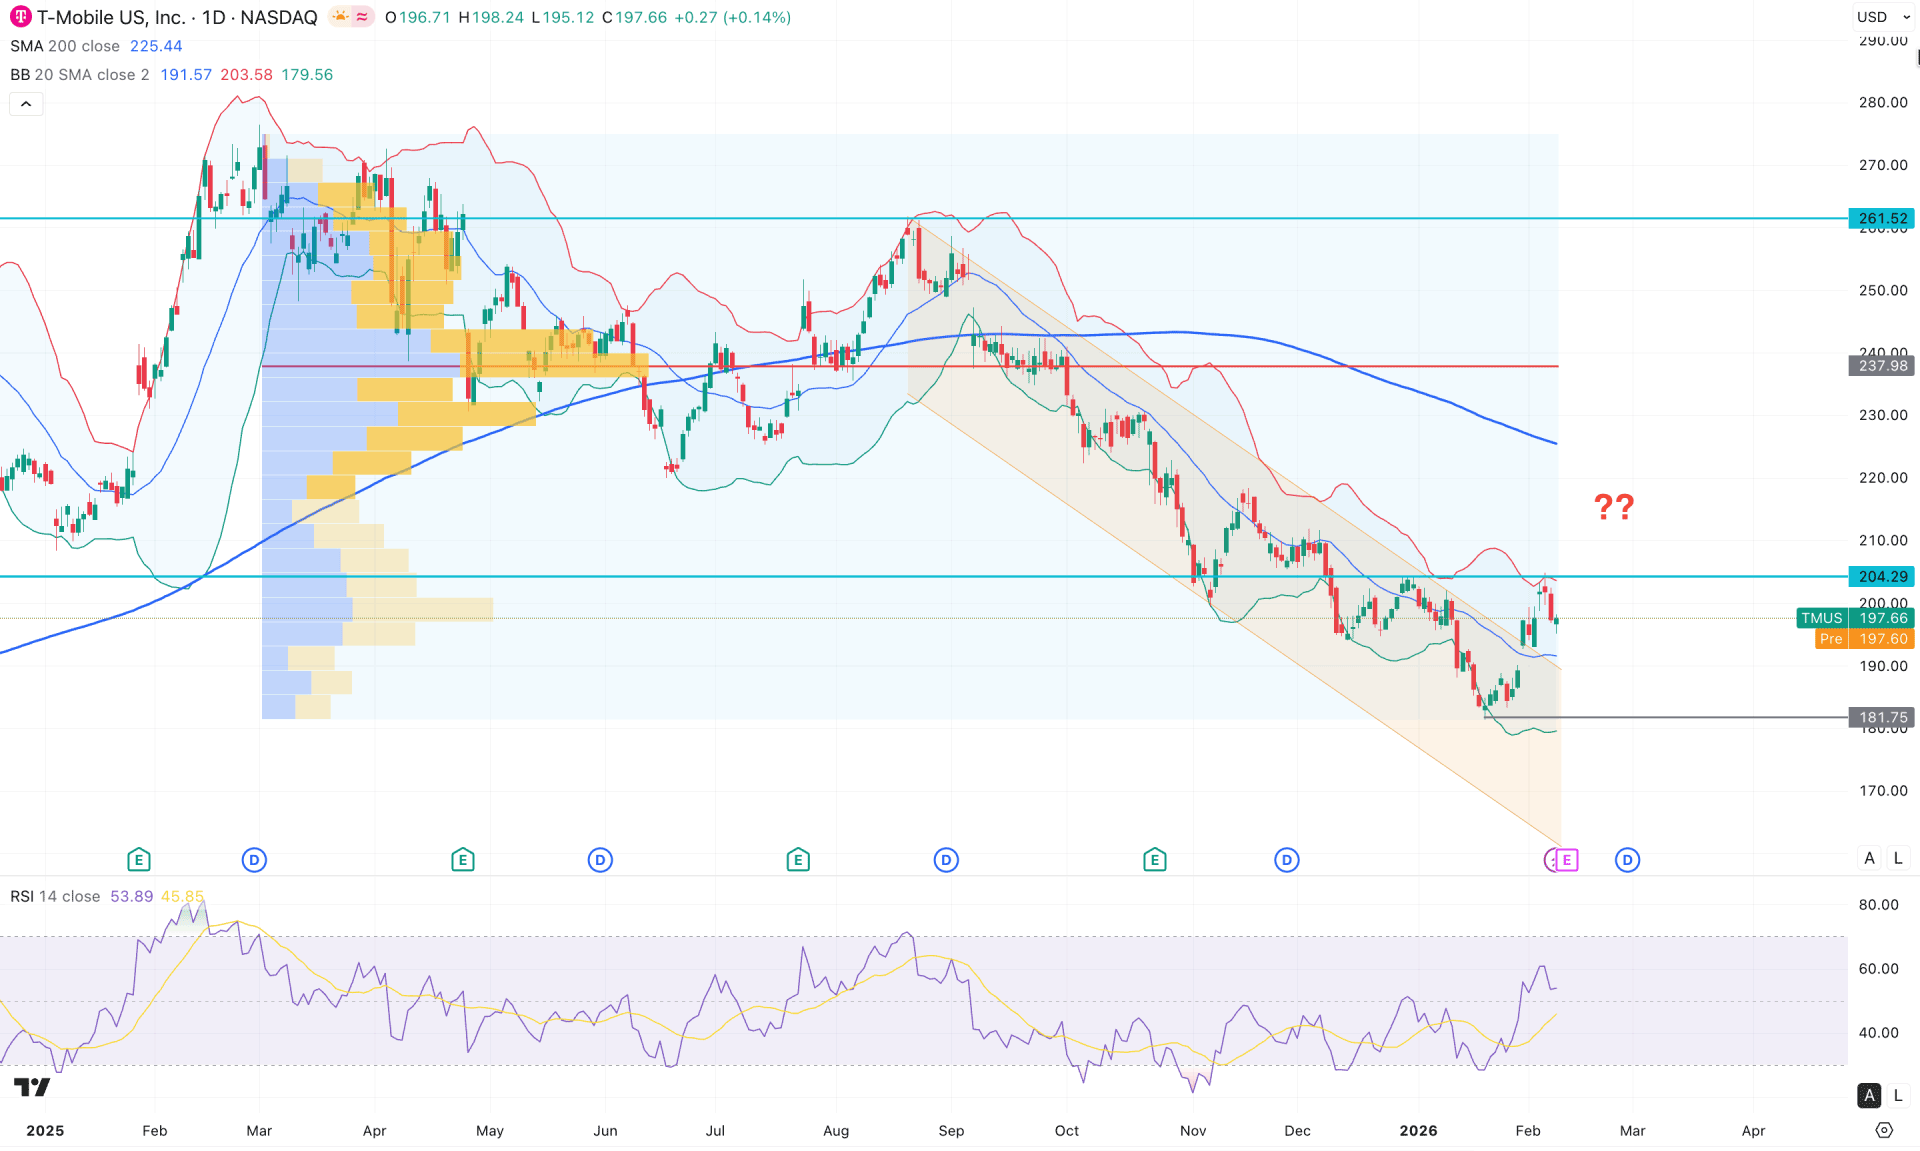
In the daily chart of TMUS, the recent price shows an extended selling pressure, creating a bearish rally within a descending channel. As the most recent price formed a buying pressure at the bottom, more confirmations are needed before anticipating a bullish wave.
In the monthly timeframe, the price shows an extended volatility after making consecutive five bearish months. With bullish momentum, any sign of a bottom formation could resume the trend. The weekly timeframe remains bearish, with the weekly resistance at 204.29 still intact.
In terms of volume, the bullish momentum has faded. The highest activity level since March 2025 is above the current price, signalling high volume at the top. As the recent price is trading well below the high-volume area, a minor upward correction is pending as a mean-reversion move.
In the main price chart, a bullish V-shape recovery is present from the 181.75 low, suggesting a possible bottom formation. However, the 204.29 resistance level remains unbroken and must be broken before the bottom can be validated.
According to technical indicators, the price is trading between the upper and mid Bollinger Bands, indicating a premium trading zone. Moreover, the 200-day Simple Moving Average is above the entire structure and serves as major resistance.
In the indicator window, the Relative Strength Index (RSI) has rebounded from the 30.00 oversold line, signalling a solid bullish recovery. Still, the RSI is hovering above the 50.00 neutral line, where an additional surge above the 70.00 overbought area is possible.
Based on the overall market structure, the 204.29 resistance level is a crucial price to look at . As long as the current price hovers below this line, the primary aim would be to look for short trades only. A valid rejection from the Upper Bollinger Bands line increased the possibility of taking the price lower and testing the 181.75 low.
On the other hand, an immediate bullish reversal with solid price action above the 205.00 level could increase the long possibility. In that case, the primary aim would be to test the 237.98 high-volume line. Moreover, a stable price above the 220.00 psychological line could increase the bullish possibility towards the 261.52 resistance level.
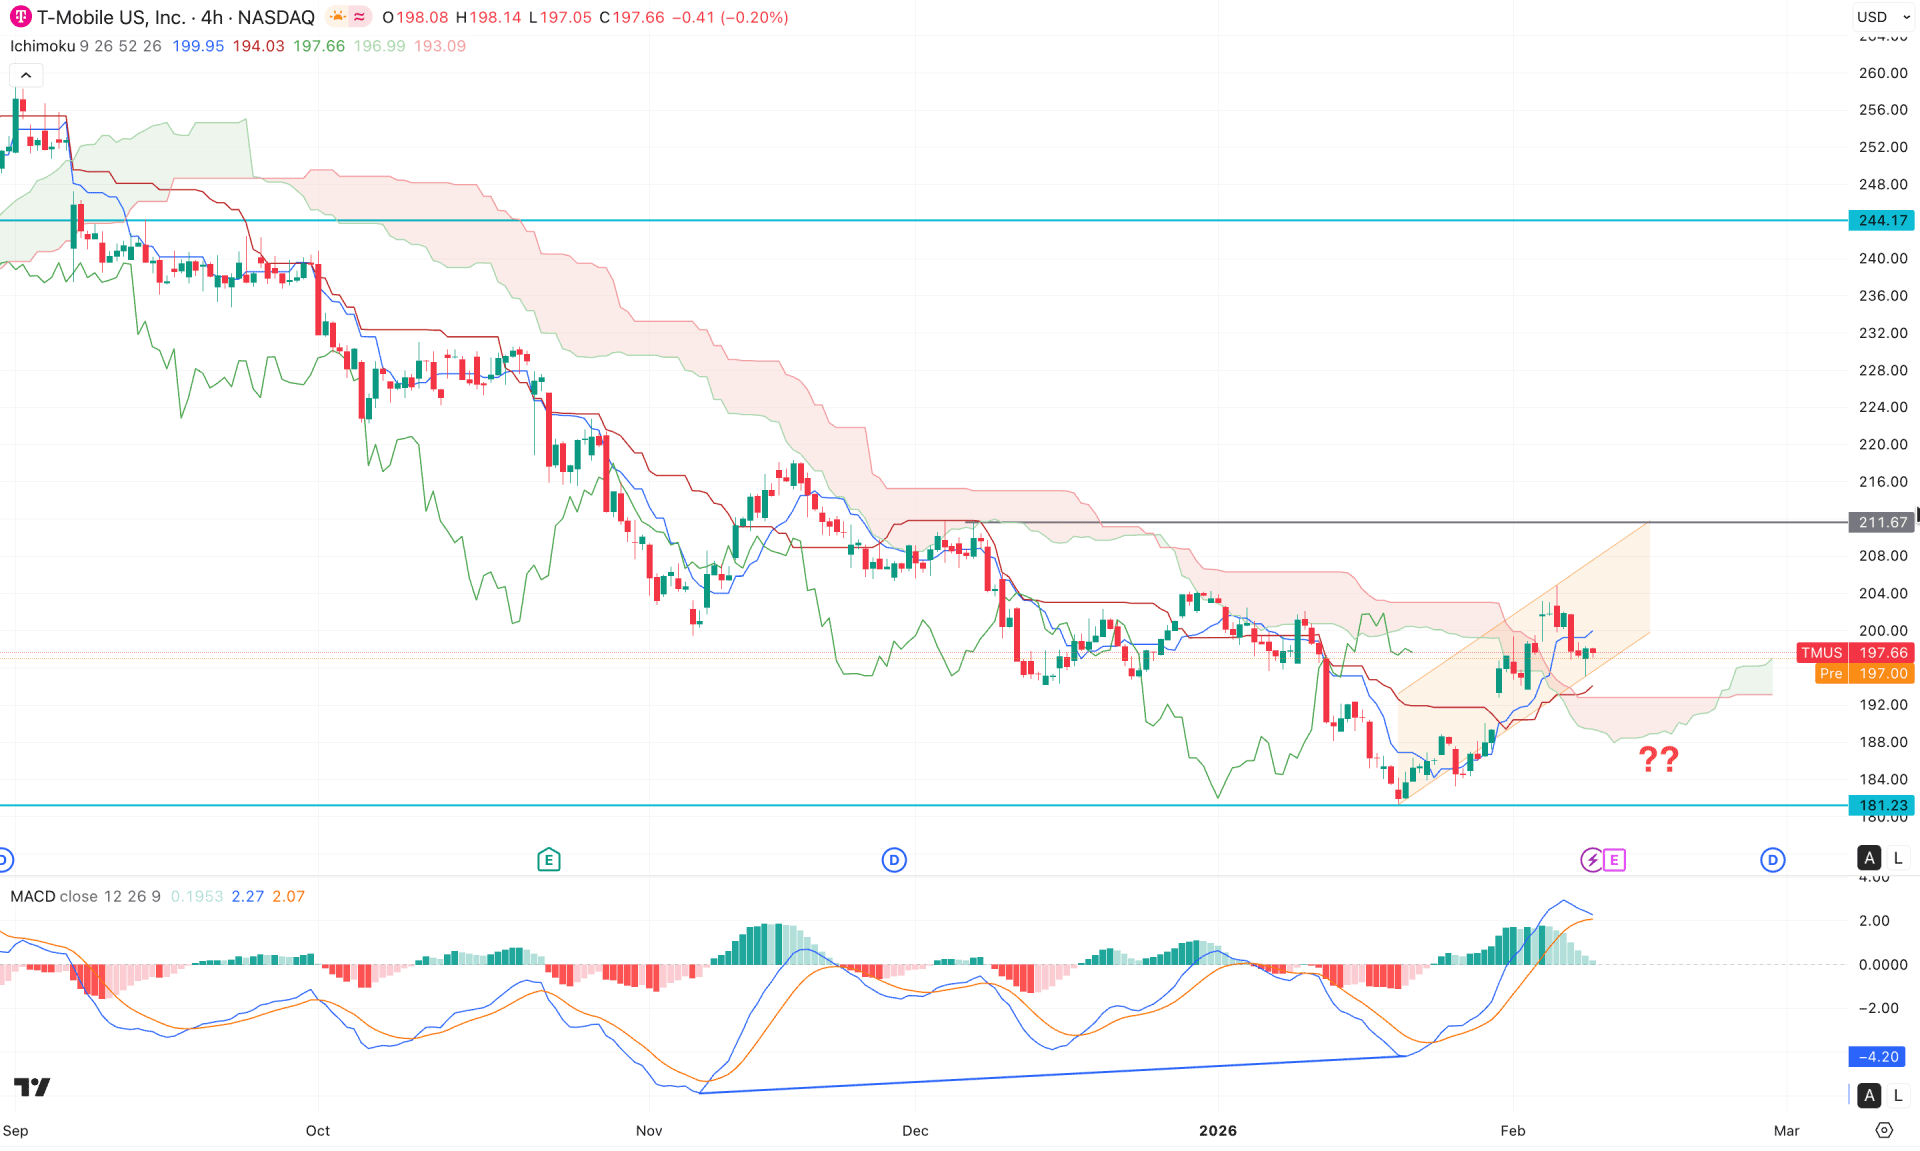
On the H4 timeframe, the most recent price action shows a bullish break above the cloud area for the first time since September 2025. This signals a potential primary recovery from the bearish trend; however, a bullish rebound has not yet been fully confirmed. The ongoing buying pressure remains within an ascending channel, and the current price is finding support at its lower boundary.
On the other hand, the future cloud has flipped, with Senkou Span A moving above Senkou Span B. This indicates an hourly bullish recovery, though further confirmation from the dynamic lines is still needed.
In the secondary indicator window, a potential divergence is visible on the MACD indicator. Moreover, the signal line is hovering above the neutral level with sideways momentum, while the histogram remains near the neutral point.
Based on this outlook, the price is trading within a corrective area, from which a minor bullish recovery is possible as a range extension. Therefore, a bullish four-hour close above the Kijun-sen level could push the price toward the 211.6 resistance level.
Conversely, the major market trend remains bearish, and the minor buying pressure around the cloud area is not sufficient to confirm a bullish rebound. Any immediate selling pressure, accompanied by a bearish four-hour candle closing below the cloud low, could resume the existing downtrend and create a new support level below the 181.23 low.
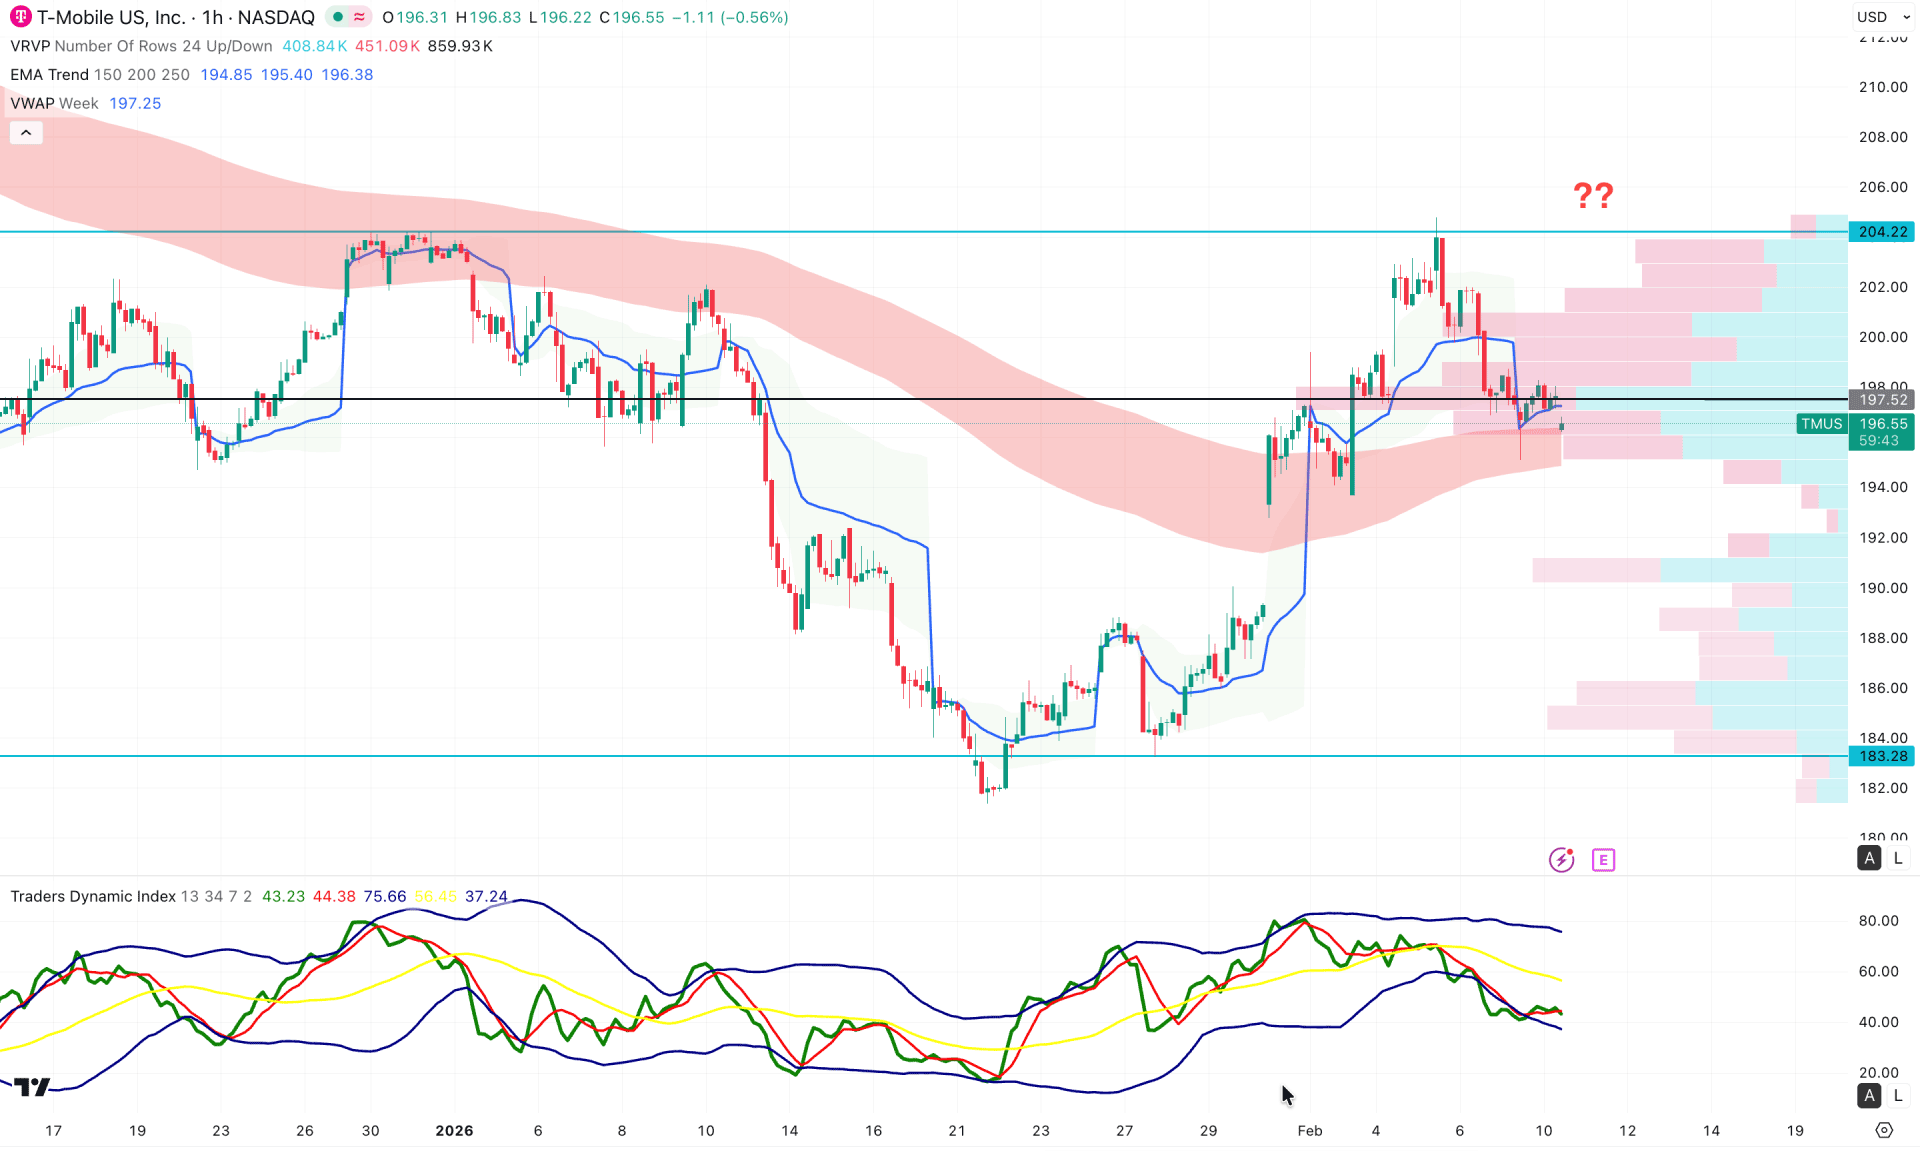
On the lower timeframe, recent price action is bearish after peaking above the 200.00 psychological level. As the most recent price has rebounded from intraday resistance, a minor downside correction is expected.
The intraday high-volume line is close to the current price, with significant selling pressure near the top. Moreover, the weekly VWAP is near the current price, along with the exponential moving average wave. This suggests order building within the price, which could lead to impulsive momentum.
In the indicator window, the Traders Dynamic Index has rebounded and reached the lower peak area, signaling extreme selling pressure in the market.
Based on this structure, investors should closely monitor how the price trades around the current area. A bearish break below the exponential moving average zone could create a short opportunity targeting 186.0.
On the other hand, a minor rebound above the 192.00 level, followed by a strong bullish move above the VWAP, could create a high-probability long opportunity targeting the 210.00 level.
Given the overall market structure, TMUS is trading sideways while broader market momentum remains bullish. Investors should closely monitor the intraday price structure, as a potential bottom formation is required before validating a descending channel breakout on the daily chart. Overall, a confirmed bullish breakout with sustained price action above 204.29 could create a long opportunity.


