Published: July 25th, 2023
Synthetix's recent price increase can be attributed to optimistic market sentiment and rising adoption. Nevertheless, despite its impressive performance, it trails behind InQubeta's demand.
Synthetix, a notable participant in the decentralized finance (DeFi) industry, operates as a decentralized liquidity protocol on both the Optimism and Ethereum mainnets. The platform enables users to construct and trade Synths, which are synthetic digital assets representing real-world assets and provide exposure to a variety of conventional instruments. With its extensive liquidity, novel concept, and low fees, Synthetix has attracted considerable interest and recently experienced a surge in popularity.
Kain Warwick, the founder of Synthetix, announced plans for a new decentralized exchange (DEX) dubbed Infinex, which will directly compete with centralized exchanges (CEXs). Simultaneously, Uniswap introduced the UniswapX protocol, which enables gas-free swaps, MEV protection, and cross-chain switching, among other enhancements.
Infinex's primary objective is to optimize the front-end user experience by simplifying the registration procedure. The complexities of DEX operations are hidden from consumers to ensure a seamless experience.
Let's see the upcoming price direction of this token from the SNX/USDT technical analysis:
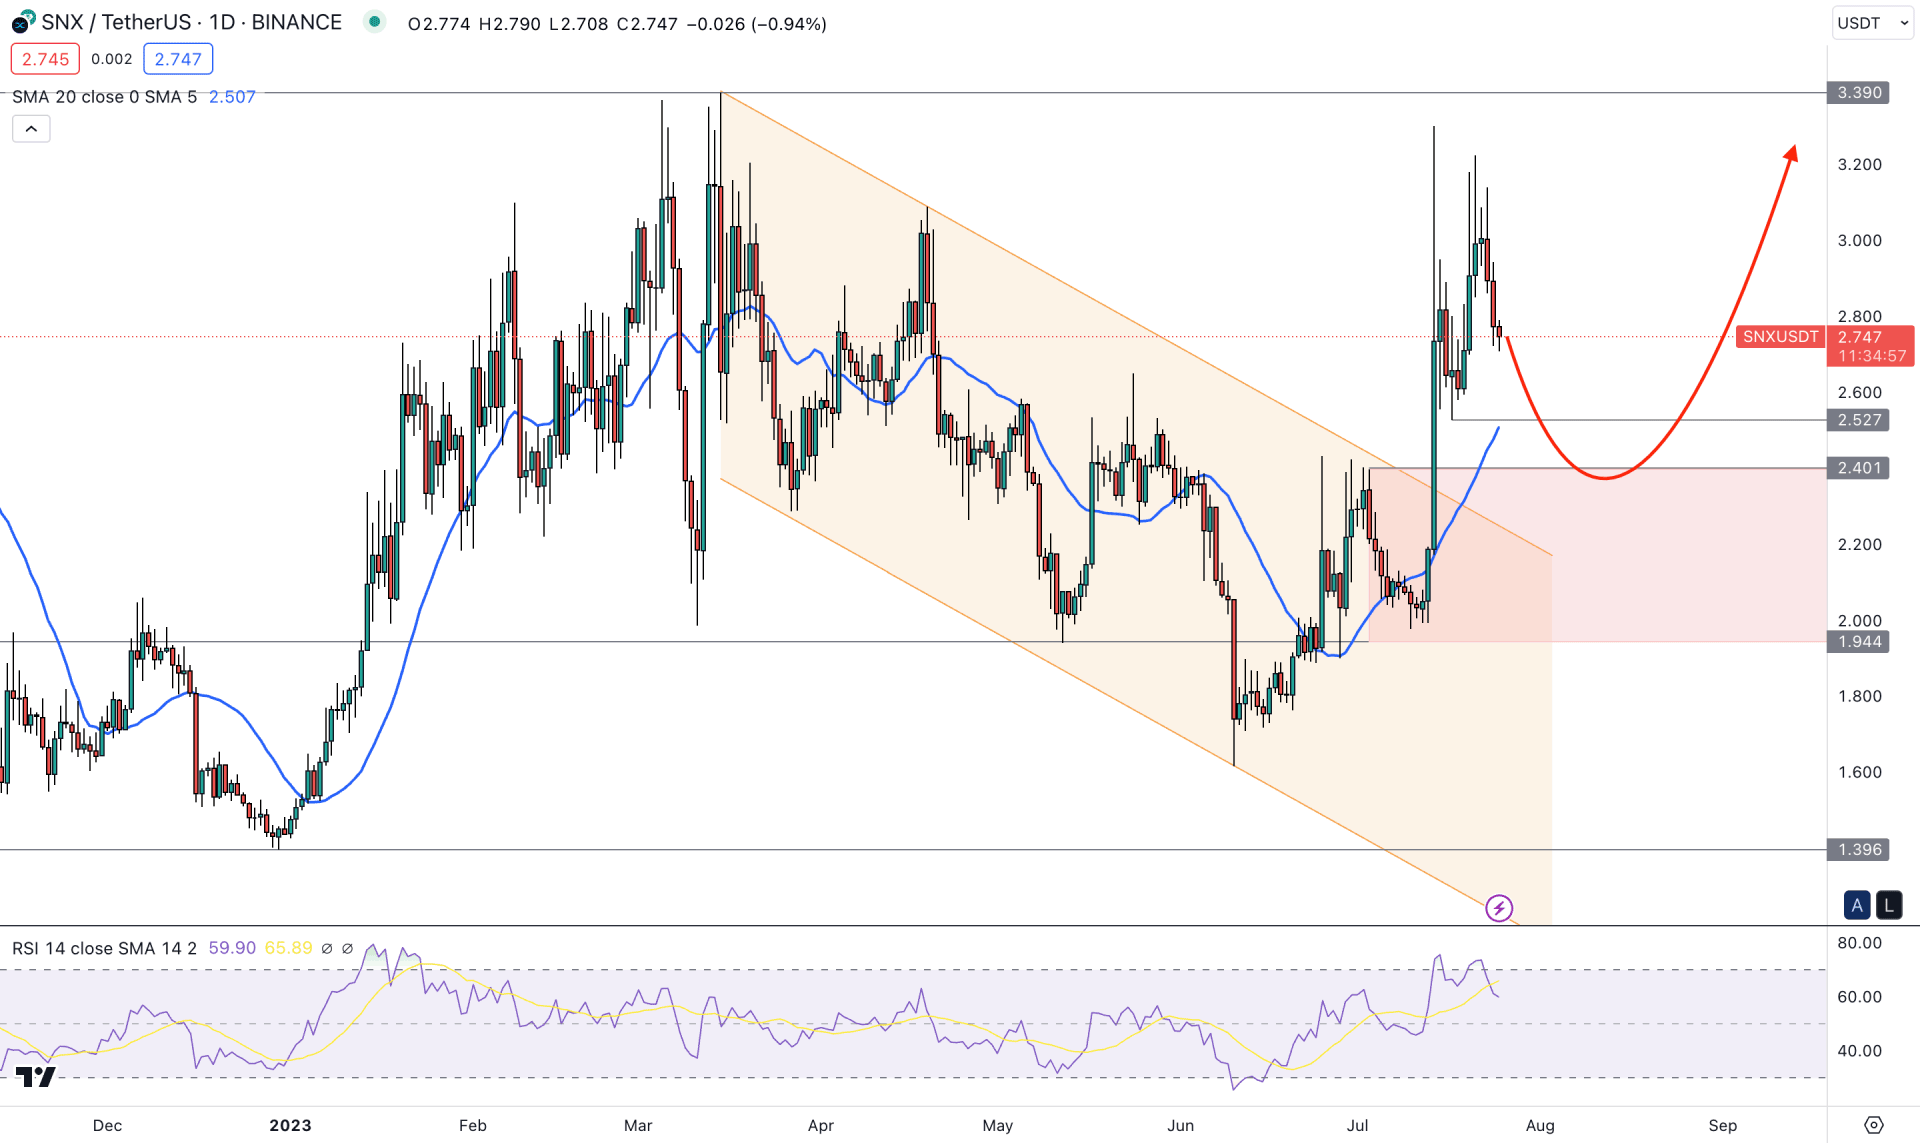
In the daily price of SNX/USDT the broader outlook is strongly bullish as the recent price formed a sell-side liquidity grab with a bullish break of structure. In this context, the ideal trading approach is to look for long trades only once a considerable correction is over.
A clearer view of the range formation is visible on the weekly timeframe, with much free space for the instrument to move higher. Moreover, the current monthly candle came bullish after three consecutive corrective candlesticks, which could result in new impulsive pressure.
Coming to the daily price action- the current price is trading higher from the descending channel breakout, with a possibility of a decent bullish trend continuation opportunity.
The impulsive pressure from the 1.194 sweep zone in the daily price came with an imbalance formation. Therefore, the bearish correction may come below the 2.517 support level and hit the imbalance area before forming another swing high. Also, a critical demand zone is spotted at the 2.401 to 1.194 area from where buying pressure may come.
The current buying pressure is stable above the dynamic 20-day Exponential Moving Average level, which indicates a stable upward pressure. Moreover, the Relative Strength Index (14) came down from the 70.00 overbought level, which is a sign of a possible bearish correction in this instrument.
Based on the daily price outlook, any bullish pressure from the 2.401 to 1.194 area could be a valid buying opportunity in this instrument. The primary target of the upward pressure is at the 3.390 level, but a daily candle above this level might extend the momentum towards the 6.00 level.
On the other hand, downside pressure is potent, where a new bearish D1 candle below the 1.1900 level could lower the price toward the 1.1396 level.
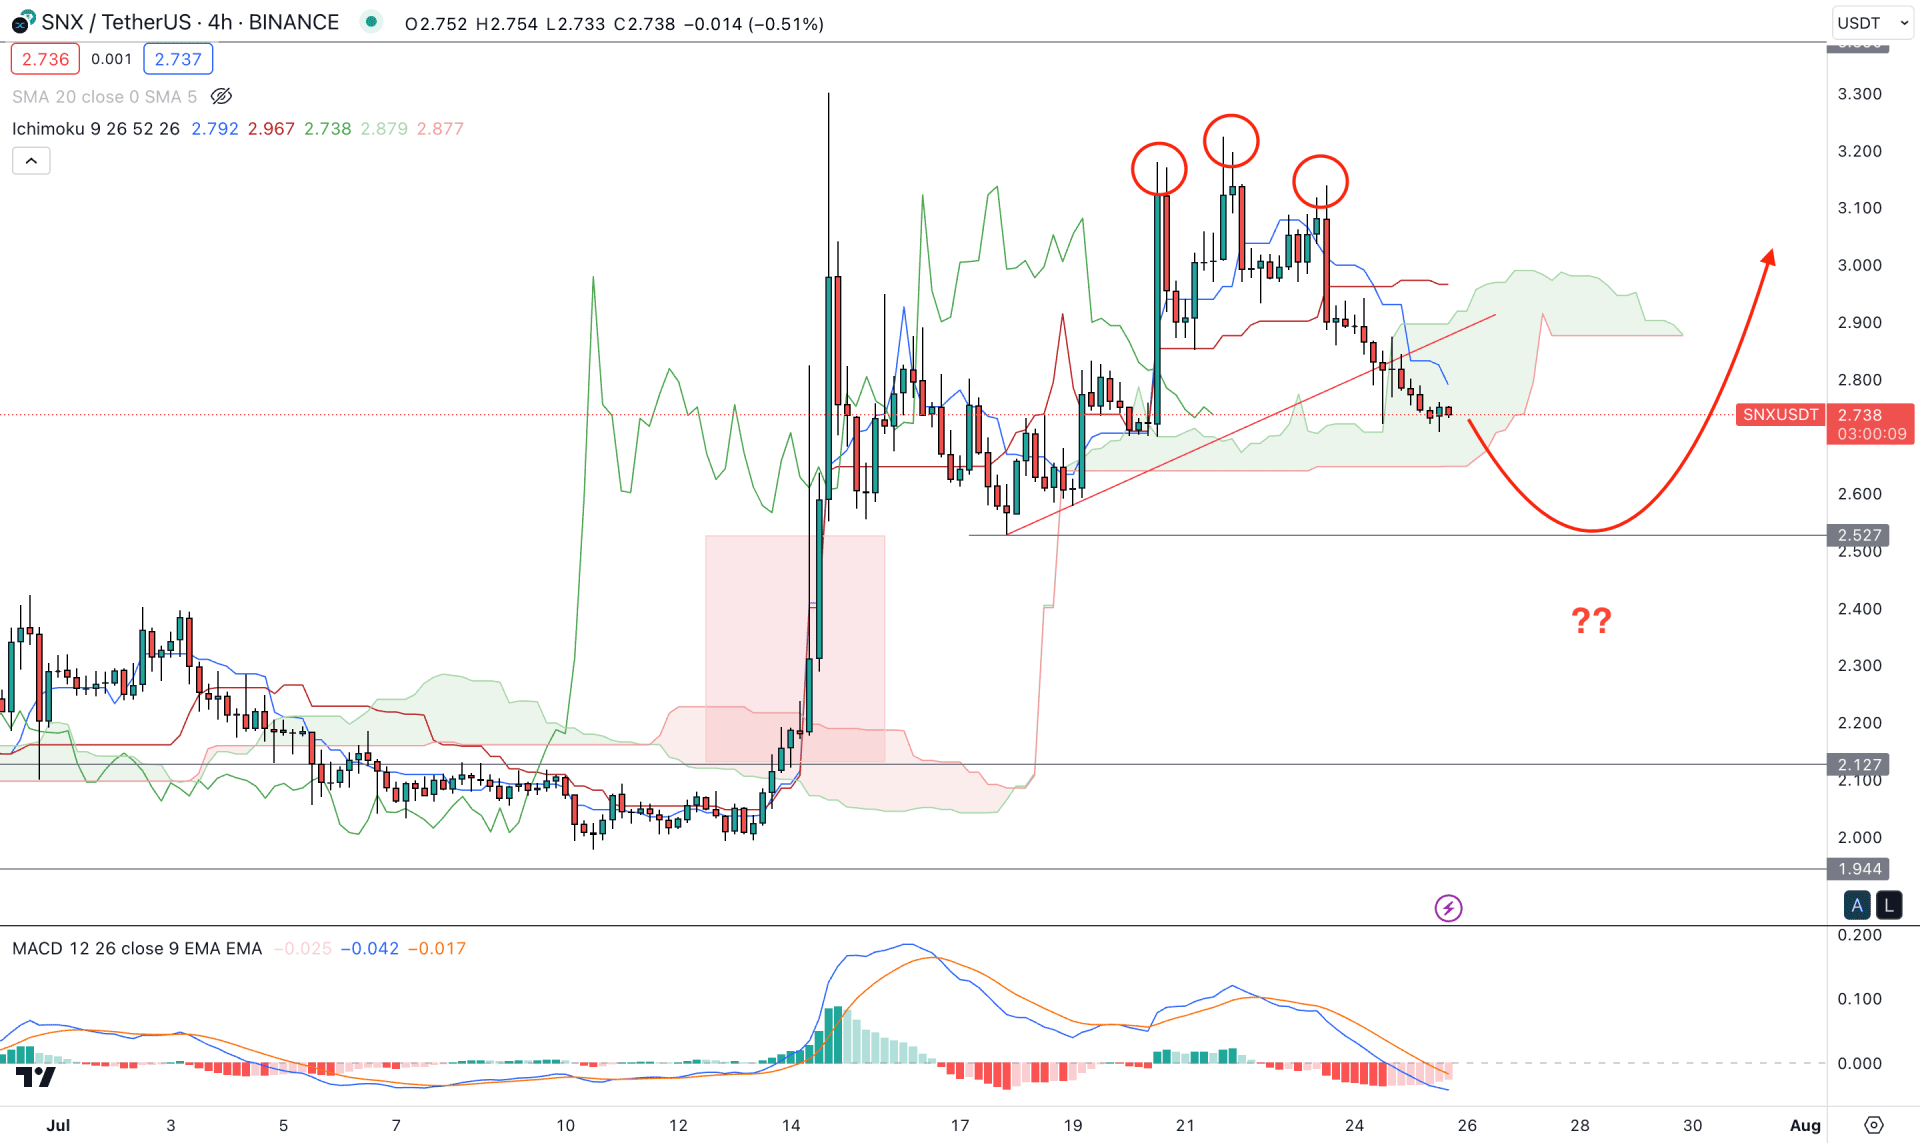
In the H4 timeframe, the broader outlook is corrective as the current price trades within the Kumo Cloud with a bearish reversal formation.
The price formed a bullish continuation pattern after the impulsive bullish pressure above the cloud area but failed to hold the momentum. Later on, a Head and Shoulders formation appeared with a potential trendline break toward the sellers' side.
In the future cloud, the Senkou Span A and B are closer together, which is a sign of corrective price action. Moreover, an early sell signal has come from the MACD Histogram, which moved below the neutral level.
Based on the H4 structure, downside pressure is potent, which may extend toward the 2.527 support level. Moreover, a strong price inefficiency area is present below the current support from where a bullish rejection may come. In that case, a new H4 candle above the Kijun Sen could increase the price towards the 3.200 psychological level.
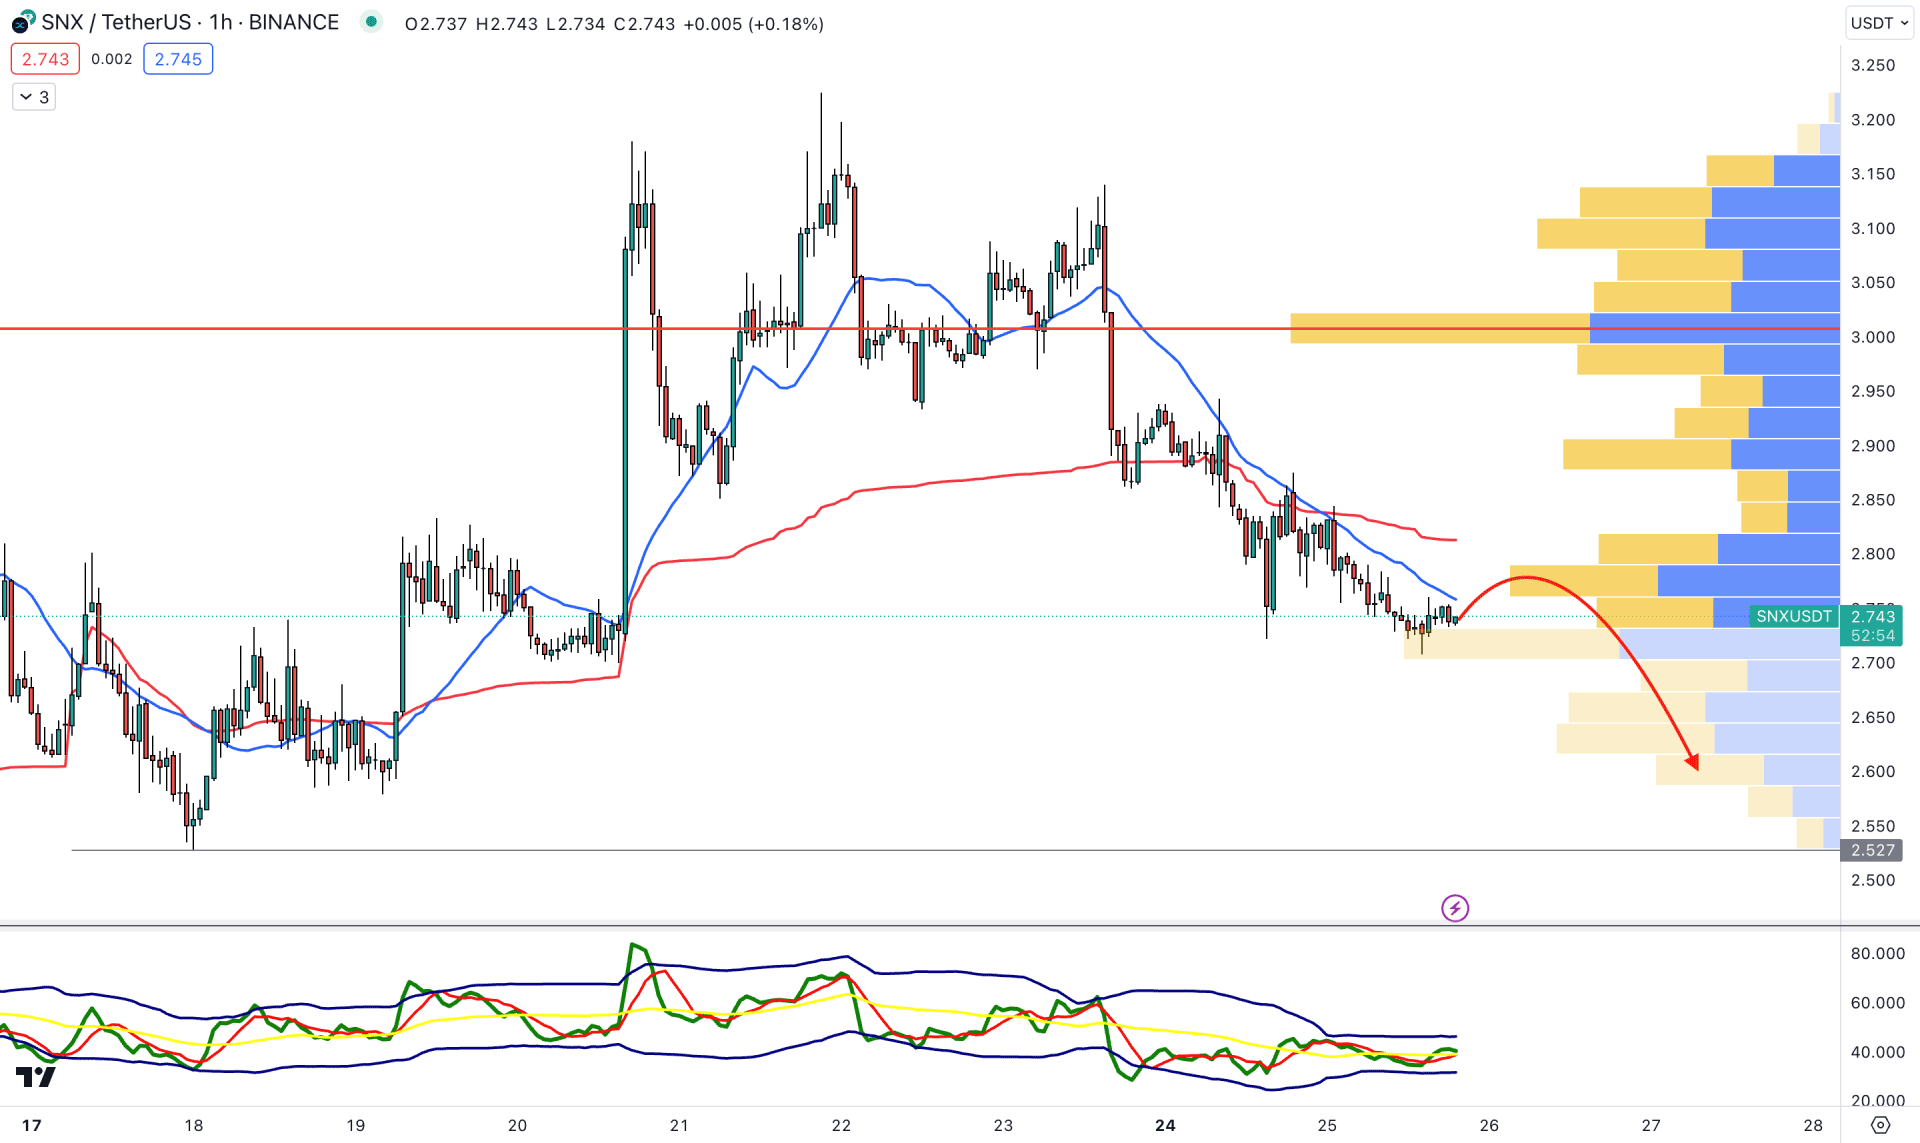
In the hourly chart, the current price is trading below the visible range high volume level, which signals that the broader market context is bearish for this token.
A bearish crossover is seen between dynamic 20 EMA and weekly VWAP, while the current Traders Dynamic Index indicator shows a sideways movement.
Based on this structure, investors might expect the bearish pressure to continue in the coming hours, where the main aim is to test the 2.527 level.
On the other hand, the bullish recovery with an H1 candle above the 3.00 key psychological level could limit the downside pressure at any time.
Based on the current market outlook, SNX/USDT price could extend the upward pressure in the longer term. However, a minor downside correction is pending, and investors should wait for a valid price action before anticipating the bullish trend continuation.


