Published: May 27th, 2026
As it continues to argue that its chip layout software and technology are critical to the advancement of artificial intelligence, Synopsys will release its second-quarter profits this week. However, integrating a significant purchase from the previous year is the immediate priority.
Upon $2.25 billion in sales, Wall Street analysts predict adjusted profit per share of $3.15, down from $3.67. Comparisons to the previous year are not very meaningful because of the $35 billion purchase of physics simulation software company Ansys in July 2025.
In its last quarter as a stand-alone business, Ansys had sales of almost half a billion dollars. Ansys accounts for over 30% of Synopsys' projected $9.6 billion in overall sales for the entire fiscal year.
Similar to rival Cadence Design Systems, Synopsys produces both hardware that evaluates the designs before they are sent to the supplier and software that automates the extremely complicated process of developing circuits. Leading AI chip manufacturer Nvidia owns a 2.5% share in Synopsys and is a customer.
However, Synopsys has not yet benefited greatly from the expansion of standard sized chips for the AI era; organic revenues are still not increasing at the same rate as they did throughout its last boom phase, in 2022.
Let's see the future price projection from the SNPS technical analysis:
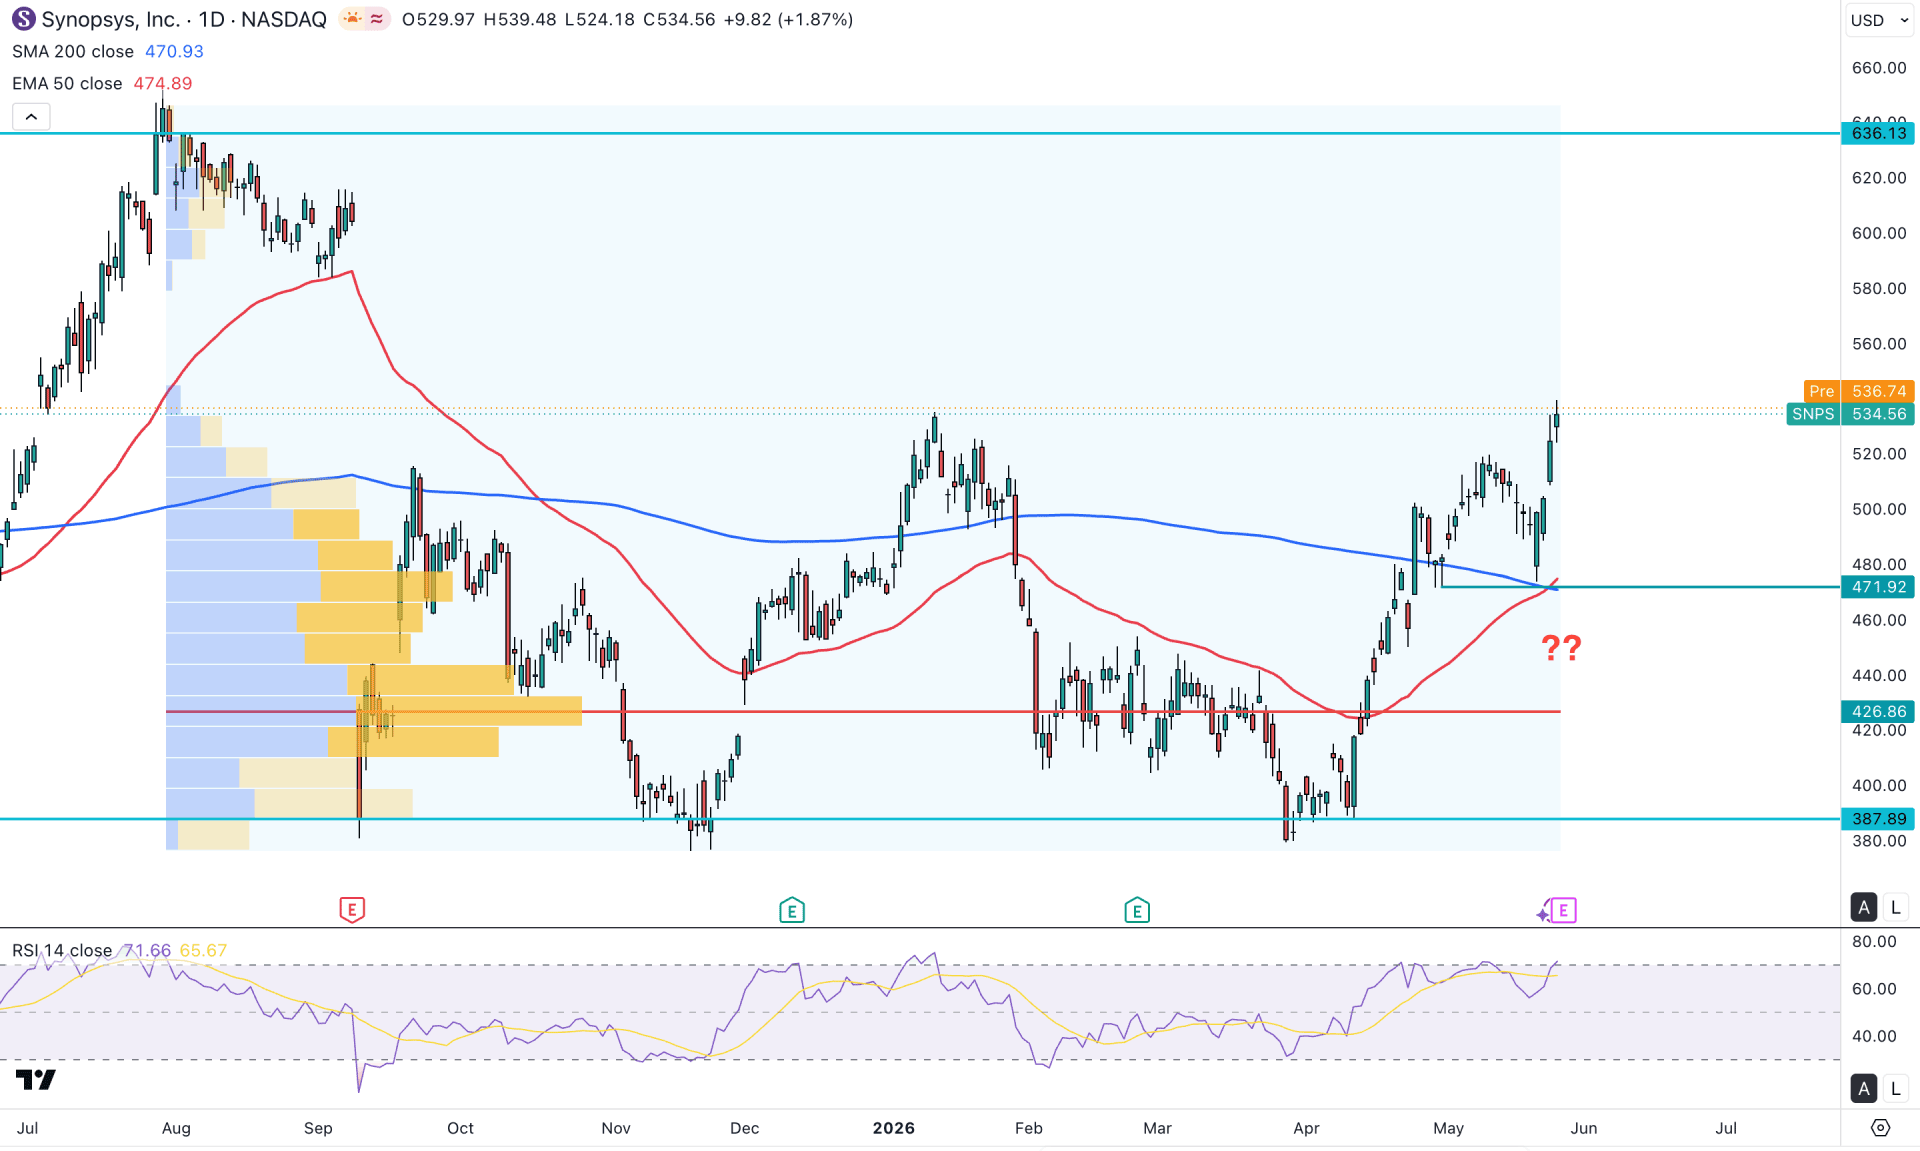
In the daily chart of Synopsys Inc stock (SNPS), the broader market momentum is corrective where the recent price rebounded from a valid bottom with a decent market recovery from the March 2026 low. As the price shows buying interest after moving beyond the 500.00 psychological line, the primary anticipation is to look for long trades only.
Looking at the higher timeframe, the monthly chart suggests an ongoing buying pressure following the extended volatile structure. A bullish monthly continuation is seen after having a strong buying pressure from a valid range breakout. The buying pressure is supported by the weekly price action, for the recent weekly candle is still bullish at the resistance area.
In terms of the volume, the buying pressure is valid as the largest activity level since July 2025 is below the current price. However, the price reached the crucial resistance level, which is at 12 January 2026 high.
The 200-day SMA line is below the current price with an ongoing bullish crossover bar with the 50 day EMA. Primarily, this is a sign of a Golden Cross formation, which is a strong bullish signal.
In the secondary indicator, the Relative Strength Index (RSI) shows buying pressure as the current line is above the 70.00 overbought area.
Based on the current market structure, the recent downside recovery with a bullish rebound from the 471.92 support line increases the possibility of a bullish continuation. In that case, overcoming the 540.00 line would increase the buying possibility and test the 636.13 resistance level.
On the other hand, a minor down correction is possible towards the 50 day EMA before forming another bullish wave anytime. However, any immediate selling pressure with a daily close below the 471.92 support level could increase the possibility of testing the 387.89 area before forming another bullish signal.
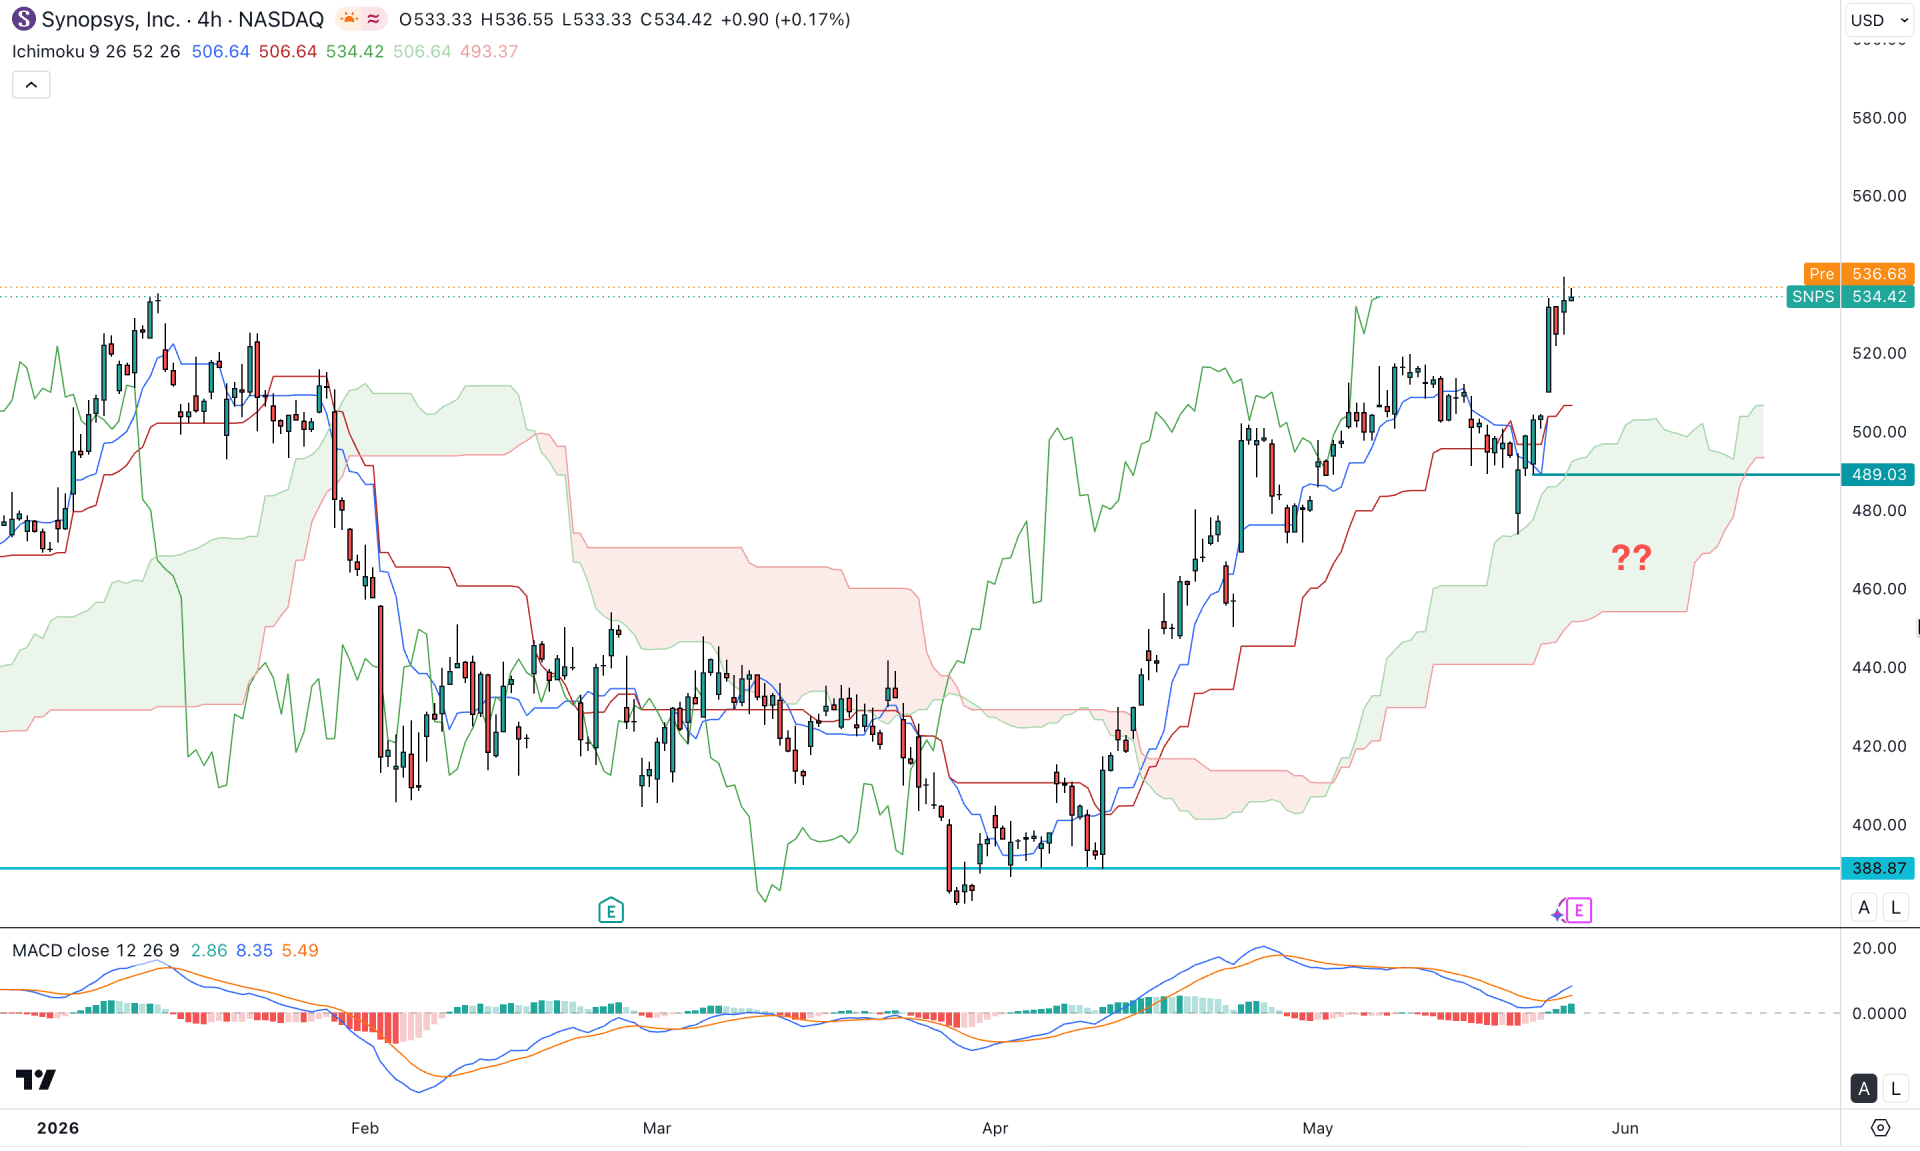
In the H4 timeframe, SNPS is trading within a bullish continuation opportunity as the recent price is hovering above the Kumo Cloud area after a minor dash rebound.
The future cloud is supportive to buyers as both lines are heading upwards. Moreover, the original bullish signal is present from the dynamic line as both dynamic lines are below the current price with a bullish slope.
The secondary indicator window shows a bullish rebound as the histogram is above the neutral level with a bullish rebound in the signal line.
Based on the H4 outlook, SNPS is likely to extend buying pressure as long as it remains above the 489.03 key support level. The immediate resistance to look at is the 588.39 level before heading for the 600.00 area.
On the other hand, a minor downside recovery is possible towards the 389.03 level, but below this line, the price might consolidate within the cloud area where another long opportunity might appear.
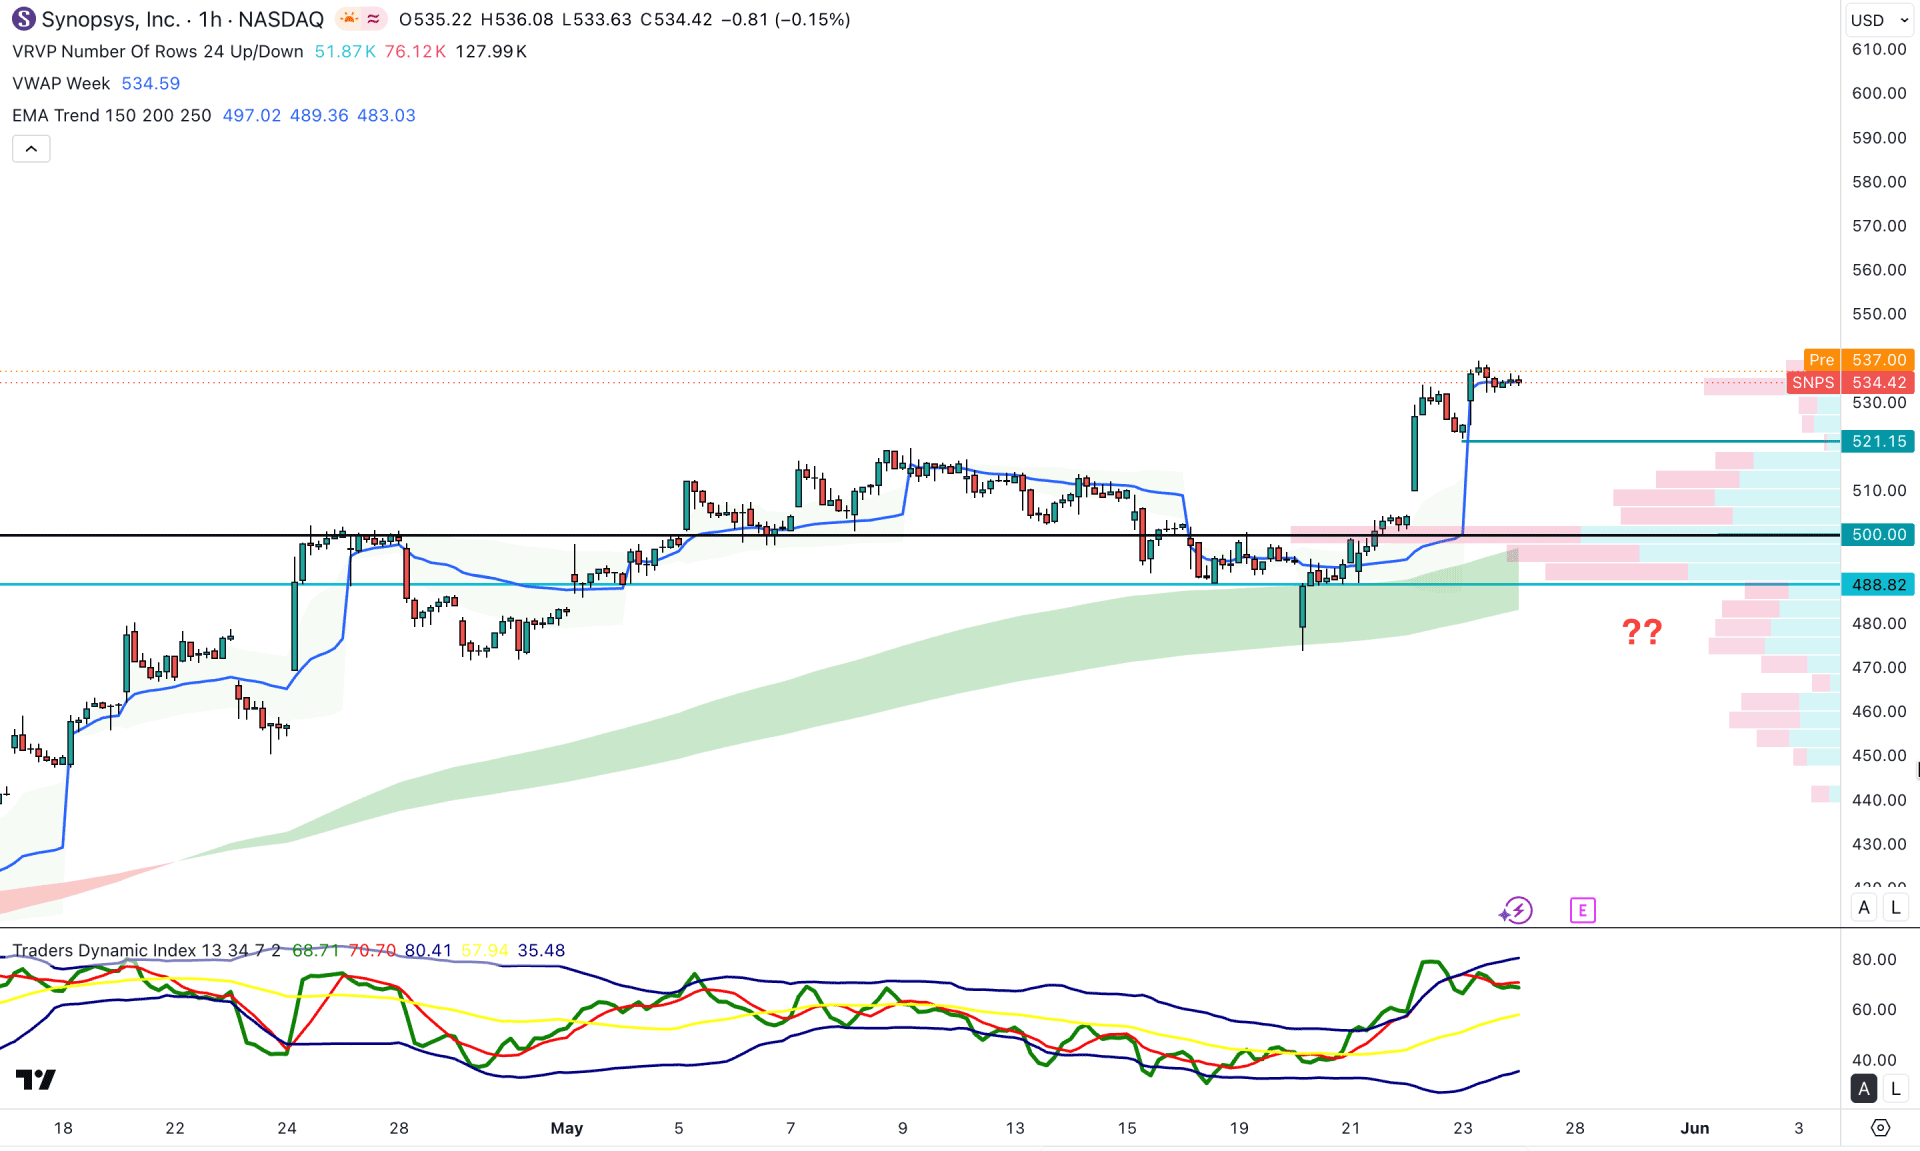
In the hourly timeframe, SNPS is trading within a bullish continuation momentum where the high line is below the current price. Moreover, the weekly VWAP level is closer to the current price, signaling a sideways momentum term.
In the indicator window, the Traders Dynamic Index (TDI) is above the 50.00 neutral area, which signals an active buying impression in the market.
Overall, the hourly market structure shows active buying pressure where the current price is trading at the premium zone. In that case, opening a long position from the premium price area needs extra attention. Primarily, a downside recovery with a bullish rebound from the 515.00 area to the 500.00 area could offer a decent opportunity targeting the 580.00 level.
However, a failure to hold the price above the 500.00 psychological line would be an alarming signal to buy, as it might extend a downside recovery below the 460.00 level.
Based on the overall market structure, SNPS is trading in a notable trend from the recent slope, signaling an early bullish breakout possibility. However, the January 2026 high is a level to look at, as a valid break above this line with bullish price action could continue the existing momentum.


