
Published: June 10th, 2025
With the release of Route Processor 7, SushiSwap has upgraded its aggregator features for increased cross-chain liquidity and the effectiveness of trade execution throughout its decentralized trading network.
This update aims to improve SushiSwap's standing in decentralized finance by possibly boosting efficiency and liquidity. Given its modifications to the trading circumstances, community comment is anticipated.
SushiSwap's Route Processor 7 seeks to improve transaction efficiency by streamlining routing logic. RP7's launch is part of continuous efforts to maintain and expand the platform's competitive advantage in decentralized finance.
Route Processor 7 increases the efficiency of transaction execution, which impacts important assets like Ethereum and BTC. The decentralized financial community is expected to react as users adjust to possible changes in liquidity brought on by algorithm upgrades.
Prior updates, like RP5, prioritized user experience and cross-chain connectivity. The increase in trade volume during these iterations demonstrated the potential for enhanced platform participation with RP7's improvements.
According to Kanalcoin specialists, RP7 might improve SushiSwap's standing in the market. The decentralized environment has a history of embracing strong technology, so it makes sense to expect greater efficiency and liquidity.
Let's see the complete price analysis from the SUSHI/USDT multi-timeframe analysis.
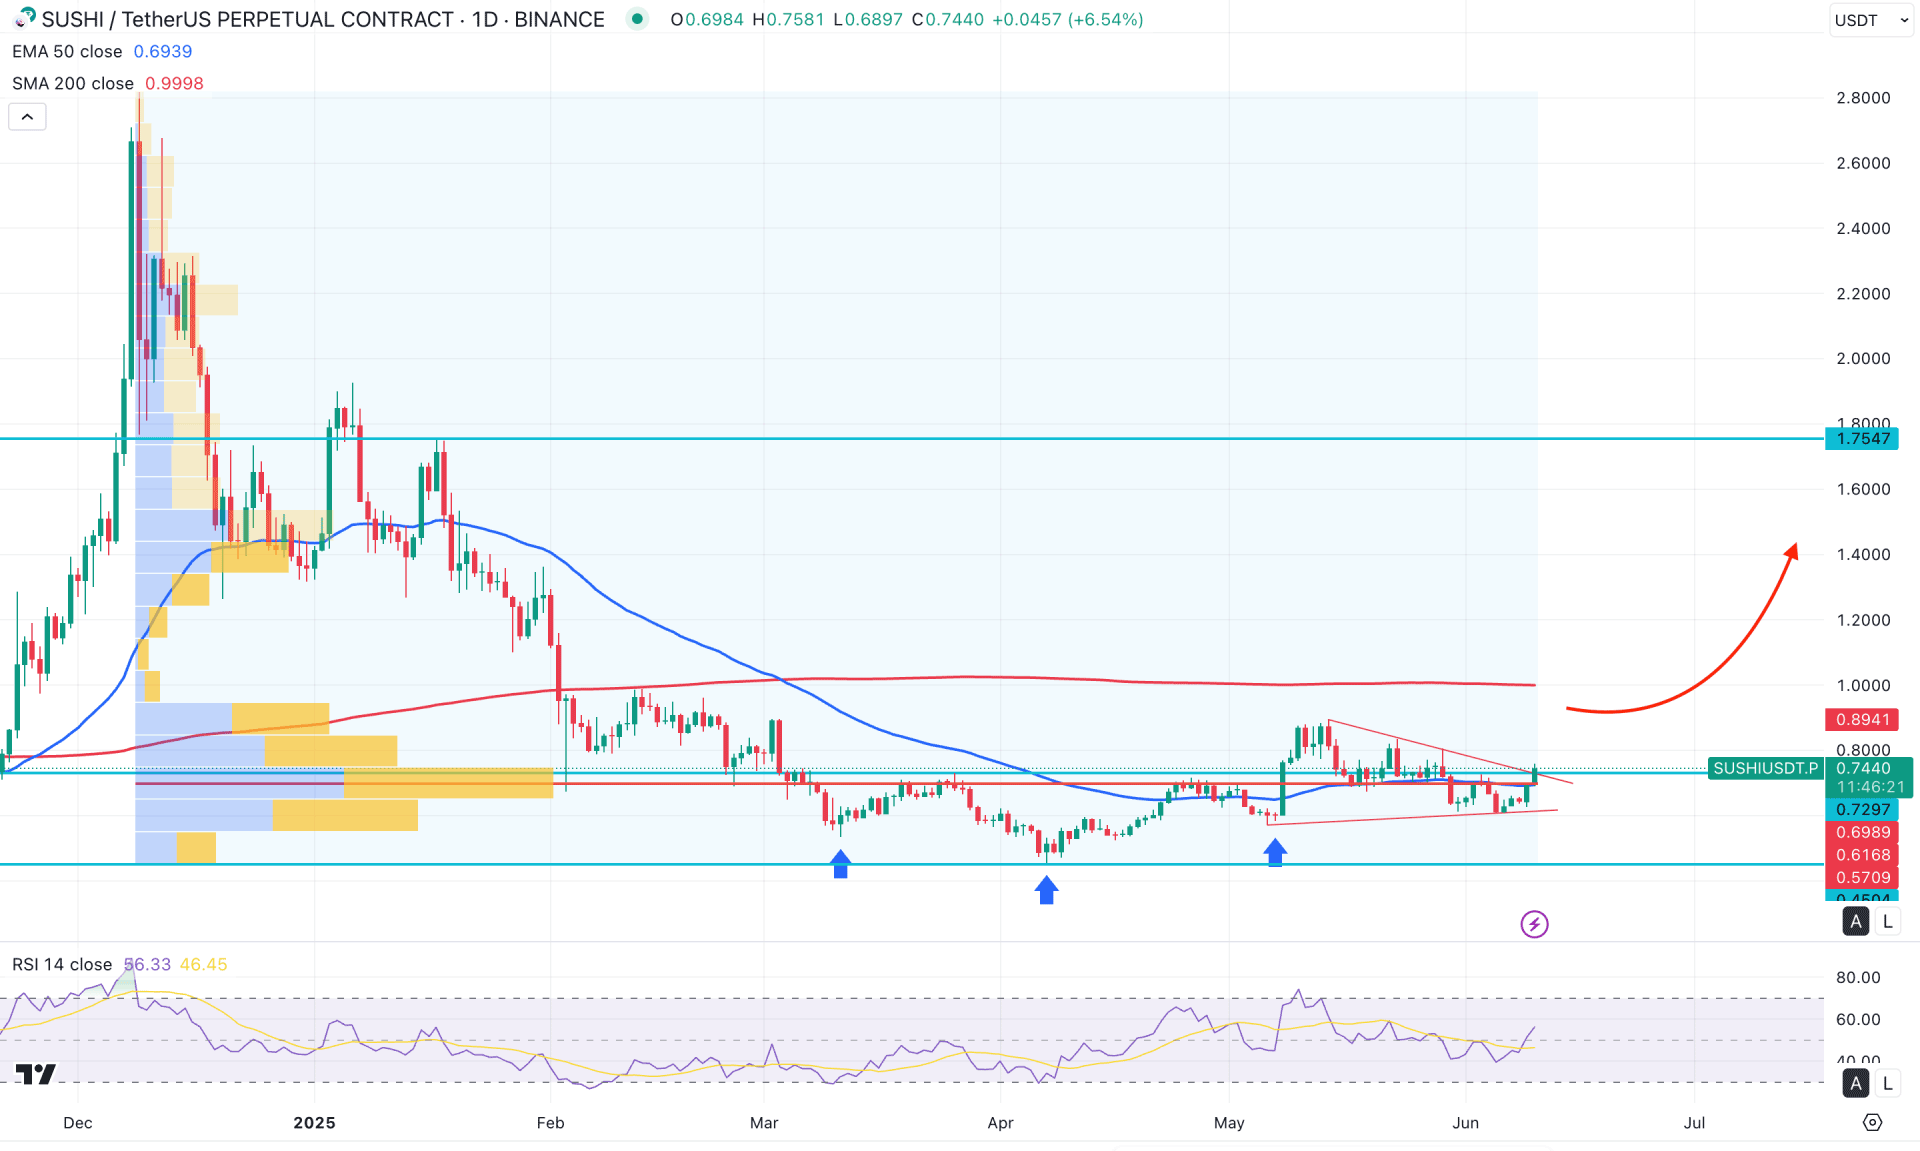
In the daily chart of SUSHI, the ongoing price section is bullish as the recent price has formed a bottom. As the bullish U-shape recovery supports the bottom, any bullish price action could be a potential long opportunity.
In the higher timeframe, the price is trading at the monthly low from where a bullish continuation is visible after a monthly indecision formation. The ongoing price action is bullish in the weekly timeframe, which came after four consecutive corrective bearish candles. In that case, a bullish continuation could appear after having a valid breakout in the daily timeframe.
In the volume structure, the most active level since December 2024 is below the current price. As a valid bullish rebound with a solid recovery above the high volume level is visible, we may expect upward pressure in the coming days.
The daily price chart shows a valid bullish rebound from the inverse Head and Shoulders breakout, signalling a valid bottom formation. Moreover, the price went sideways after having a new swing high, signalling buyers' interest in the market.
In recent times, the dynamic 50-day Exponential Moving Average has been below the current price, working as immediate support. Moreover, the 200-day SMA is above the current price, with a strong gap with the current price.
In the secondary indicator window, the current Relative Strength Index (RSI) aims higher after forming an upward pressure above the 50.00 neutral point.
Based on the current market outlook, the valid triangle breakout with a stable market above the 0.8352 level could be a valid long opportunity. In that case, the primary aim would be to test the 200 day SMA line, before moving beyond the 1.4000 level.
On the other hand, a failure to hold the price above the 50-day EMA could be a challenging factor for bulls. In that case, a consolidation below the 0.6097 level could be a short opportunity, aiming for the 0.5700 level.
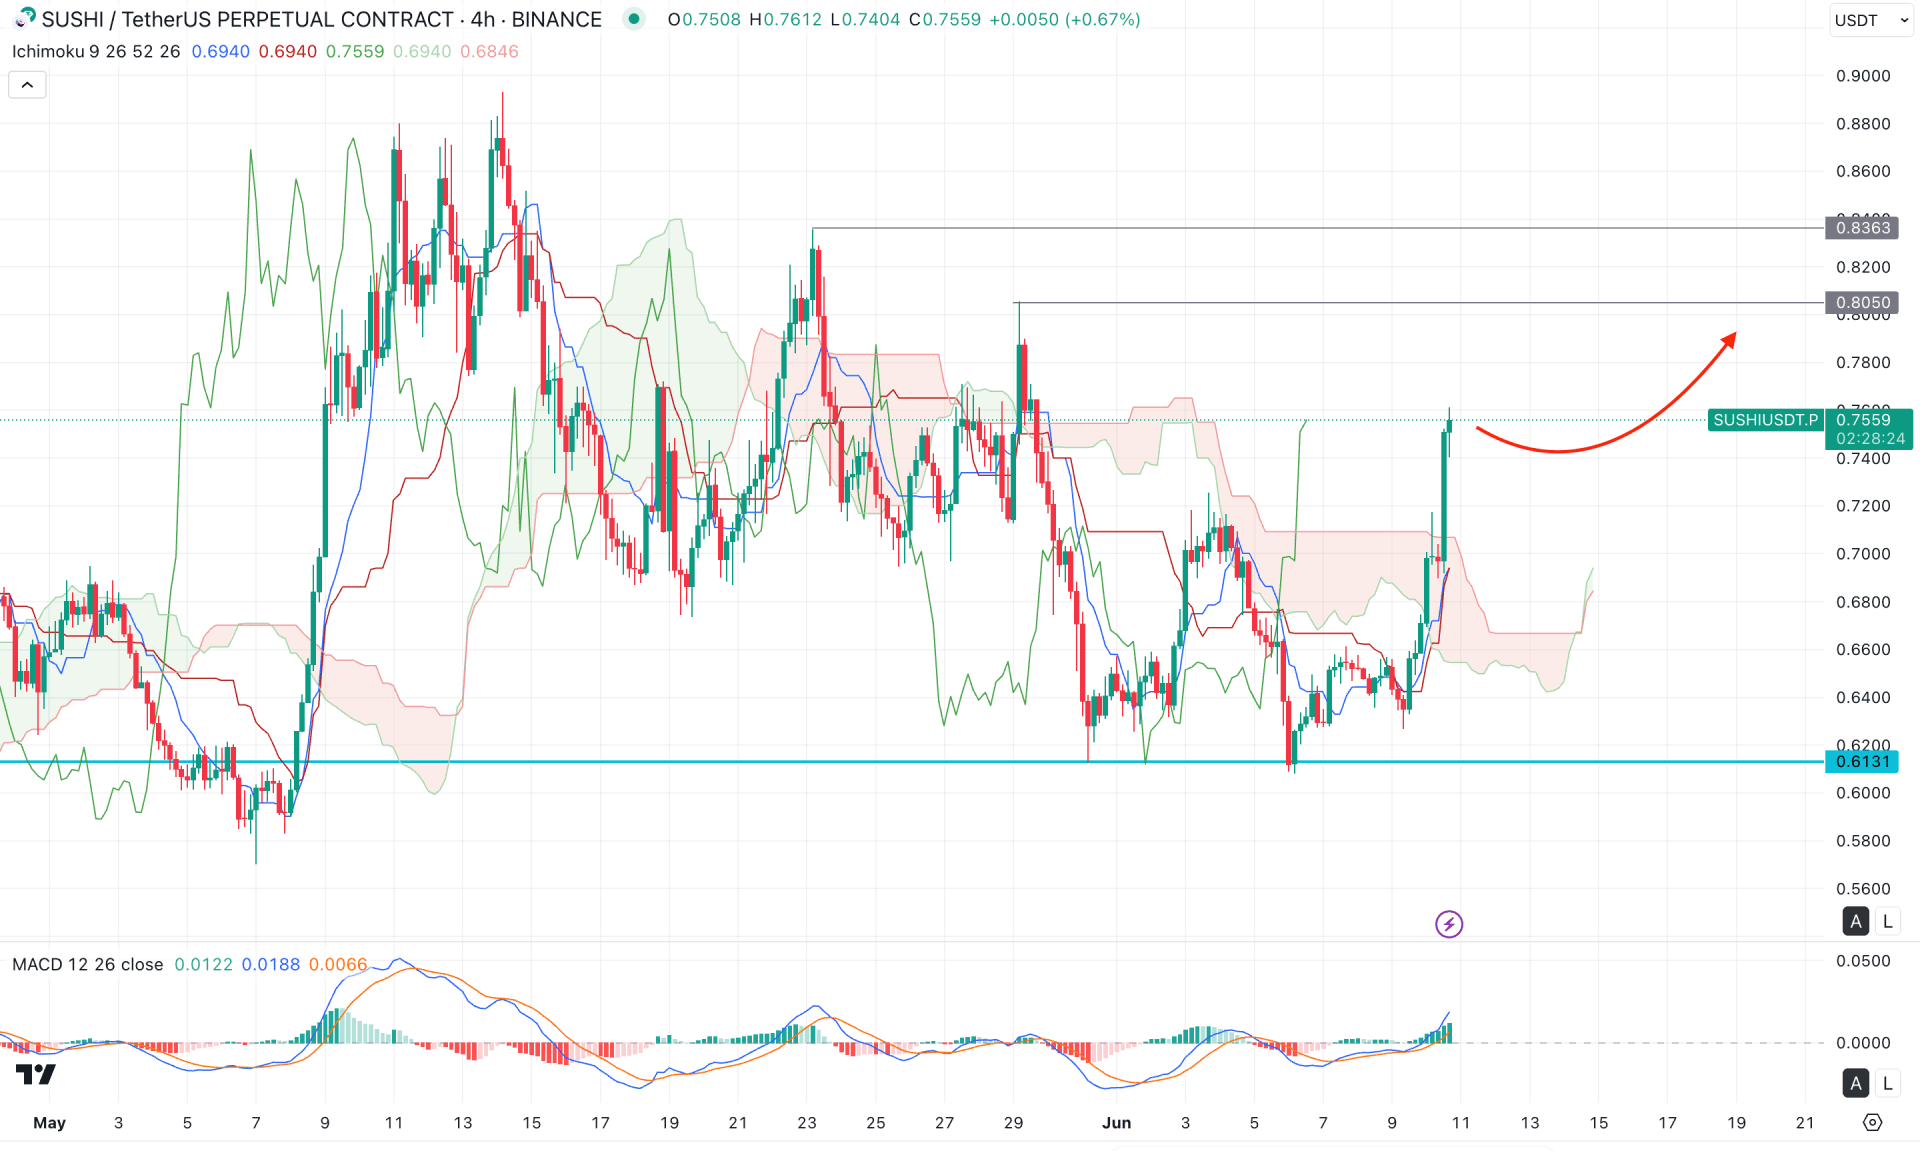
In the H4 timeframe, the recent price is trading sideways, where the most recent price is trading bullish above the Ichimoku Kumo Cloud.
In the Futures Cloud, the Senkou Span A and Senkou Span B are closer together with a bullish slope. It is a sign of buyers' presence in the market, signalling an upward reversal.
In the secondary indicator window, the MACD histogram maintained a strong position above the neutral line. Meanwhile, the signal line has reached the bullish peak, at which point a downside correction is possible.
Based on the H4 outlook, any minor downside recovery could be an early long opportunity, targeting the 0.9000 level. On the other hand, an immediate upward continuation with a failure to overcome the 0.8363 level could be a short opportunity, targeting the 0.6500 level.
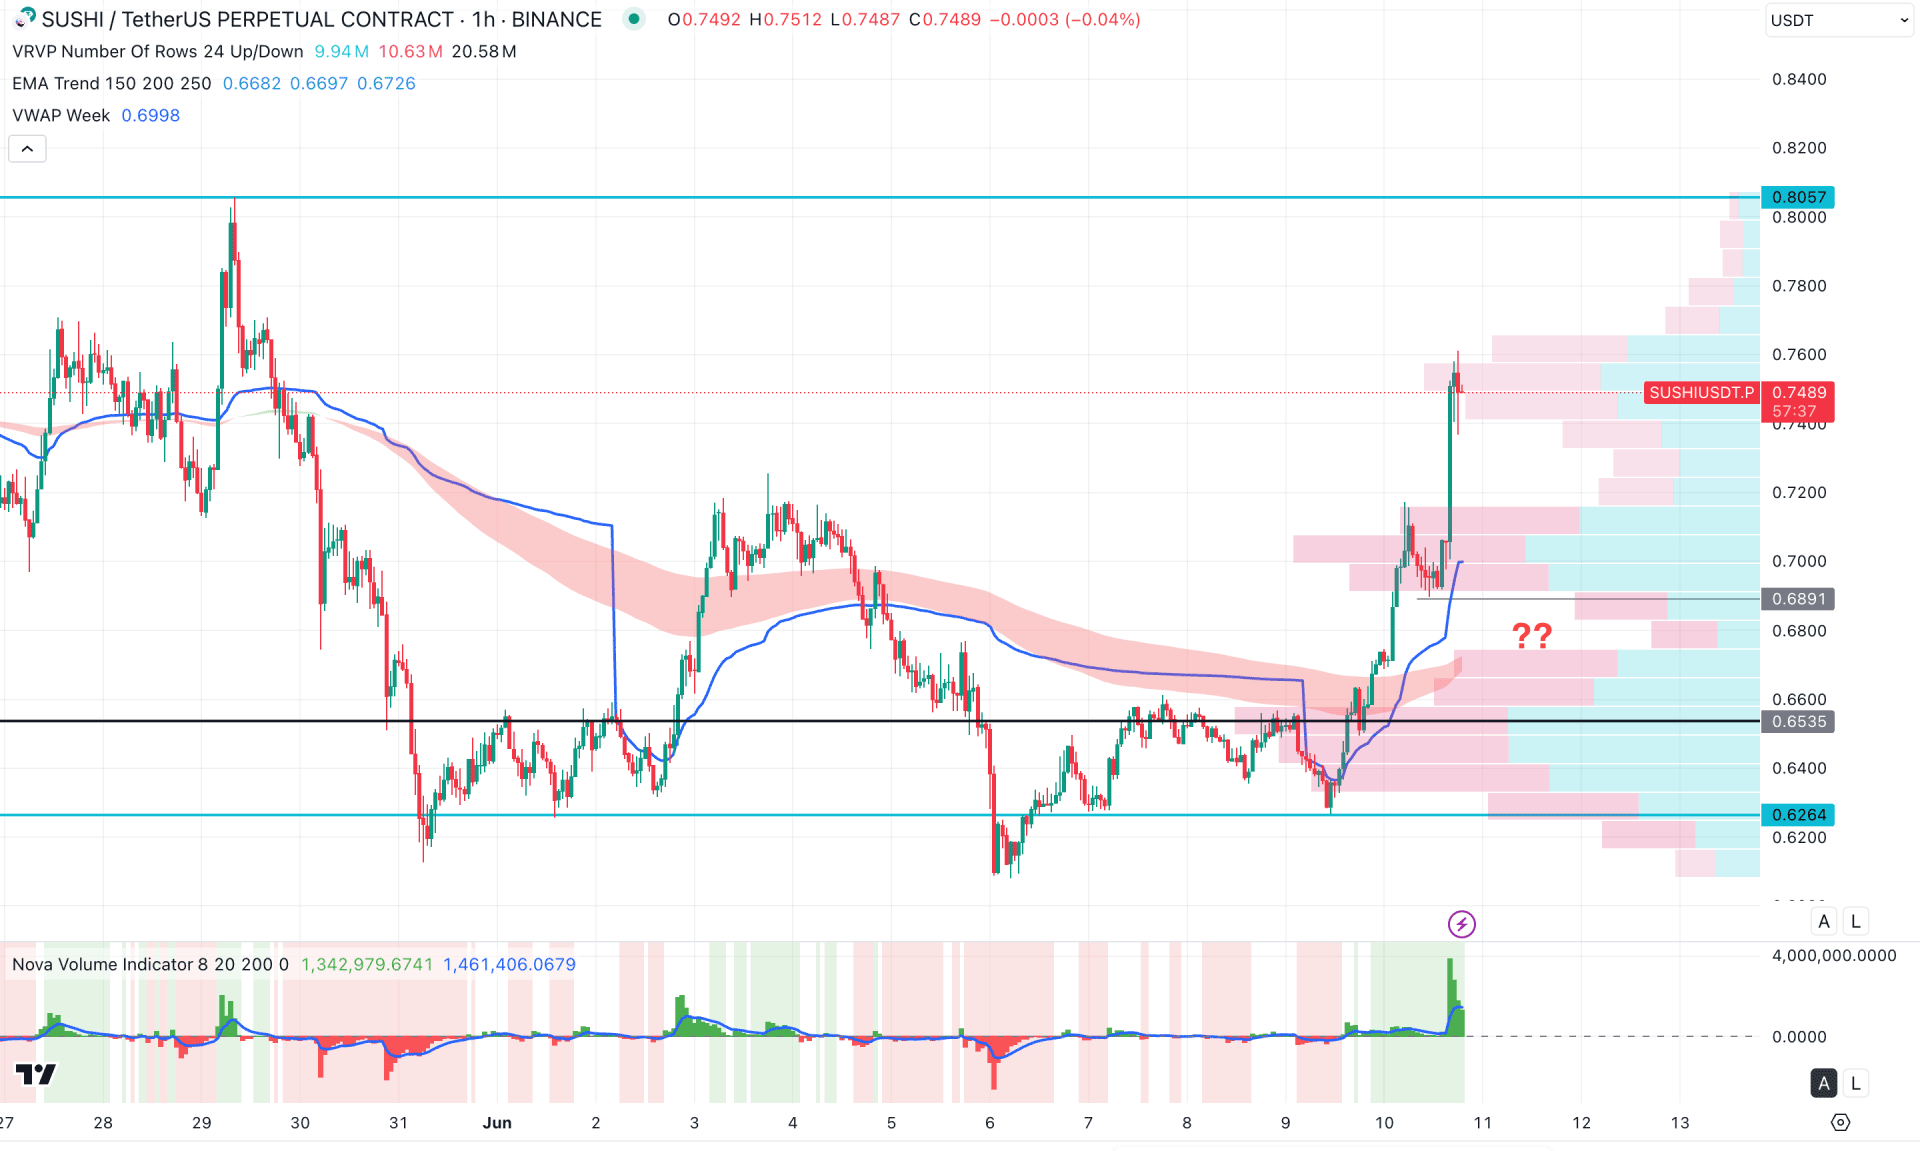
The current price is experiencing extreme volatility in the hourly time frame, with a significant gap from the high volume line. This suggests the possibility of further downside movement. Additionally, the Moving Average wave is below the 0.6891 support level, marked by a blue slope. Since both dynamic lines are beneath the current price, the upward trend remains intact, but the widening gap signals potential downside pressure before continuing the existing trend.
Based on this outlook, the price is likely to decline further and find support near the 0.7000 psychological level. However, a rebound from 0.6891 to 0.5660 with a valid hourly candle closing above the VWAP line could present a bullish continuation opportunity, targeting the 0.8400 zone.
Based on the current market outlook, the SUSHI/USDT is more likely to initiate a bull run after having a valid confirmation. Investors should closely monitor how the price reacts to the triangle high. A bullish breakout with a consolidation could be a primary long opportunity, aiming for the current yearly high level.


