
Published: October 8th, 2025
Following investor Kevin O'Leary's endorsement of Sui at a blockchain conference in Singapore, Sui is beginning to receive more attention. The network is appropriate for next-generation decentralised applications since it prioritises scalability and quick smart contract implementation. With the help of new collaborations and rising use cases, the creator ecosystem is developing.
Sui's TVL has increased significantly over the last month, reaching an all-new record of $2.63 billion. In only one day, stablecoin inflows have increased by $177 million, a 62% increase in just seven days.
Also, Sui is poised for a surge higher when combined with its growing stablecoin market capitalisation and DeFi ecosystem.
On November 1st, Sui allowed for 43,960,000 SUI tokens, which make up about 1.21% of the total quantity that is currently in circulation.
Parallel execution of transactions is one of Sui's key contributions. Transactions are carried out one at a time, typically in the sequence they are received, on other systems that handle smart contracts. Longer processing delays result from this. Nevertheless, the Sui blockchain allows for parallel transactions and near-instantaneous completion of simple activities by circumventing consensus.
Let's see the upcoming price direction of this coin from the SUI/USDT technical analysis:

In the daily chart, SUI/USDT is trading within a sideways momentum, while a descending channel remains active. As long as the price stays within this channel, investors might expect a bearish continuation as part of the channel extension.
In the higher timeframe, the price is trading in the premium zone, where extreme volatility is observed near the top. According to the monthly candle structure, the current price is trading bearish, following a strong monthly channel resistance. The bearish candlestick close in July 2025 activated a short opportunity, which was later confirmed by a gravestone doji formation in the following month. Since the price failed to overcome the existing monthly high, a bearish continuation is possible toward the September 2025 low.
From the volume structure, the bearish possibility remains solid. The largest volume activity level since May 2025 is acting as a strong resistance at the 3.8636 level. A bearish break of structure is visible from the high-volume zone, while the current price is trading within a minor bearish trend breakout, supported by a continuation pattern.
In the main price chart, the dynamic moving averages show a mixed scenario. The 200-day Simple Moving Average is acting as an immediate support, with the current price positioned between the 200-day SMA and 50-day Exponential Moving Average.
In the secondary indicator window, the Relative Strength Index (RSI) reflects bearish momentum, as the price has failed to reach any significant peak since August 2025. The most recent RSI line is hovering near the 50.00 neutral point, indicating a possible further downside extension.
Based on the overall market structure, a bearish opportunity requires close attention, as the 50-day EMA and 200-day SMA are closer to the current price. A confirmed break below the 3.2000 level could strengthen the bearish outlook, increasing the likelihood of testing the descending channel support near 2.6000.
On the other hand, a bullish rebound from the 50-day EMA with a breakout above the 3.8636 resistance (high volume line) could trigger a channel breakout. In that case, a bullish phase may begin, where the initial resistance would appear at 4.4385, followed by a potential move toward the 5.0000 level.
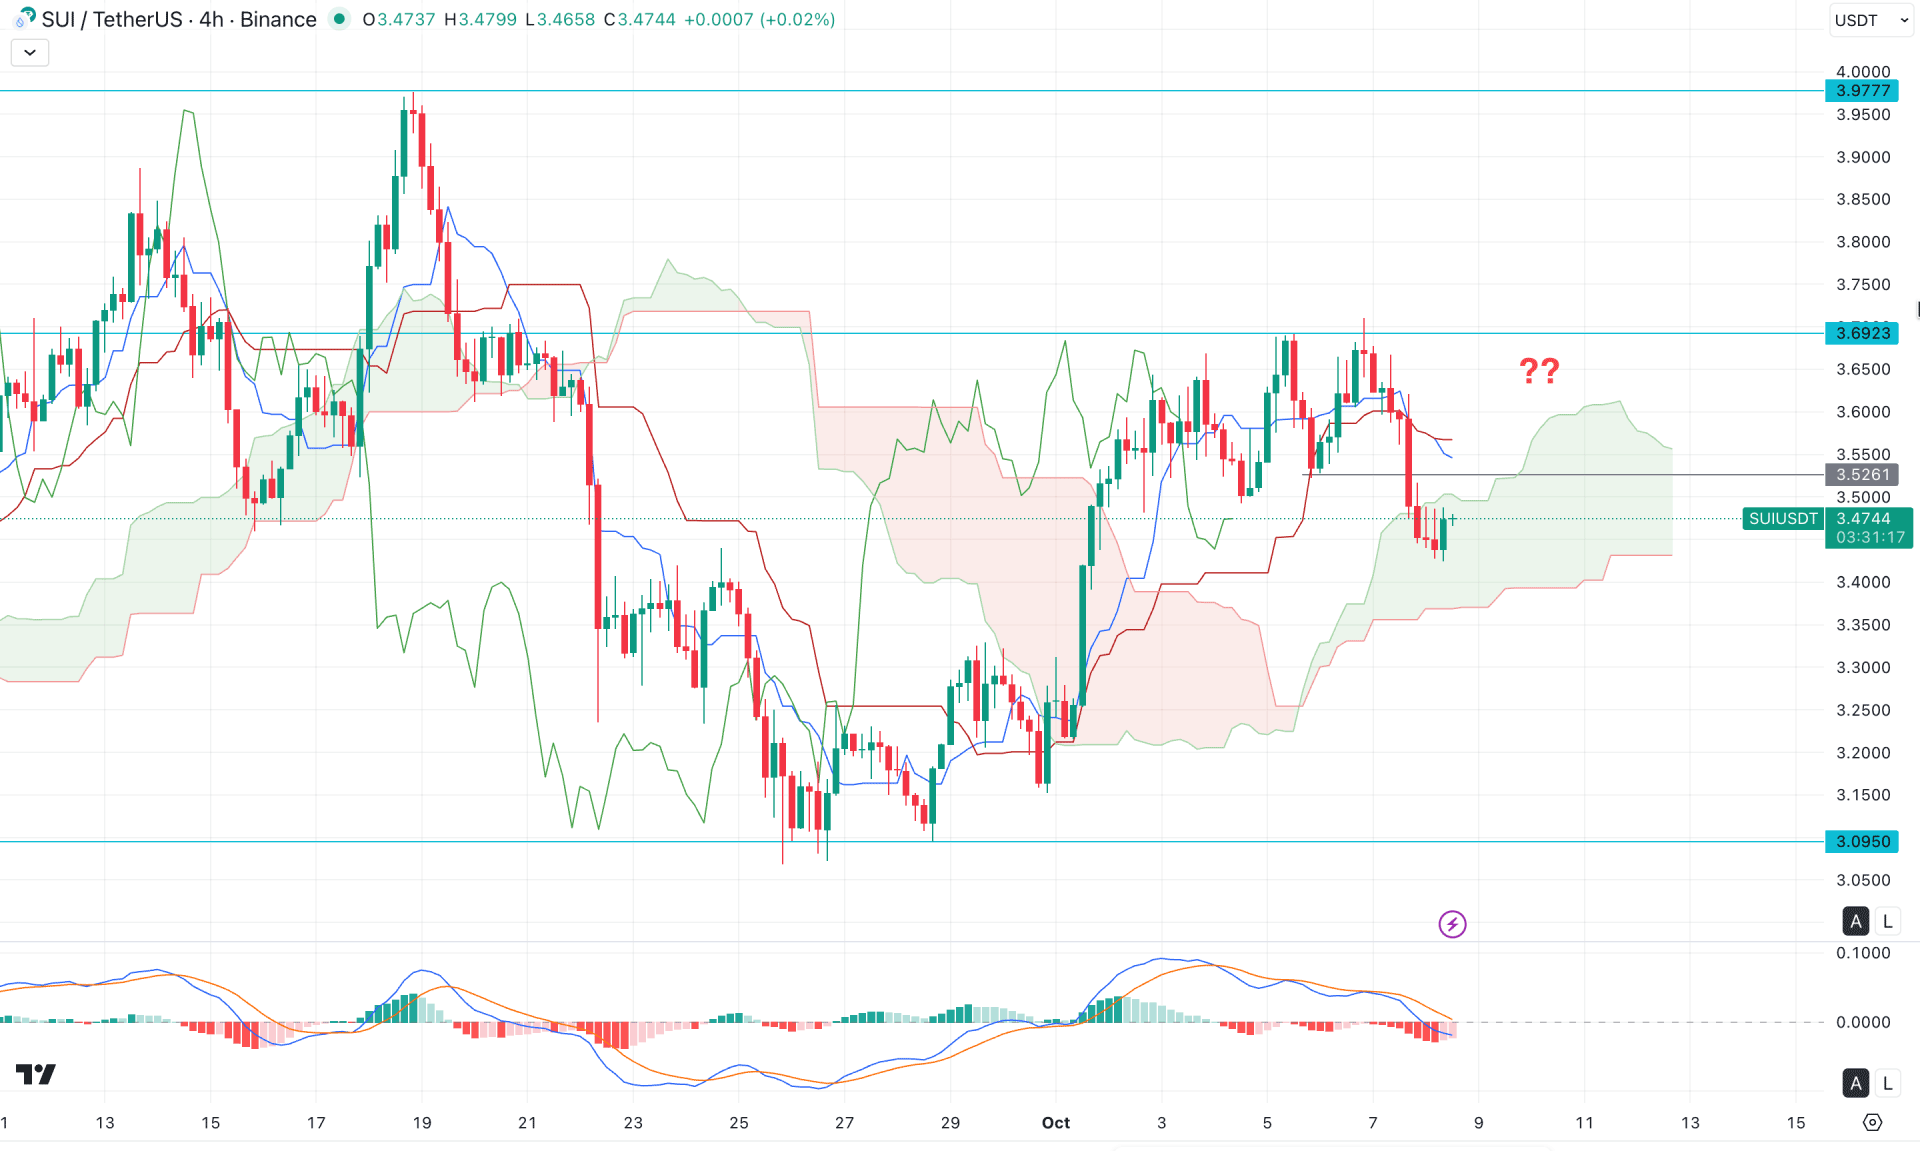
In the four-hour timeframe, the SUI/USDT price shows a bullish recovery above the Ichimoku Cloud area. However, a divergence has formed, suggesting that further bearish pressure may emerge. Therefore, close attention should be given to the near-term event level at 3.5261.
According to the indicator readings, the future clouds remain bullish, but the downside slope in Senkou Span A, along with a flat Span B, indicates upcoming indecision in the market.
In the secondary indicator window, the signal line has failed to follow the market momentum, forming a bearish divergence, as the most recent price action trades below dynamic resistance levels.
As the price found support around the Kumo Cloud area and is currently trading within this zone, a potential bearish break below the 3.4000 level on a four-hour close would open a short opportunity. The ultimate bearish target in this scenario would be around the 3.0950 level, which could confirm a long-term bearish trend.
On the bullish side, a rebound above the dynamic line is crucial. The immediate resistance lies at 3.6923, and a decisive four-hour close above this level could extend the momentum toward the 4.0000 psychological level.
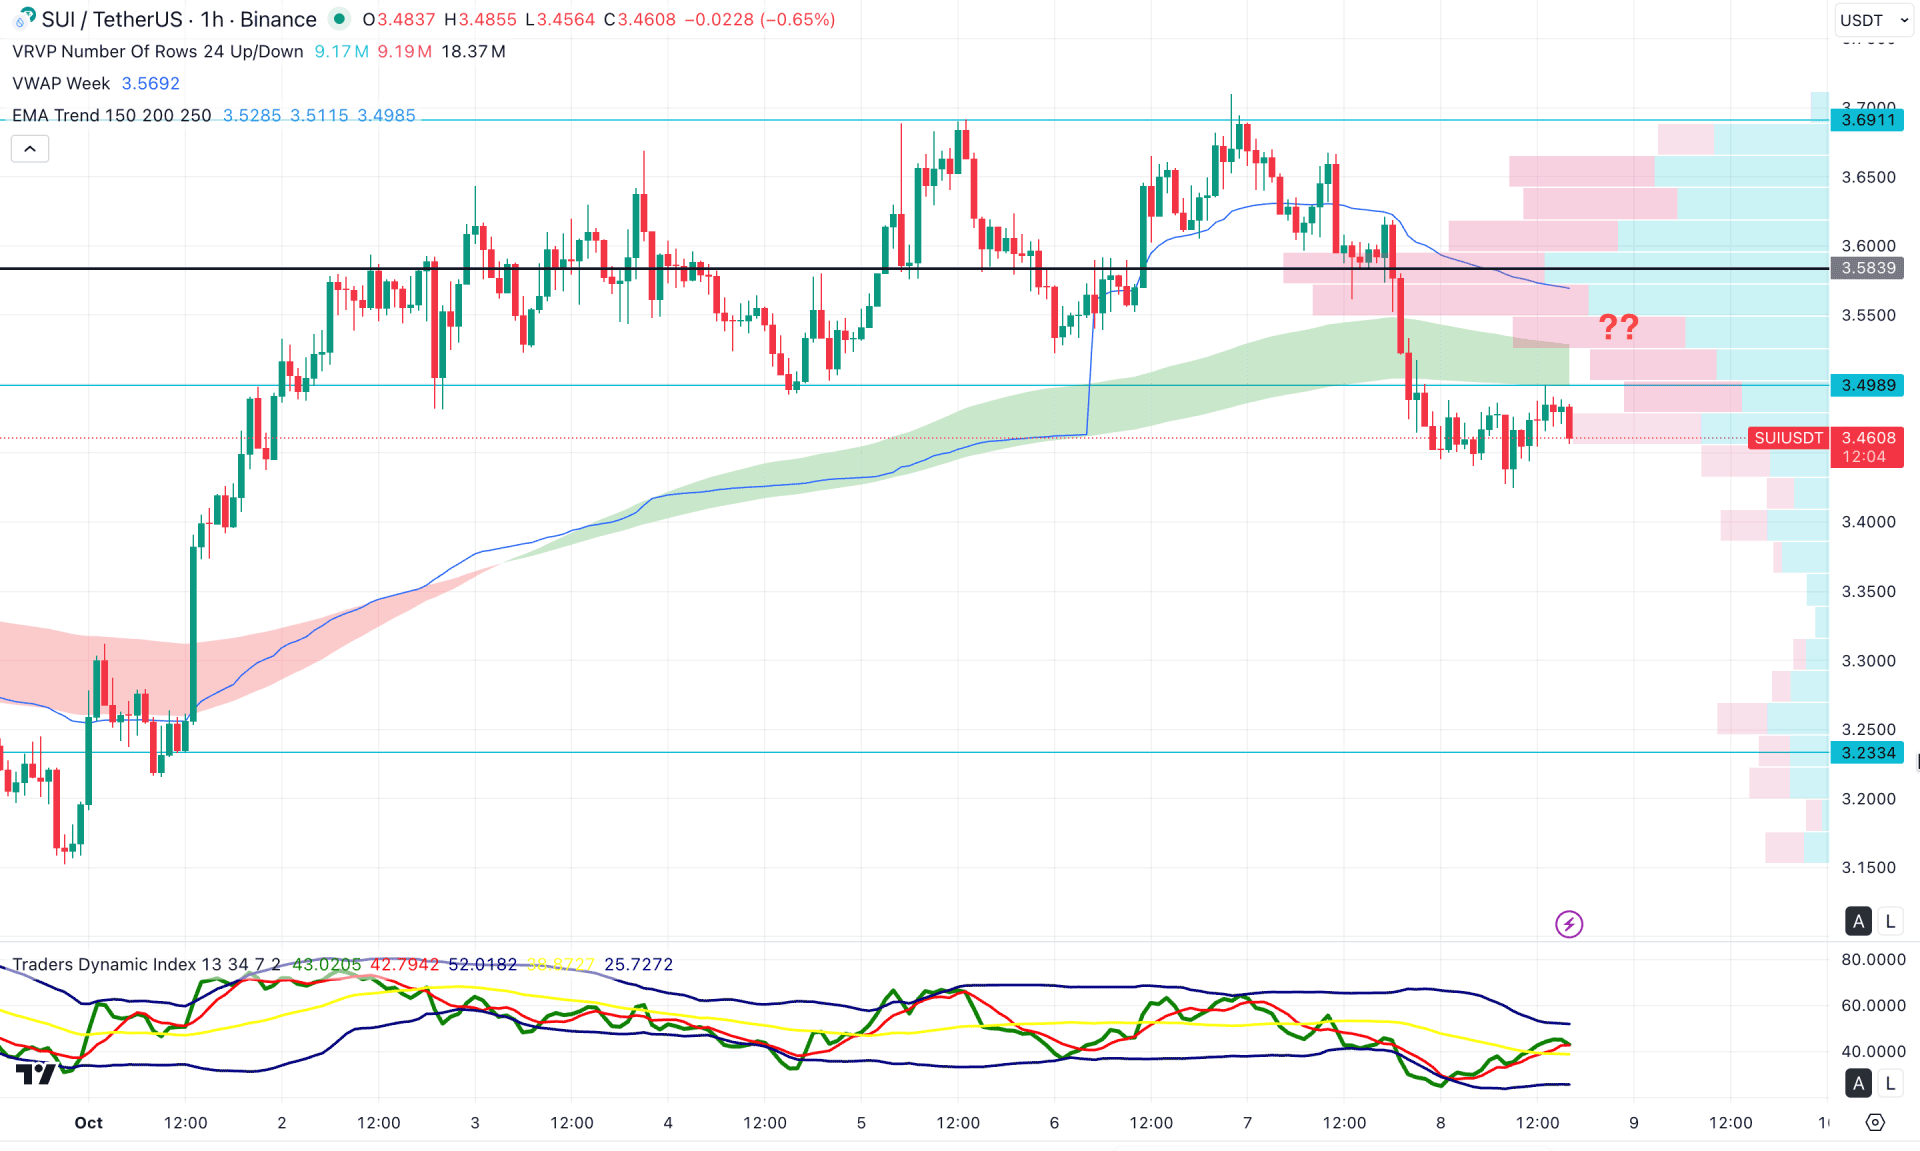
In the hourly timeframe, the recent price is trading bearishly, following a valid range breakout, while the psychological resistance level at 3.5839 is acting as a strong barrier. Moreover, the price has dipped below the EMA wave, and the weekly VWAP is also positioned above the current price, reinforcing bearish pressure.
In the secondary indicator window, the Traders Dynamic Index (TDI) is hovering just above the 40.00 neutral line, while both the upper and lower bands are moving sideways, indicating a lack of strong momentum.
Based on this outlook, a bearish continuation remains highly possible as long as the price trades below the EMA wave. On the bearish side, the price is likely to fill the imbalance and find support near the 3.2334 level.
On the bullish side, multiple resistance barriers are present, with the 3.5839 level being the first major obstacle. A decisive break and consolidation above 3.6000 could open a potential long opportunity, with an upside target toward the 3.8000 level.
Based on the overall market structure, SUI/USDT is currently trading within a bearish strength, suggesting that a corrective bearish continuation remains possible. As long as the price trades within the descending channel, investors might look for short-term bearish opportunities.
However, a major market reversal may only occur after the price establishes a solid bottom near the descending channel support, followed by a valid breakout above the channel.


