
Published: May 13th, 2026
Over the past week, Sui has had a notable increase and has outpaced other online assets. According to Santiment, this is the reason for the increase. Moreover, the cryptocurrency market has rebounded, but some assets have definitely lagged behind in terms of profits. Sui, which is up about 40% inside the window, is one of these.
SUI flew up to a high of $1.41 on Sunday, increasing by more than 56% from the $0.90 baseline before this rally. Although the asset hasn't been able to hold onto all of these gains, as its price has retraced back to the $1.28 market. However, the asset's price has returned to $1.28, indicating that it hasn't been able to hold onto all of these gains.
By integrating native personal transactions directly into its basic protocol in 2026, the SUI network is taking a step toward blockchain infrastructure. In contrast to conventional methods, this architecture requires no additional privacy layer or optional privacy tools, and by default, transaction information is solely available to the sender and recipient.
A long-standing obstacle to on-chain institutional acceptance is directly addressed by SUI's approach, which treats privacy as a first-class primitive that allows developers to build applications on top of the current infrastructure.
Let's see the future outlook of this coin from the SUI/USDT market analysis:
In the daily chart of SUI/USDT, the recent price shows an impulsive bullish pressure, creating a potential range breakout from a long consolidation. Although the breakout is solid, more confirmations are needed before anticipating a bullish trend continuation.
In the higher timeframe, the price is trading at an extreme bottom with consecutive indecision candlesticks in the monthly timeframe. As the current price is offering above the three-month high, investors should closely monitor how the price holds the momentum at the current area before validating the bullish rebound.
The weekly timeframe is showing a sign of a valid bullish reversal, as a strong bullish candle is present after a long consolidation. However, the existing weekly high is marked as a crucial point to look at, as breaking above this line could be a valid long opportunity.
In terms of volume, the buying pressure is solid, as the existing bullish rally came from a long consolidation with the most active level at the 0.9900 area. Primarily, as long as the price remains above this line, the bullish continuation is highly possible.
On the other hand, the gap between the current price and the high Williams level has expanded, creating a downside possibility as a pump and dump structure.
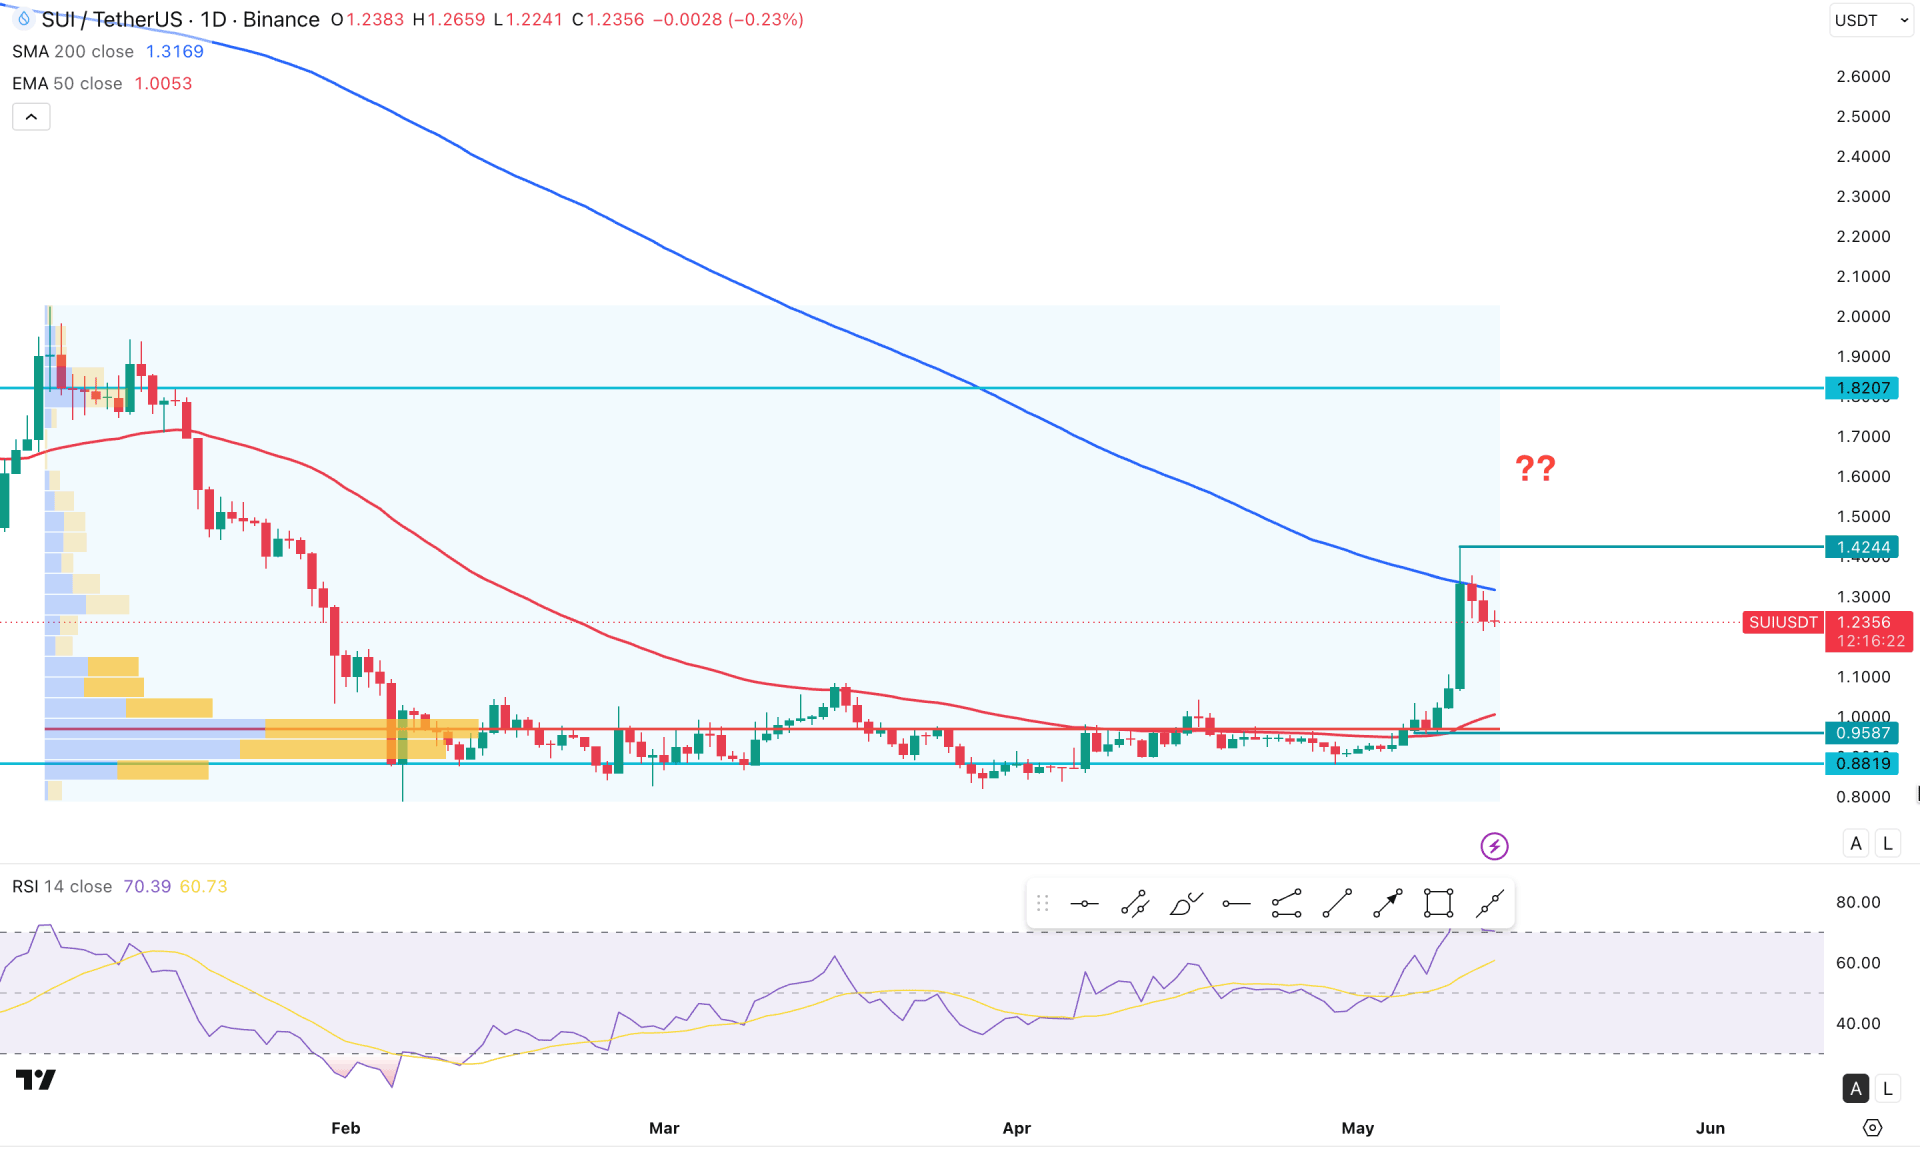
In the main price chart, the existing bullish wave failed to hold the buying pressure above the 200 SMA. Moreover, multiple bearish daily candles are present below the 200 SMA, creating a minor barrier. The 50-day EMA is still way below the current price, signaling a potential downside correction.
In the RSI, the current line is hovering in the extreme bull zone, signaling an overbought market condition. In that case, the RSI is likely to reach the neutral 50.00 area, creating a bar correction possibility.
Based on the current market structure, the price is trading below the 200 SMA and likely to extend a down correction towards the 1.0000 psychological line. Moreover, a failure to hold the price above the 1.0000 line would be a stronger opportunity that can take the price even lower, below the 0.8000 area.
On the other hand, a sideways market momentum after a long bullish breakout could result in a bullish strength continuation opportunity. However, sufficient bullish signals need to be present in the intraday chart. The immediate resistance is at the 1.4244 level, and overcoming this line could open the room for moving beyond the 1.8207 area.
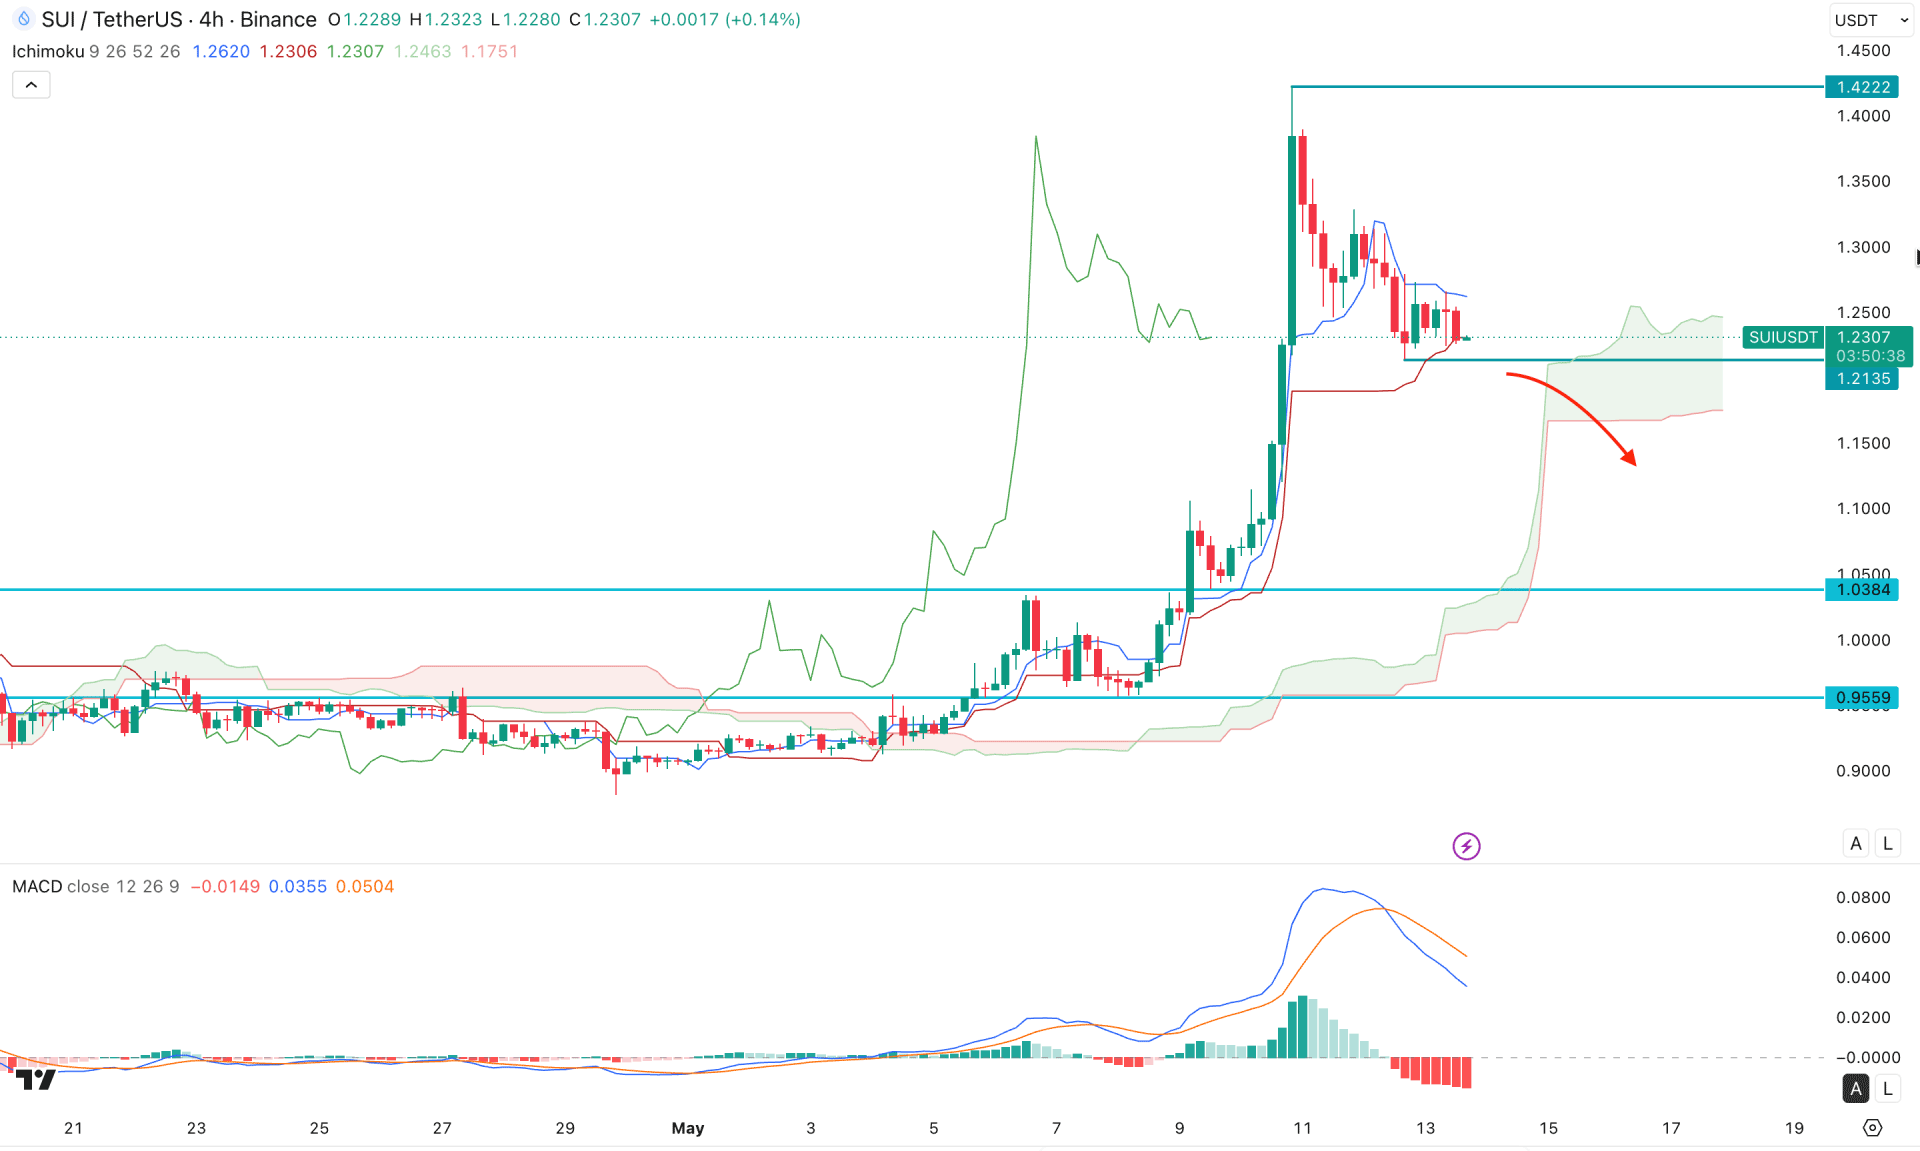
In the H4 timeframe, SUI/USDT is trading above the Kumo cloud area, signaling ongoing buying pressure. However, after forming a top at 1.4222, the price rebounded and moved below the Kijun level. In the current structure, the immediate support is at the 1.2135 level, which is a crucial price to look at.
The secondary indicator window is already showing a continuation opportunity, as the price found a bullish break and failed to hold the momentum as a bullish continuation.
Based on this structure, a four-hour candle below the 1.2135 level could initiate an extended correction towards the 1.1000 area.
On the other hand, any bullish rebound from the 1.2100 area to the 1.0500 area with a rebound above the Kijun level might open a long opportunity targeting the 1.4222 level.
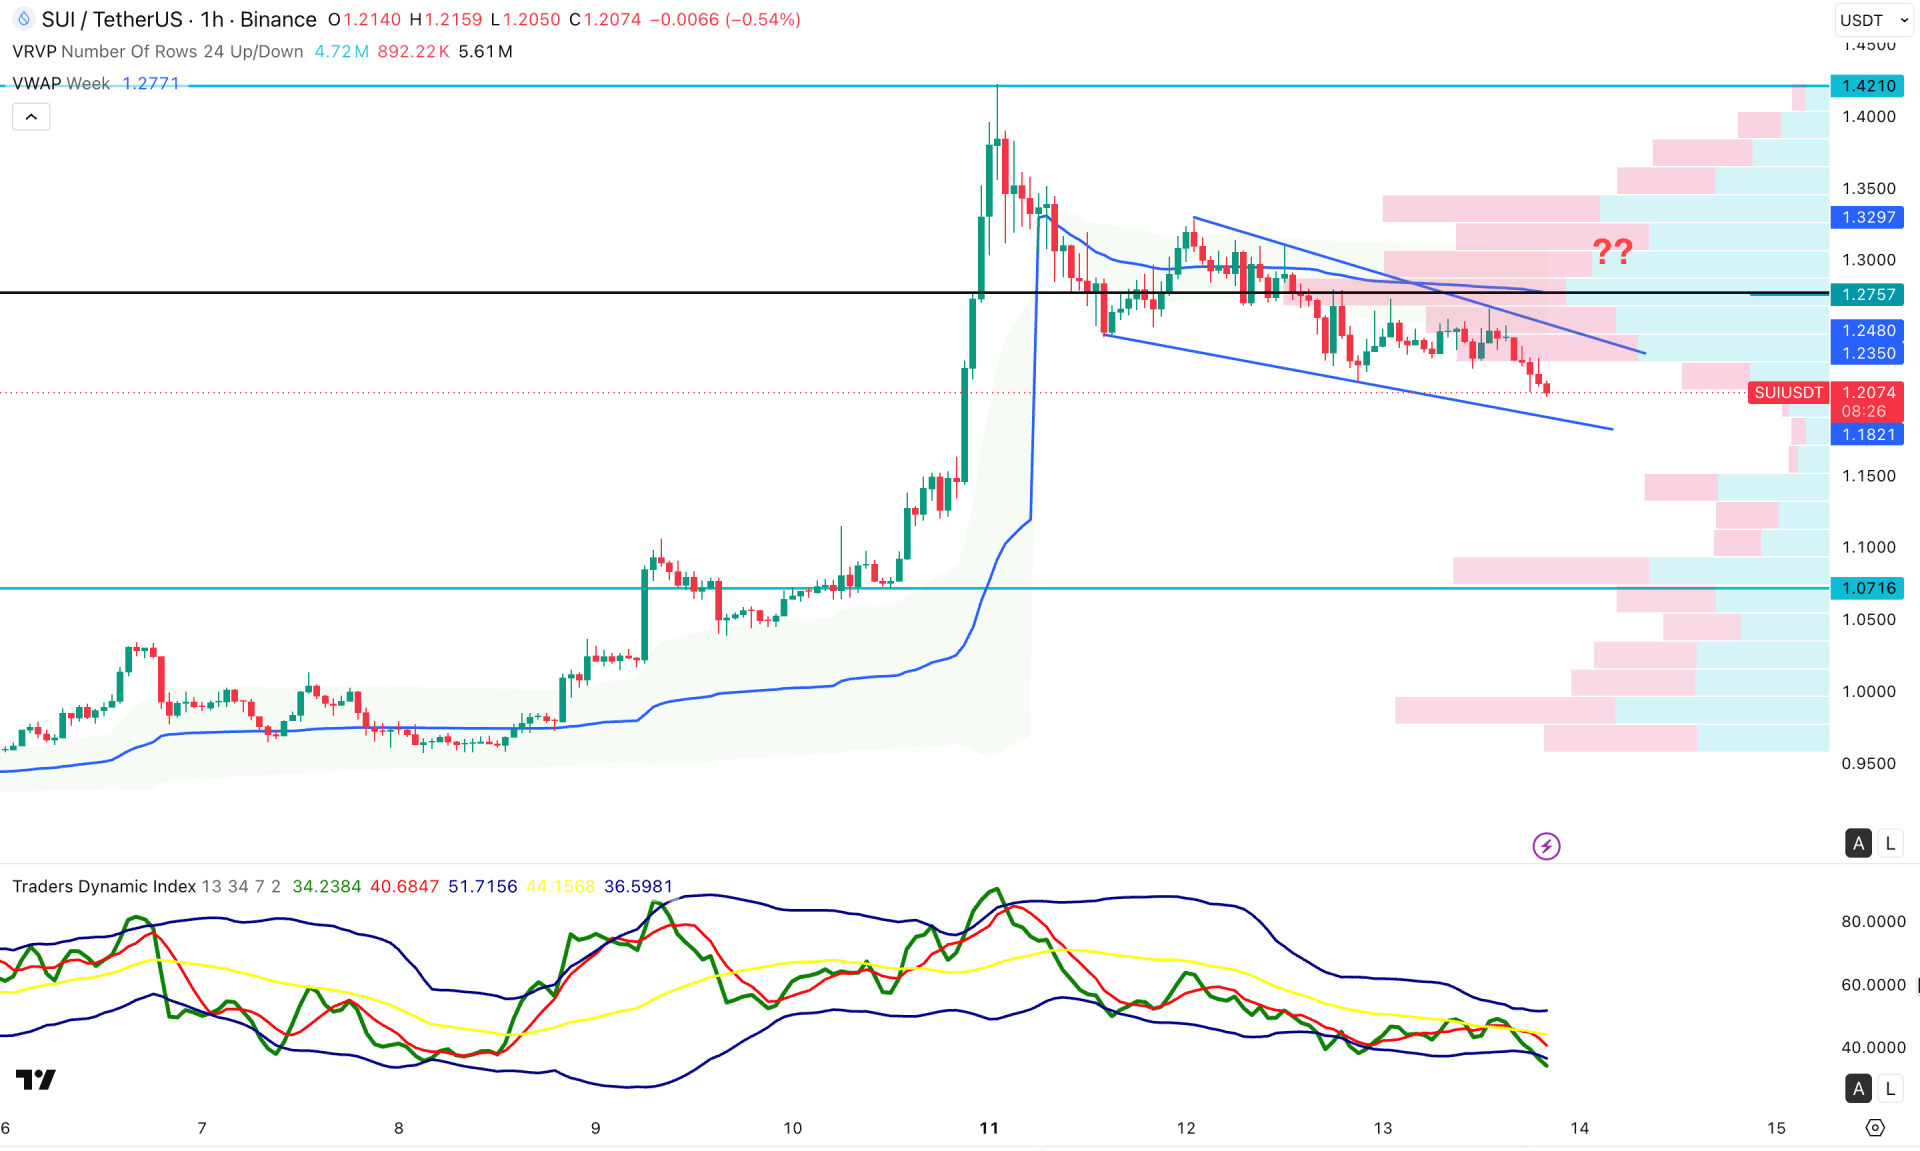
In the hourly timeframe, SUI/USDT is trading under downside pressure after forming a top at the 1.4210 level. As the price shows no significant bottom at the peak, the downside pressure is expected to extend.
In the secondary indicator window, the Traders Dynamic Index is showing extreme downside pressure, as the recent line has reached the lower PK. This is a sign of a possible bottom formation in the main price chart, from where a minor correction could come.
On the other hand, the weekly VWAP level is above the current price and is working as a major resistance. The hype line is at the 1.2757 level, which is also above the current price and in line with the VWAP level.
Based on this outlook, the price is likely to extend the downside pressure until the immediate support at the 1.1500 level. However, an extended selling pressure could test the 1.0000 level before forming a bottom.
Based on the overall market structure, SUI/USDT is trading at a multi-month high, while the long-term outlook remains bullish as the price is trading at an extreme bearish zone. However, the price is overextended from where more downside correction is possible before validating the long-term holding opportunity.


