
Published: August 23rd, 2023
Since August 18, the SUI token's value has increased, partially due to the ongoing Bullshark Quest event 2. This event, a collaboration between Mysten Labs and the Sui Foundation, has been extended by eight days, with the original end date of August 29 being pushed back. This extension's primary objective is to offer participants a more robust opportunity to interact with decentralized finance (DeFi) decentralized applications (dApps).
Bullshark Quest 2 has assembled a diverse group of individuals anxious to explore the dynamic world of decentralized finance. The extended duration is intended to facilitate deeper user engagement within the DeFi ecosystem, allowing users to investigate and interact with the vast array of available offerings.
Two reward pools connected to the SUI token are central to the second Bullshark Quest. These reward categories provide unique opportunities for players, with each participant eligible to participate in only one.
In Pool 1, 2.5 million SUI tokens have been reserved for distribution to the top 5,000 participants based on their point totals. On the other hand, the Bullshark Quest 2 event began on July 28 with a total reward pool of 5,000,000 SUI tokens. The extended timeline highlights the shared objective of Mysten Labs and the Sui Foundation.
The solid fundamental development with a valid price action could make the SUI token an attractive investment opportunity.
Let’s see the upcoming price direction of this token from the SUI/USDT technical analysis:
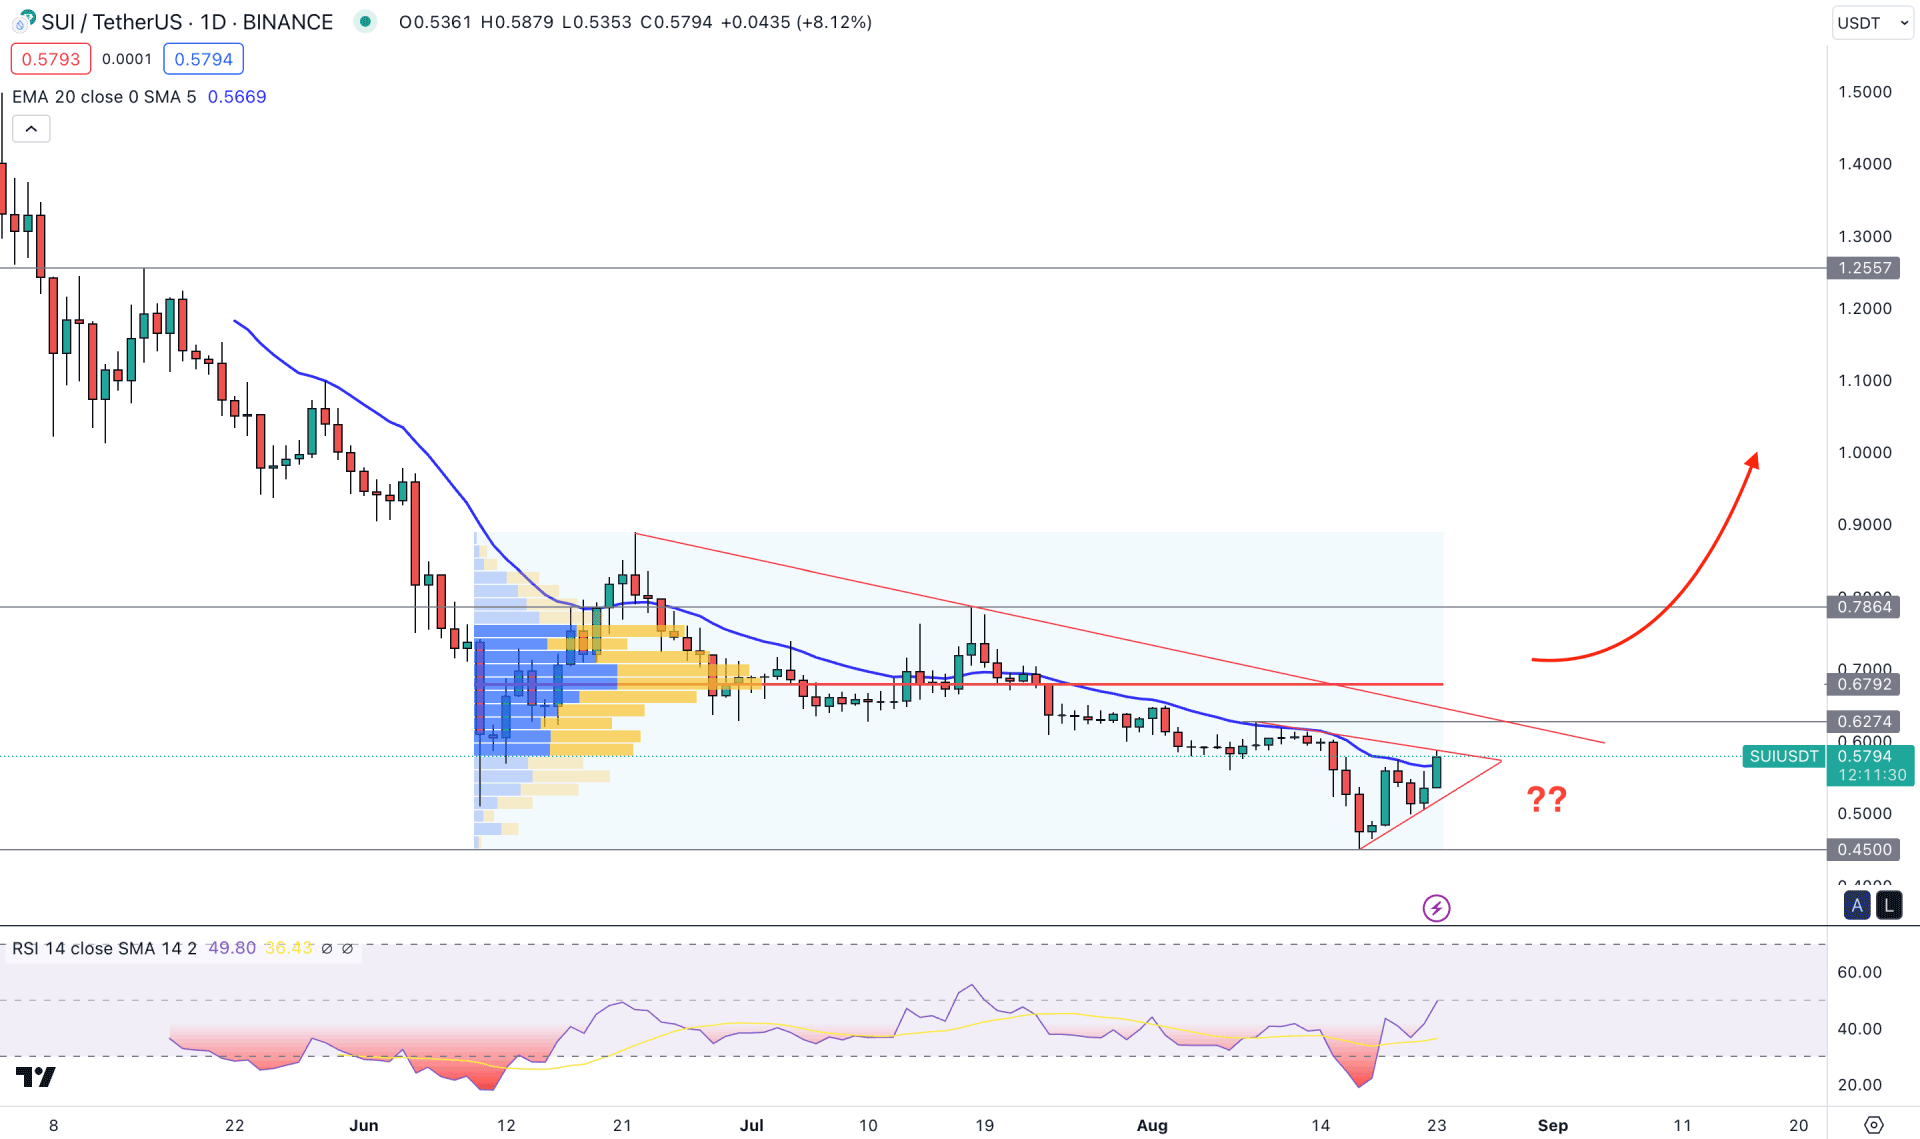
In the daily price of SUI/USDT, the overall market direction is bearish, where bulls need a solid breakout with sufficient confirmation before opening a long position. As per the current finding, any bearish trend trading opportunity could work well in the SUI/USDT price.
In the higher timeframe price action, the price is still trading below the July 2023 low, where enough liquidity is present. The weekly price already showed a sell-side liquidity sweep, which needs validation before considering a trend change.
In the daily chart, the current price is trading within a symmetrical triangle pattern, which could result in a trend continuation after a valid breakout. The current daily candle is trying to hold momentum above the dynamic 20-day EMA, while the near-term resistance is at the 0.6274 level. In that case, investors might expect stable bullish pressure after taking out the near-term resistance level.
Moreover, the current high volume level since the June 2023 low is at 0.6792 level, which could work as a strong barrier. The Relative Strength Index (RSI) shows a neutral opinion, whereas the current reading is at 50.00 line.
Based on the daily market outlook, the broader market direction is bearish, and bulls need a solid breakout above the 0.7000 level to find a conservative bullish opportunity. On the other hand, the current structure is bearish, and any candlestick confirmation from the 0.6500 to 0.6000 area could lower the price toward the 0.4500 support level.
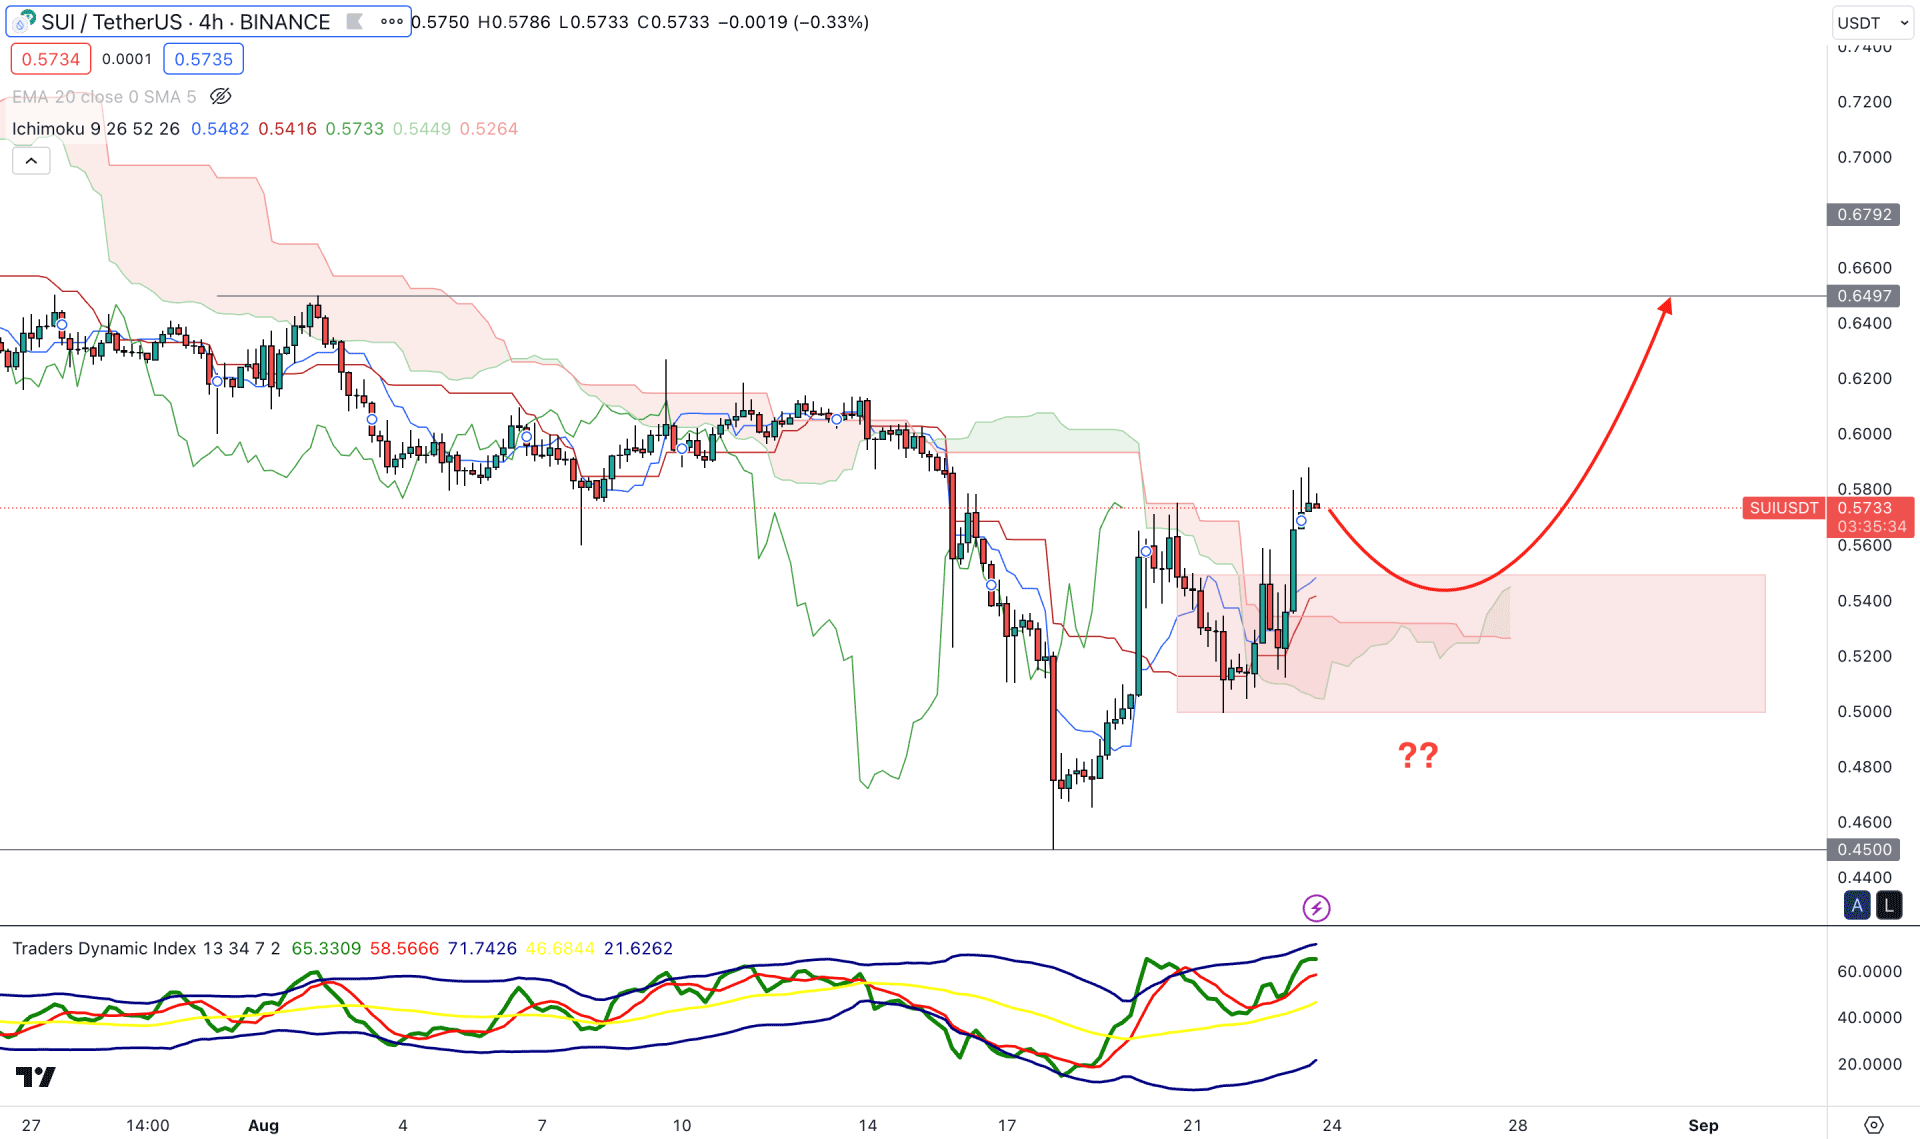
The early buying opportunity is visible in the H4 chart, where the current price is trading above the Ichimoku Kumo Cloud. Moreover, the future cloud is bullish, where the Senkou Span A is above the Senkou Span B. The Lagging Span is also above the price on that level, while dynamic levels are working as a support.
In this indicator window, the current Traders Dynamic Index Indicator shows a bullish sign as the current TDI level is above the neutral 50.00 line.
Based on the H4 structure, the overall market direction is corrective, and bulls need additional confirmation before opening a long position. The primary idea is to find a bullish rejection candlestick from the dynamic Kijun Sen level. On the other hand, a break below the 0.5000 level could indicate a bearish trend continuation, where the main aim is to test the 0.4400 support level.
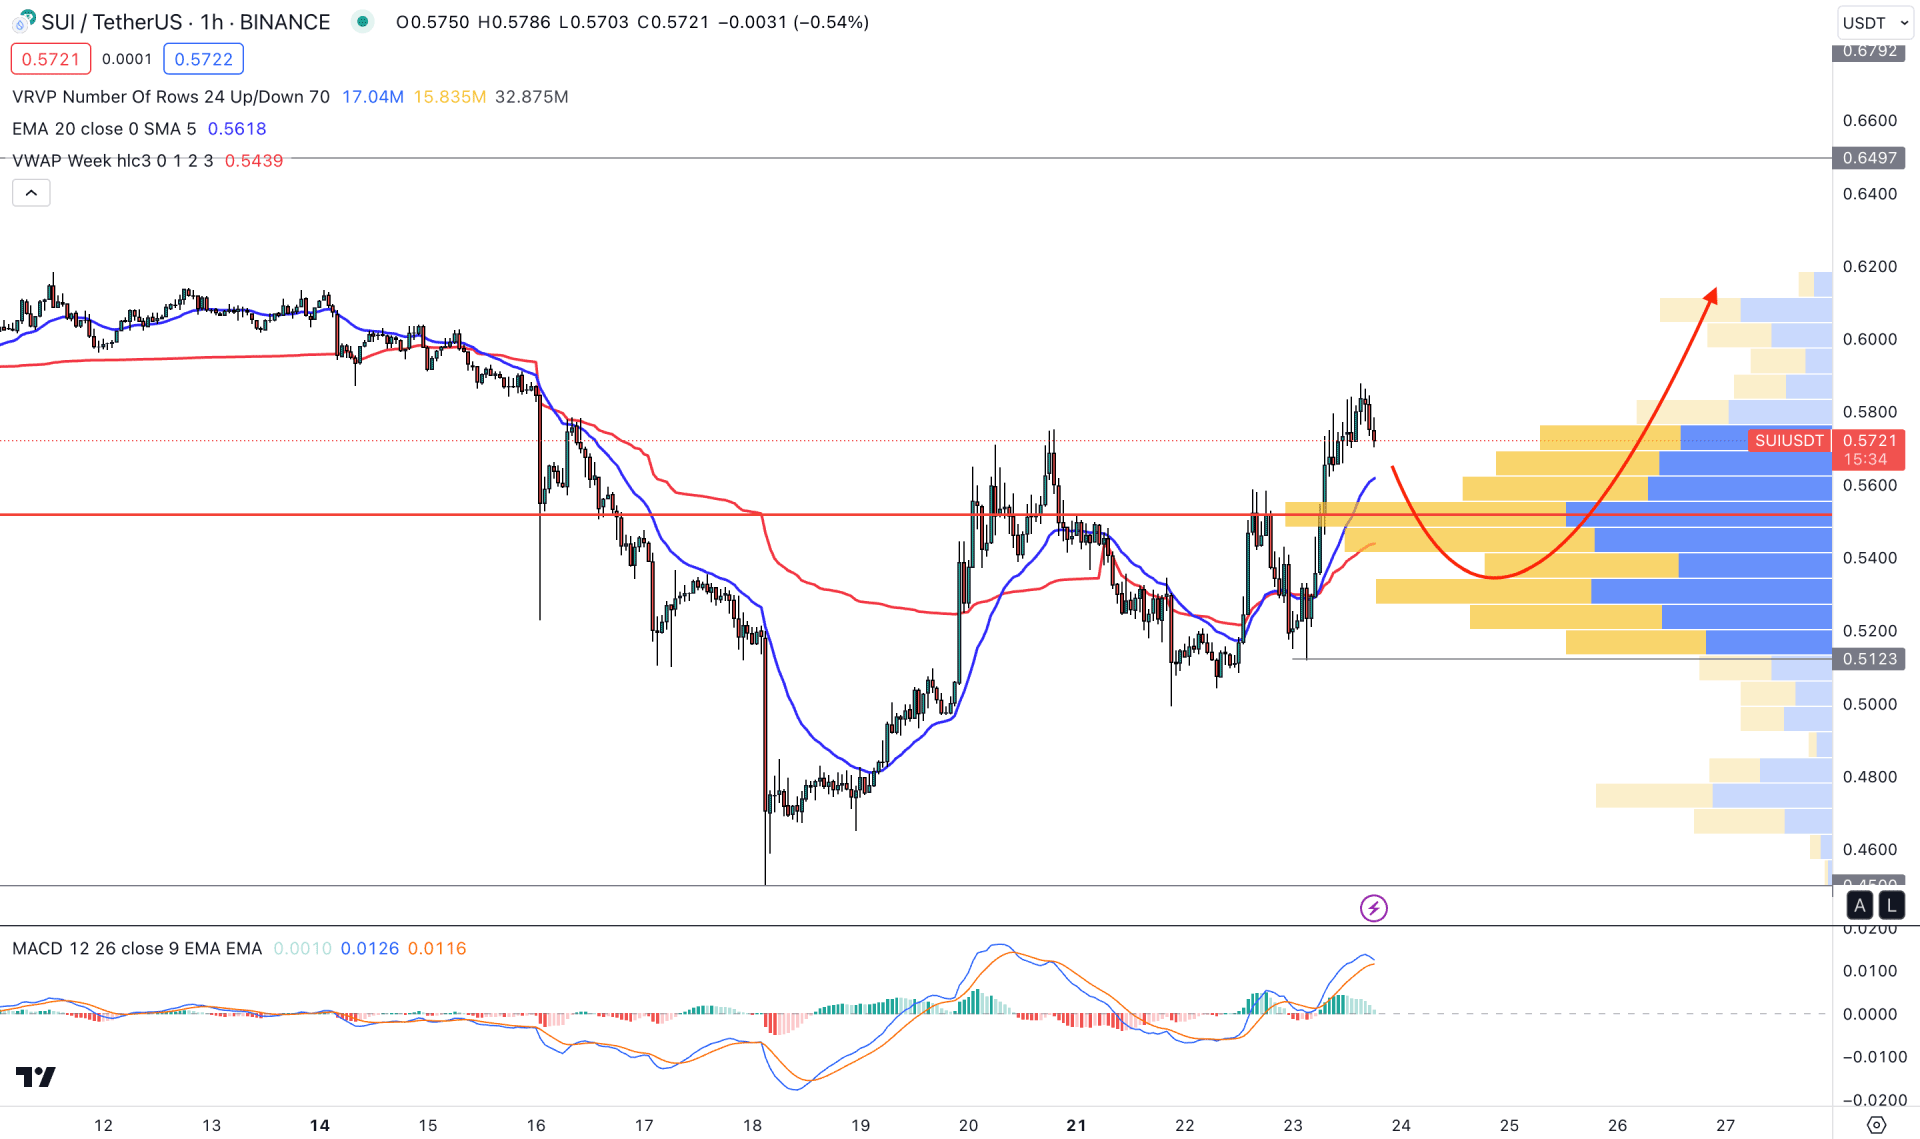
In the hourly chart, the current price is trading above the visible range high volume level, while a bullish crossover is visible among dynamic 20 EMA and weekly VWAP. As a result, a valid downside correction and a bullish rejection could offer a decent long opportunity in this pair.
The current MACD Histogram is on the neutral line, while the MACD lines are at the overbought zone. It is a sign that bears might grab the week and form a considerable downside correction.
Based on the H1 timeframe, a bearish correction and a bullish rejection from the 0.5400 to 0.5000 area could offer a long opportunity. However, breaking below the 0.5000 level with an H4 close could lower the price in the coming days.
Based on the current market analysis, SUI/USDT could offer a decent long opportunity after a valid breakout. However, the intraday price is still bearish, which may result in a downside trend continuation.


