Published: December 19th, 2024
The GBPJPY trades at the weekly high area, ending its two-day dropping streak. As the Japanese yen (JPY) falters following the announcement of the Bank of Japan's pick to maintain interest rates at their current level, the GBPJPY cross is strengthening.
Following its two-day fiscal policy assessment, the Bank of Japan complied with market projections by maintaining its interest rate policy for the third recurrent meeting and keeping its immediate rate target between 0.15% and 0.25%.
According to the Overview of the BoJ Policy Declaration, inflation is anticipated to fall to a level that is roughly in line with the BoJ's cost target during the second part of its three-year estimate period, which runs through fiscal year 2026. However, the outlook for Japan's economy and prices is still very uncertain. Changes in commercial wage and establishing price practices may make the effect of foreign exchange (FX) fluctuation on inflation more noticeable than it has historically been.
The stronger pound sterling (GBP) supports the GBPJPY cross's upward movement, which may be related to the BoE's greater propensity to hold interest rates steady at the end of the day while continuing to prioritize tackling high inflation in the country.
The nation's Consumer Price Index (CPI) increased 2.6% compared to the previous year in November after growing 2.3% in October, according to data released on Wednesday. After rising 3.3% YoY in November, the core CPI – which does not include uncertain energy and food items – rose 3.5% YoY. In the meantime, annual services inflation stayed steady at 5%, which was less than the 5.1% prediction.
Let's see the upcoming price direction of this currency pair from the GBPJPY technical analysis:

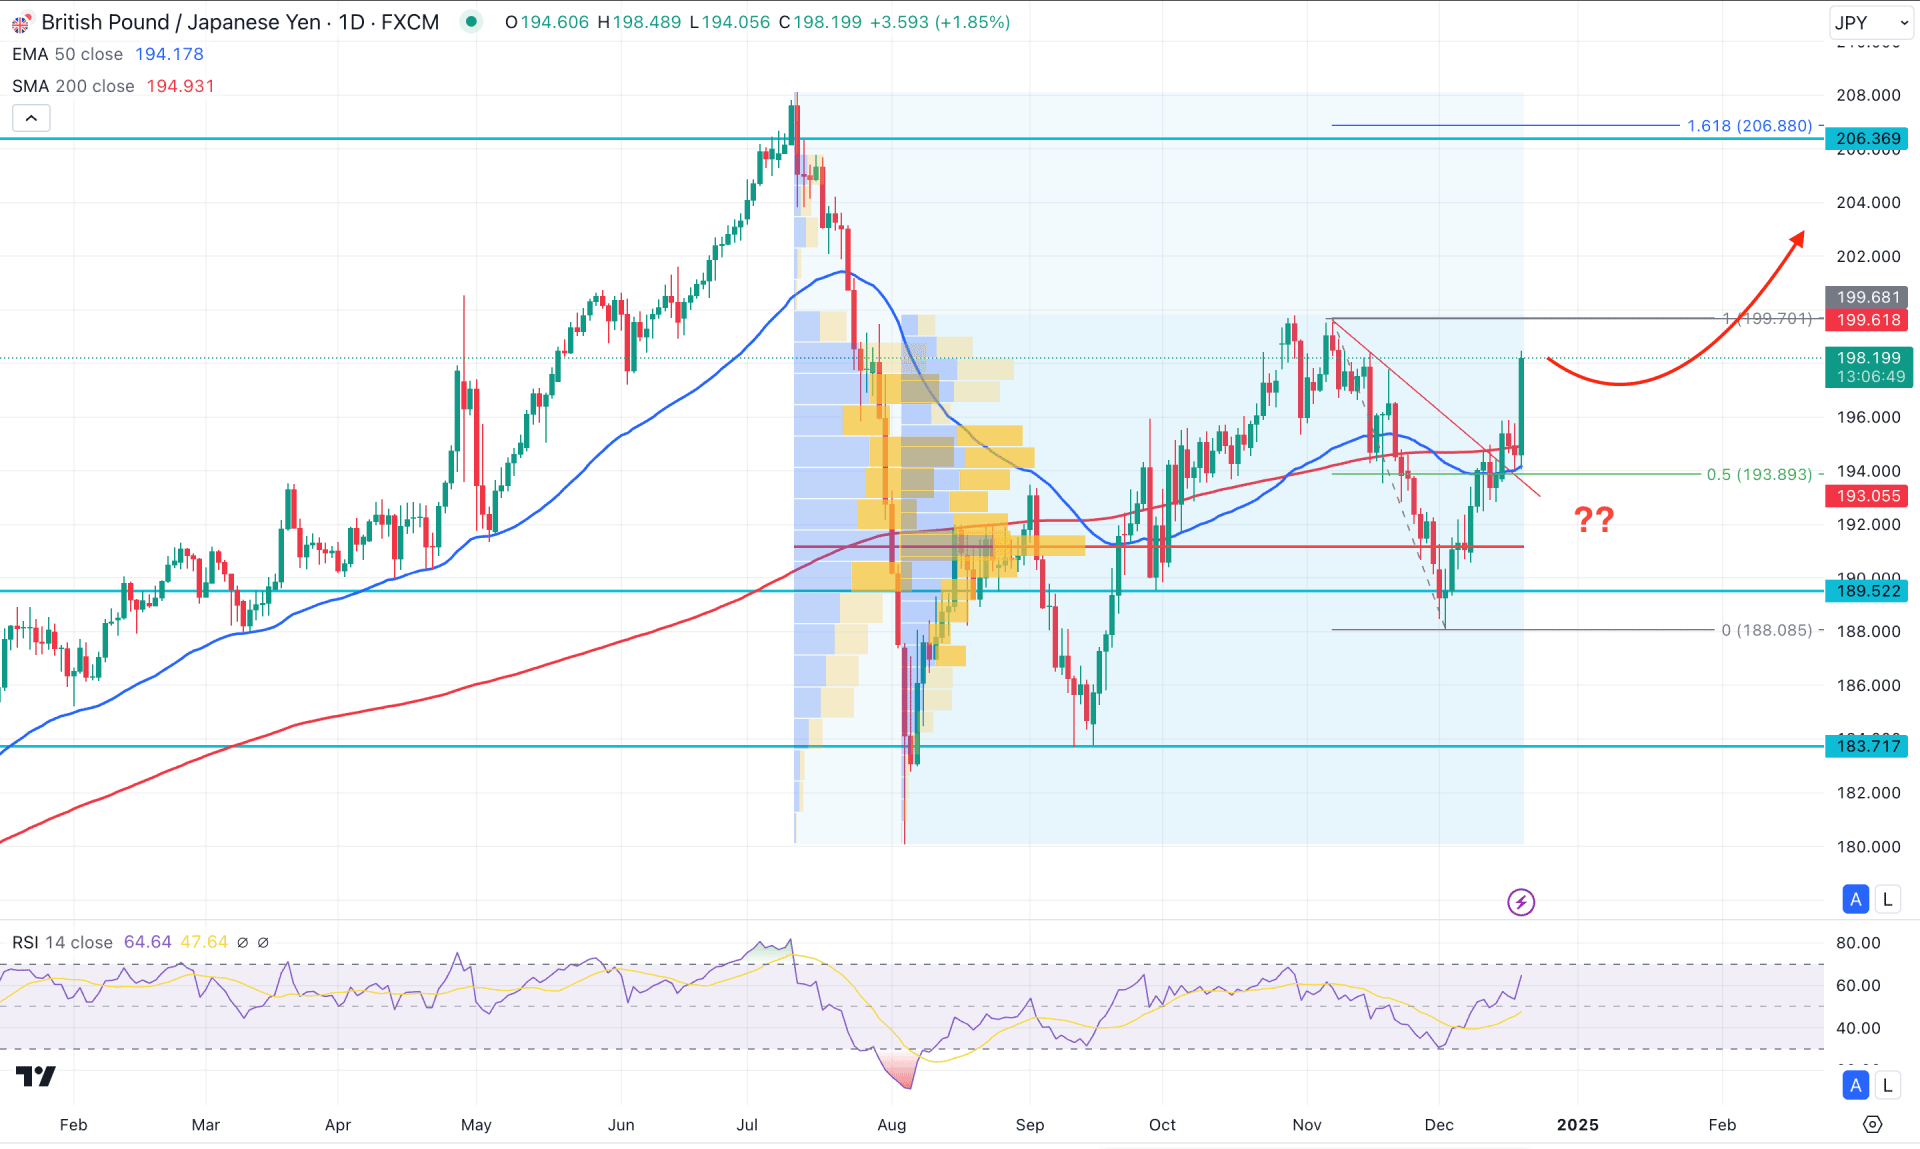
In the daily chart of GBPJPY, the recent price showed impressive bullish pressure, boosted by the post-FOMC sentiment. Primarily, the price is continuing from the trendline breakout, from which more upside pressure could come in the coming days.
In the volume structure, the bullish possibility is potent as the highest activity level since July 2024 is at 191.16 level. Moreover, the high volume line from the August Crash date is also at the same level. It is a sign of a strong investment activity in this price level, which might work as a crucial support.
However, making an investment decision needs a broader view of where the monthly candlestick analysis works as a strong price director. The ongoing buying pressure is still intact below the November 2024 high. In that case, investors should closely monitor how the price trades at this crucial resistance. A failure to overcome this line could be a bearish factor for this pair during this yearly decrease period.
In the main chart, the latest daily candle showed a strong green candle confirming the trendline breakout. Primarily, investors might expect the price to rise after having a corrective downside pressure.
In the major structure, the 200-day SMA is just above the 50-day EMA line, while both lines are below the current price. Moreover, the Relative Strength Index (RSI) aimed higher and showed a stable position above the 50.00 neutral line. The current RSI line is yet to reach the 70.00 line, signaling more room for the upside.
Based on the daily outlook of GBPJPY, a valid downside correction from the current area could attract bulls to join the market from the discounted zone. On the upside, breaking above the 199.70 resistance level could be a crucial factor, which might extend the momentum above the 206.88 Fibo Extension level.
However, the latest candle has created a price inefficiency, which needs a downside correction before forming a bull run. However, the 200-day SMA would be the last barrier to bulls as breaking below this line could lower the price towards the 183.71 support level.

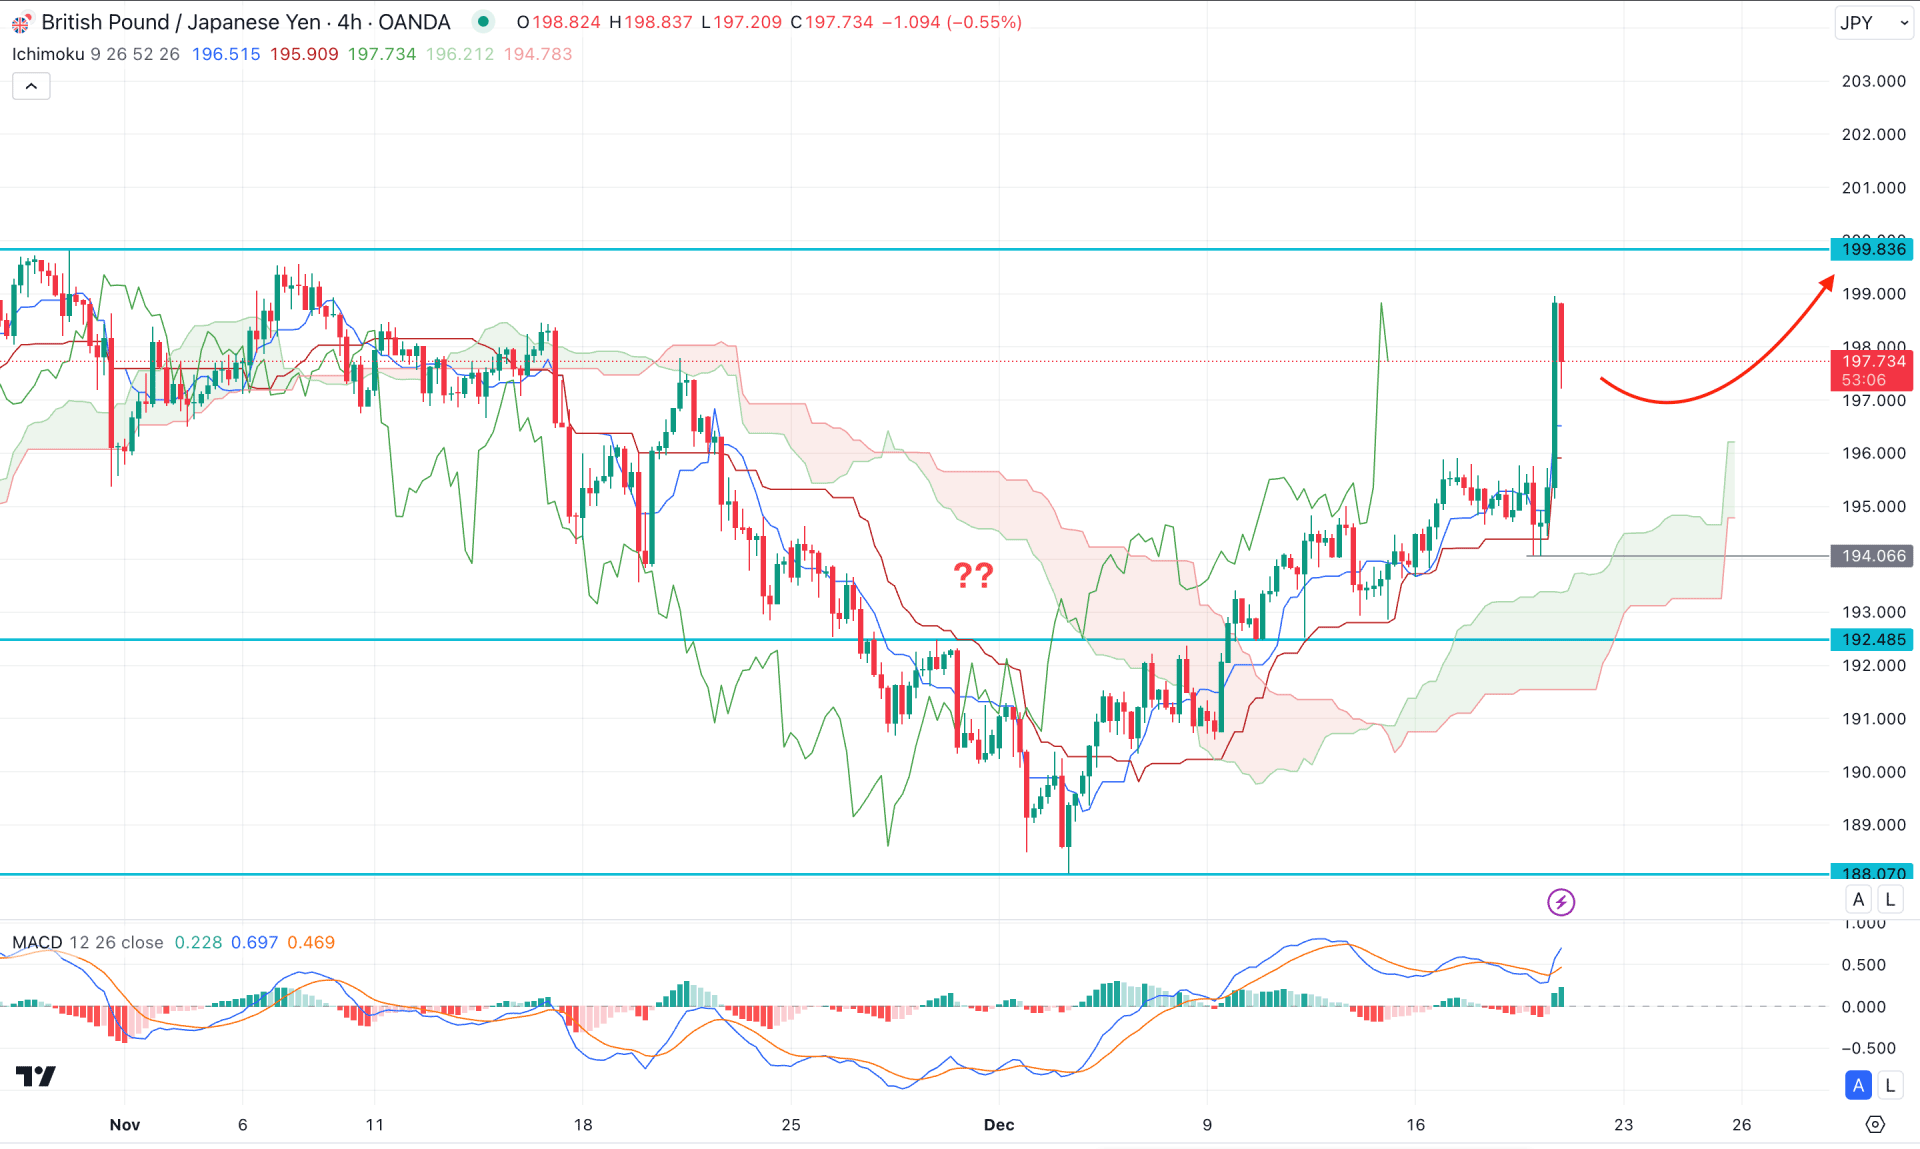
The intraday price is overextended above the Ichimoku cloud zone, which needs proper validation from the daily close. Primarily, the Future Cloud looks positive as both Senkou Lines are hearing upwards.
In the main chart, the price moved way above the dynamic Kijun Sen and Tenkan Sen lines, signaling a pending downside correction as a mean reversion. Also, the MACD Histogram reached the bullish zone, signaling a buying pressure in the market.
Based on this outlook, investors might expect a bullish continuation from the 196.00 to 192.48 zone. However, a proper price reversal from the candlestick pattern is needed before aiming for the 200.00 psychological line. Overcoming the 199.00 psychological line could increase the bullish possibility above the 204.00 area.
On the bearish side, investors should monitor how the price reacts at the 198.00 to 200.00 zone, as any immediate selling pressure from this area could test the dynamic Ichimoku Cloud zone. However, a bearish break below the Ichimoku Cloud low with a bearish H4 close might extend the selling pressure toward the 188.07 support line.

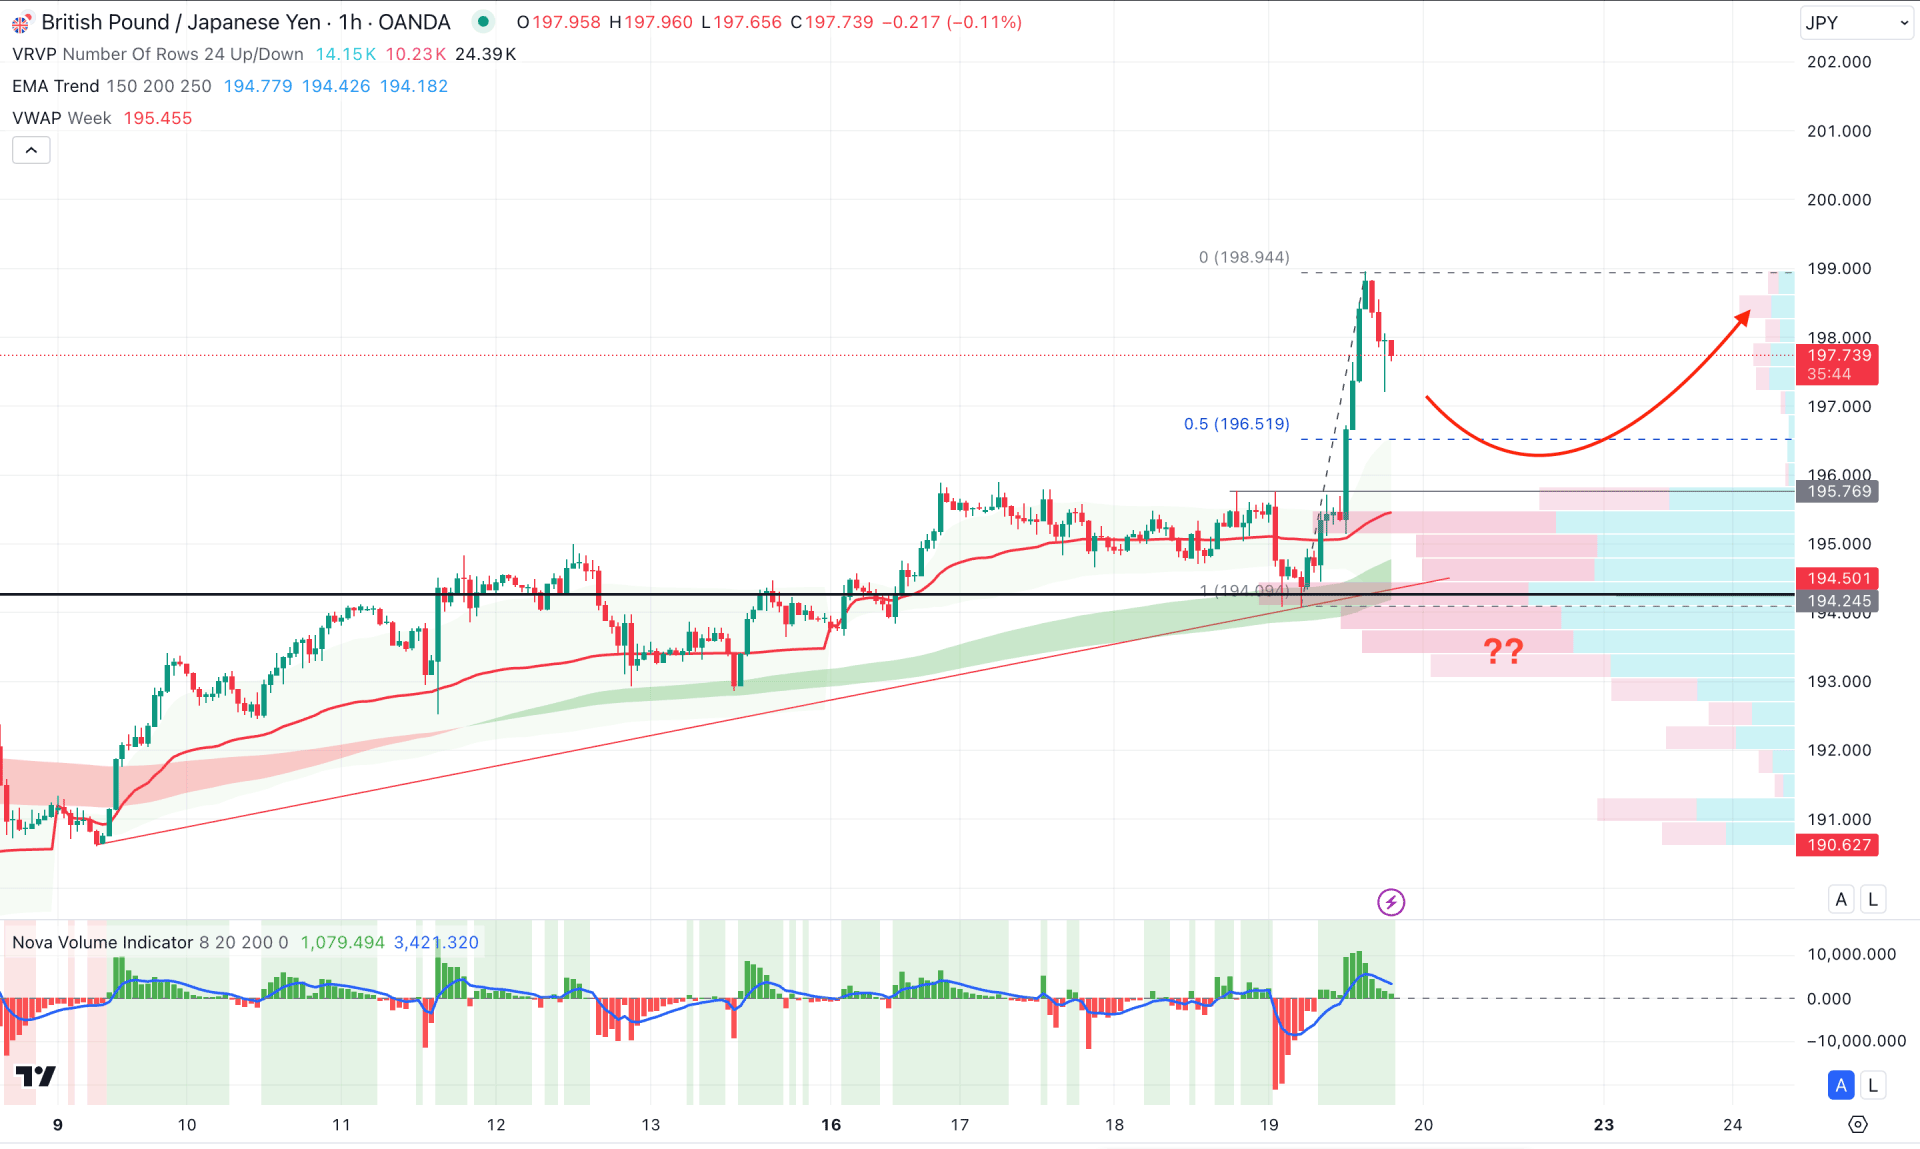
In the hourly time frame, the recent price showed a strong bullish pressure taking the price to the monthly high area. However, the intraday price showed a minor selling pressure from the top, from where a decent correction might happen.
In the broader context, the visible range high volume line is still below the current price, working as a major support. Moreover, the Moving Average wave consists of MA 150 to 250 lines that are below the current price, working as a confluence of bullish pressure at the high volume line.
Based on this outlook, the downside correction is not over, as shown by the Volume Histogram. In that case, the price is more likely to extend the bearish correction towards the 196.51 Fibonacci Retracement level. In that case, a bullish reversal from the 196.00 to 194.20 zone could be a potential buy zone, targeting the 199.00 level.
However, the immediate selling pressure might result in a bearish trend reversal after having an immediate daily close below the above-mentioned high volume line.
Based on the current market outlook, GBPJPY is more likely to extend the bullish pressure after a decent downside correction. The intraday price is already at the resistance area, from which more selling pressure might come before continuing the major bullish trend.