
Published: March 22nd, 2023
The early March Financial Crisis appears to be strengthening and spreading. Bitcoin (BTC) has reached a nine-month high as speculators flock to it. Nevertheless, with BTC cooling off over the weekend, a bearish divergence appears to be emerging, which could be a bullish sign for altcoin markets.
STEPN is a mobile game on the Solana blockchain that uses NFTs. Walking, jogging, or running in NFT sneakers earns GMT tokens. The platform aims to motivate millions to live healthier and join Web3. STEPN's move-to-earn crypto software blends Game-Fi with Social-Fi.
STEPN's Game-Fi project encourages users to fight climate change, eat healthily, and join the Web3 community. Social-Fi supports user-generated Web3 content. STEPN's news is positive about the GMT price hike as platform usage grows.
An amazing upside possibility in GMT/USDT price might come from the AI integration into the system. AI-driven blockchain technologies can automate activities, improve productivity, and provide vital insights. Avorak AI uses blockchain technology to make STEPN secure, transparent, and private.
Should you invest in GMT/USDT now? Let’s see the complete price projection from the GMT/USDT technical analysis:
In the higher timeframe price action, the broader market outlook is bullish for GMT/USDT. The current weekly candle is backed by an impulsive bullish candle, where the current price is still within a corrective mode.
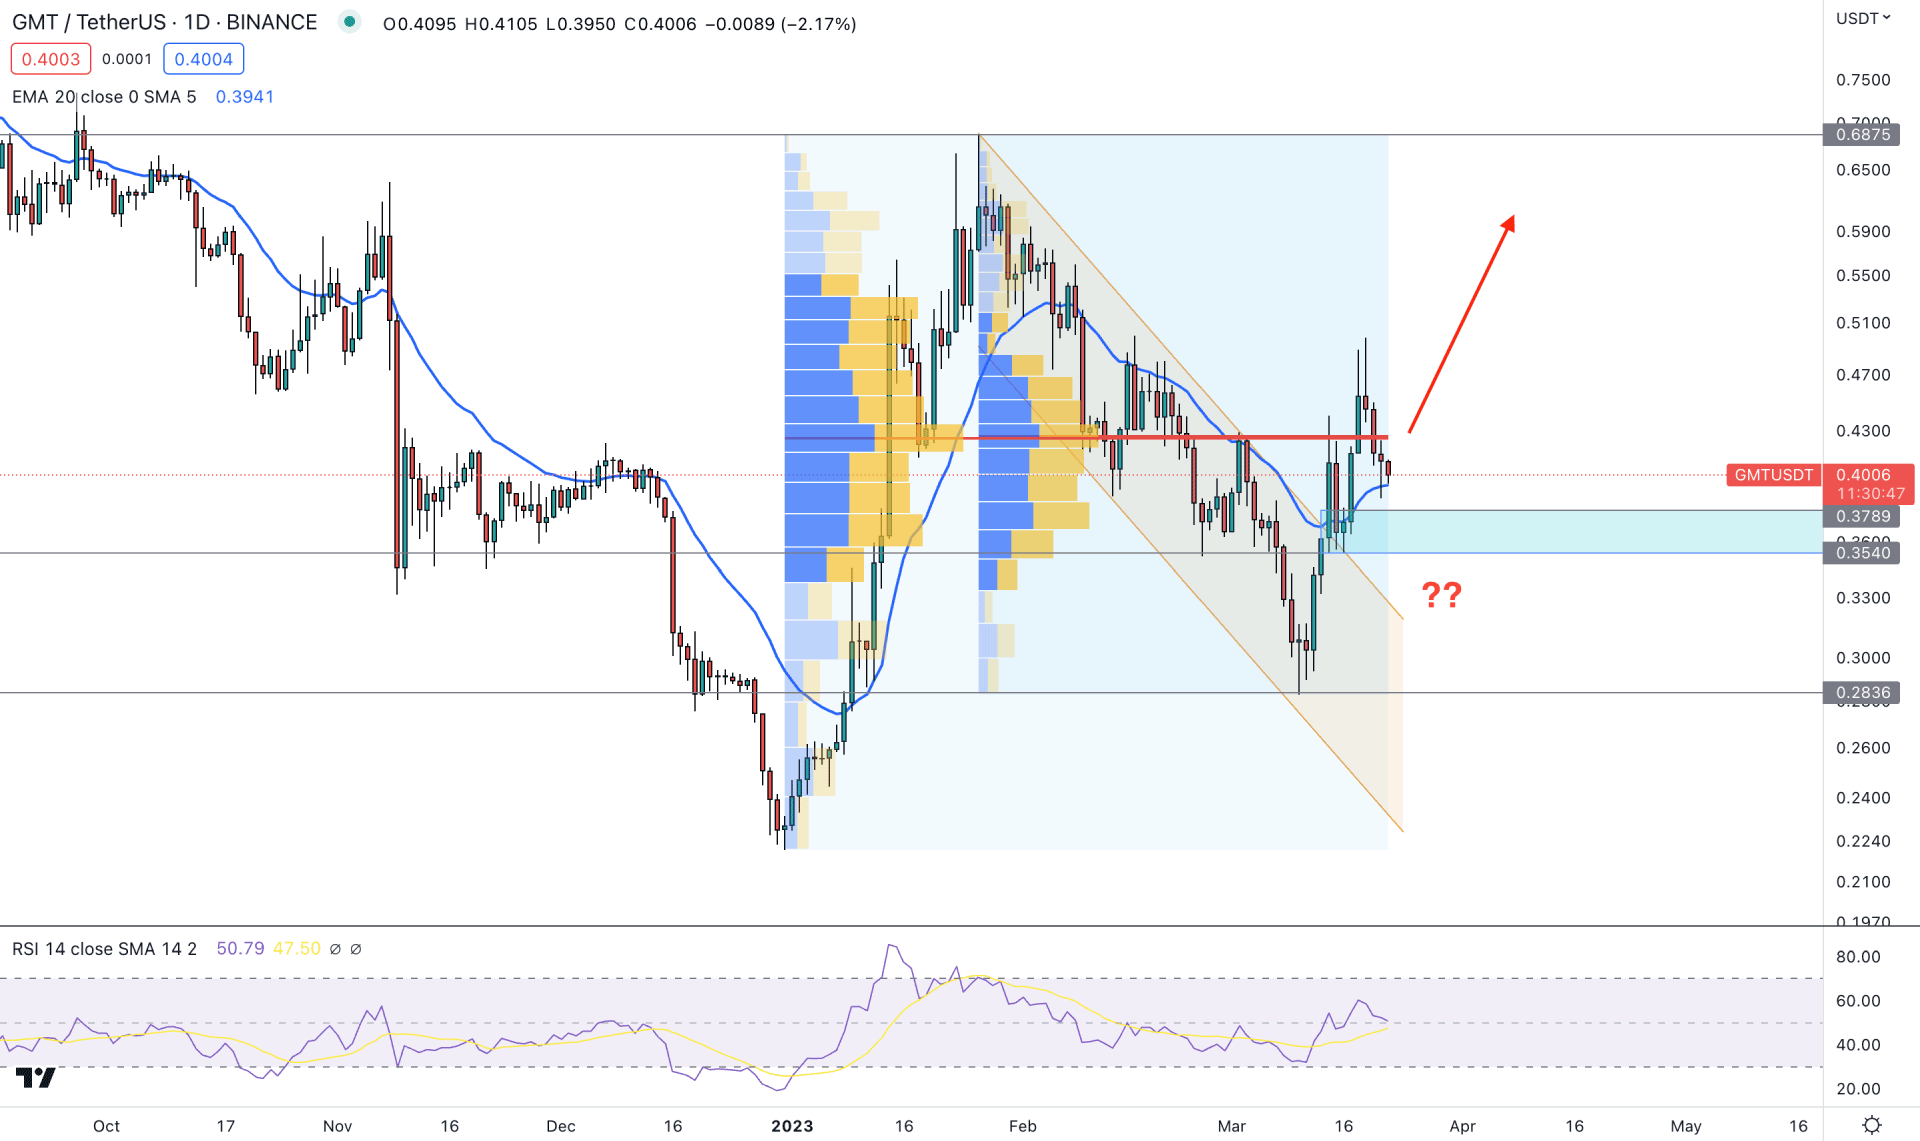
In the daily chart, the primary bullish outlook comes from the descending channel breakout with a valid bottom formation at the 0.2836 level. Moreover, the current buying pressure is backed by a bullish rally-base-rally formation. In that case, a downside correction and a bullish price action from the near-term demand zone could be an investment opportunity.
The bullish pressure needs some clues to find institutional traders' interest. As per the high volume level from December to March, the highest activity level is spotted at 0.4257 level, which is above the current price. Another high volume level from January high to Mach is also at 0.4257 level. In that case, a stable buying pressure above the 0.4257 level is needed before opening a long position in this pair.
In the main chart, the 20 DMA is the immediate support, above the 0.3789- 0.3540 demand zone. In that case, any bullish possibility from this area could offer a decent long opportunity towards the 0.500 area.
The Relative Strength Index (RSI) shows the same story, where the current level is stable above the 50.00 area.
Based on the daily outlook, a buying possibility is possible in this pair if a stable market is seen above the latest high volume level. The primary target of the bull run would be towards the 0.5500 level.
However, a downside pressure with a bearish D1 candle below the 0.3540 level is needed to open a short opportunity, targeting the 0.2800 area.
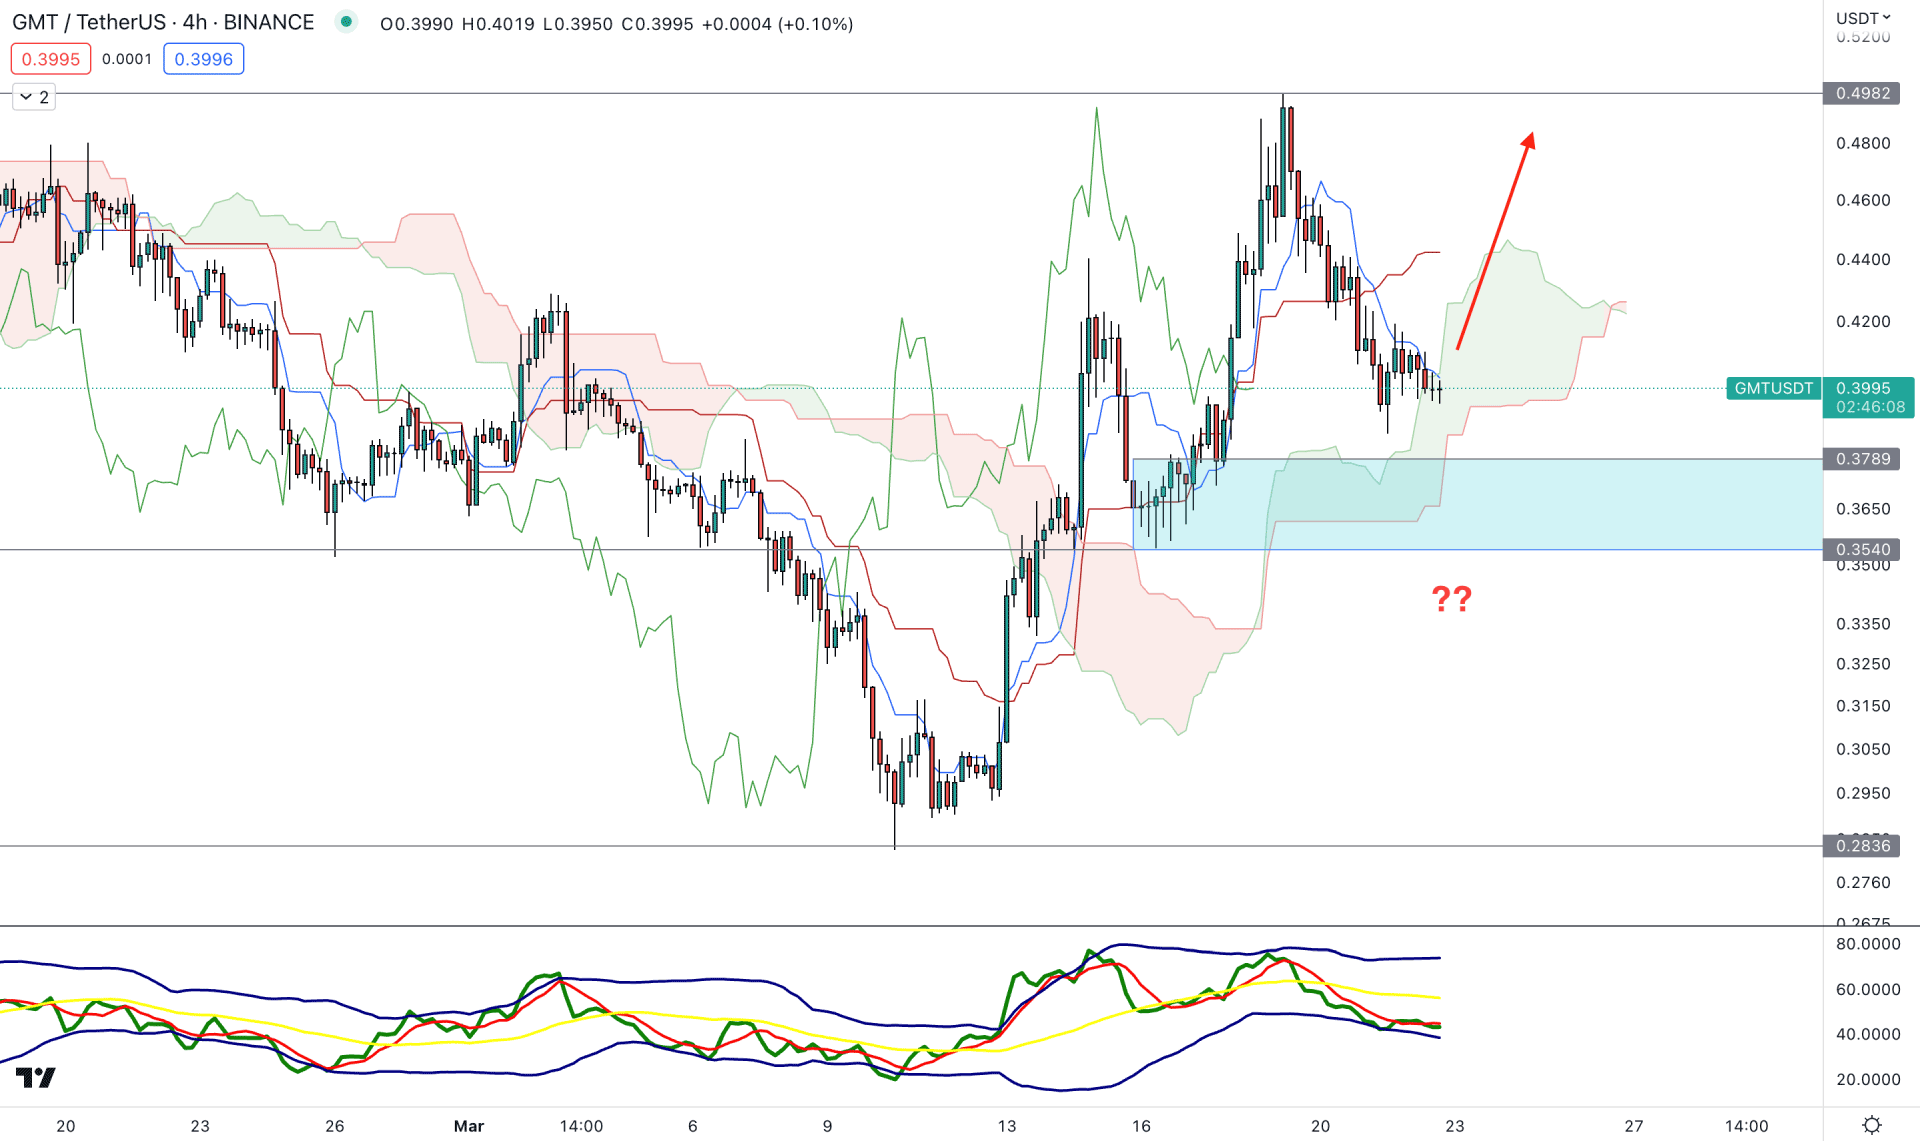
According to the Ichimoku Cloud, the current bullish outlook is solid as the current price is stable above the cloud area.
However, a considerable correction is seen in this pair with a bearish crossover between Tenkan Sen and Kijun Sen. In that case, a bullish price action and a recovery are needed before opening any long position in this pair.
The Traders Dynamic Index (TDI) shows the same story, where the current TDI level shows a buying momentum from the bottom.
Based on this structure, investors should closely monitor how the price reacts on the cloud support. A bullish recovery with an H4 candle above the dynamic Kijun Sen could open a long opportunity, targeting the 0.5500 level in the coming hours.
The alternative approach is to look for short opportunities if the H4 candle comes below the 0.3500 level with a bearish close.
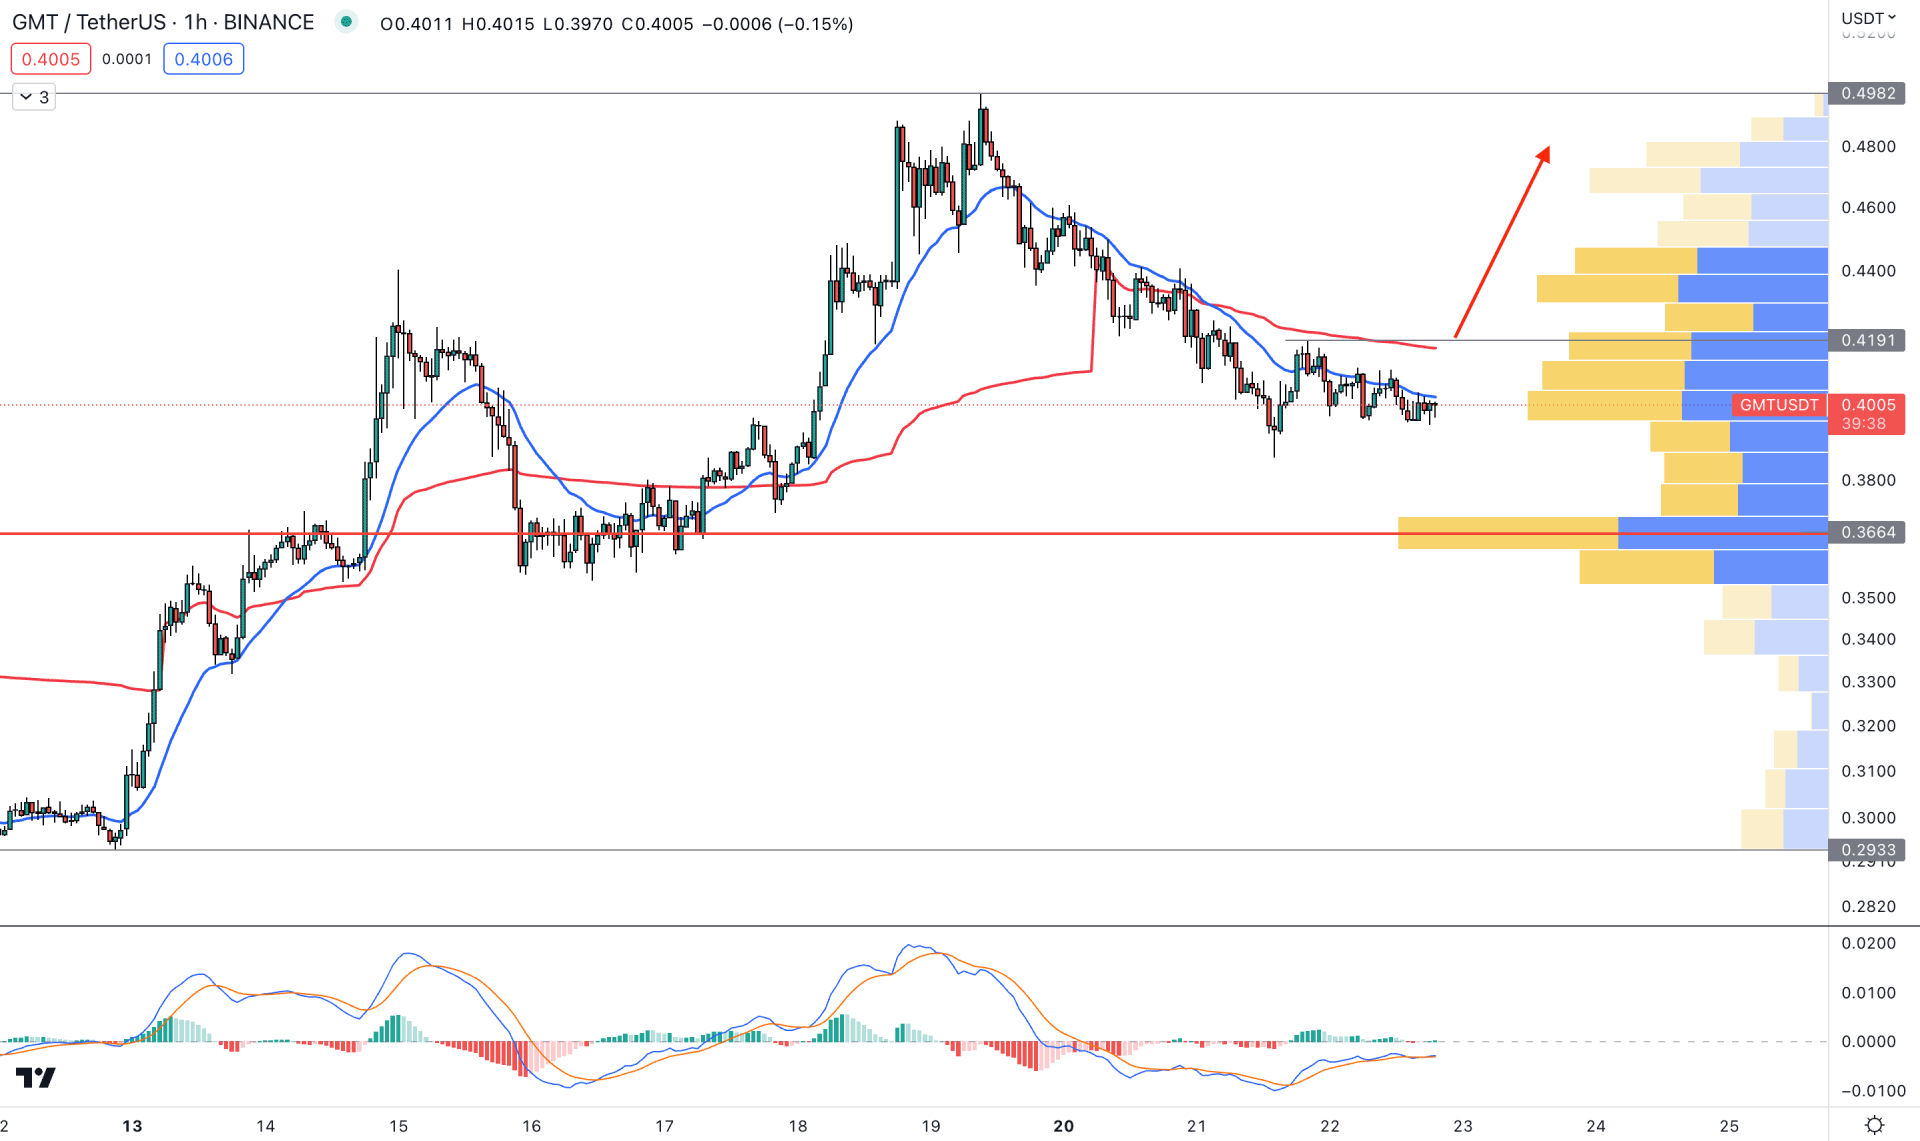
In the GMT/USDT H1 chart, the bearish correction is active, where the current price is trading sideways below the dynamic 20 Exponential Moving Average.
However, the latest visible range high volume level is below the current price, which will be the ultimate barrier for sellers. The MACD Histogram also shows the same structure, where MACD EMA’s are aiming higher with buying possibility.
Based on the H1 structure, an H1 candle above the dynamic VWAP resistance could open a long opportunity, targeting the 0.4982 level. On the other hand, breaking below the 0.3664 high volume level could lower the price towards the 0.3200 area.
Based on the current market structure, GMT/USDT is more likely to increase, but a sufficient bullish pressure with valid price action is needed. Therefore, investors should monitor how the price reacts in the near-term demand zone to find a high probable buying opportunity.


