
Published: June 3rd, 2026
As the remittance industry continues to expand into blockchain-based international payments, MoneyGram introduced MGUSD, the US dollar stablecoin based on Stellar.
The business announced that MGUSD will be incorporated with the MoneyGram app via a self-custodial wallet, enabling users to keep balances denominated in dollars, transfer money internationally, and convert to local currencies. With intentions to expand globally, the stablecoin was first introduced in the US market.
According to MoneyGram, MGUSD expands on its enduring collaboration with the Stellar Development Foundation. The stablecoin is a further step into issuance, balance infrastructure, and wider network utility, according to the business.
According to World Bank data, the average cost of transmitting $200 across borders in the 3rd quarter of 2025 was 6.36%, which means that fees and foreign currency margins took up roughly $12.72 of a $200 transfer. That is still more than twice the 3% target set by the UN Sustainable Development Goals.
Let's see the further outlook from the XLM/USDT price analysis:
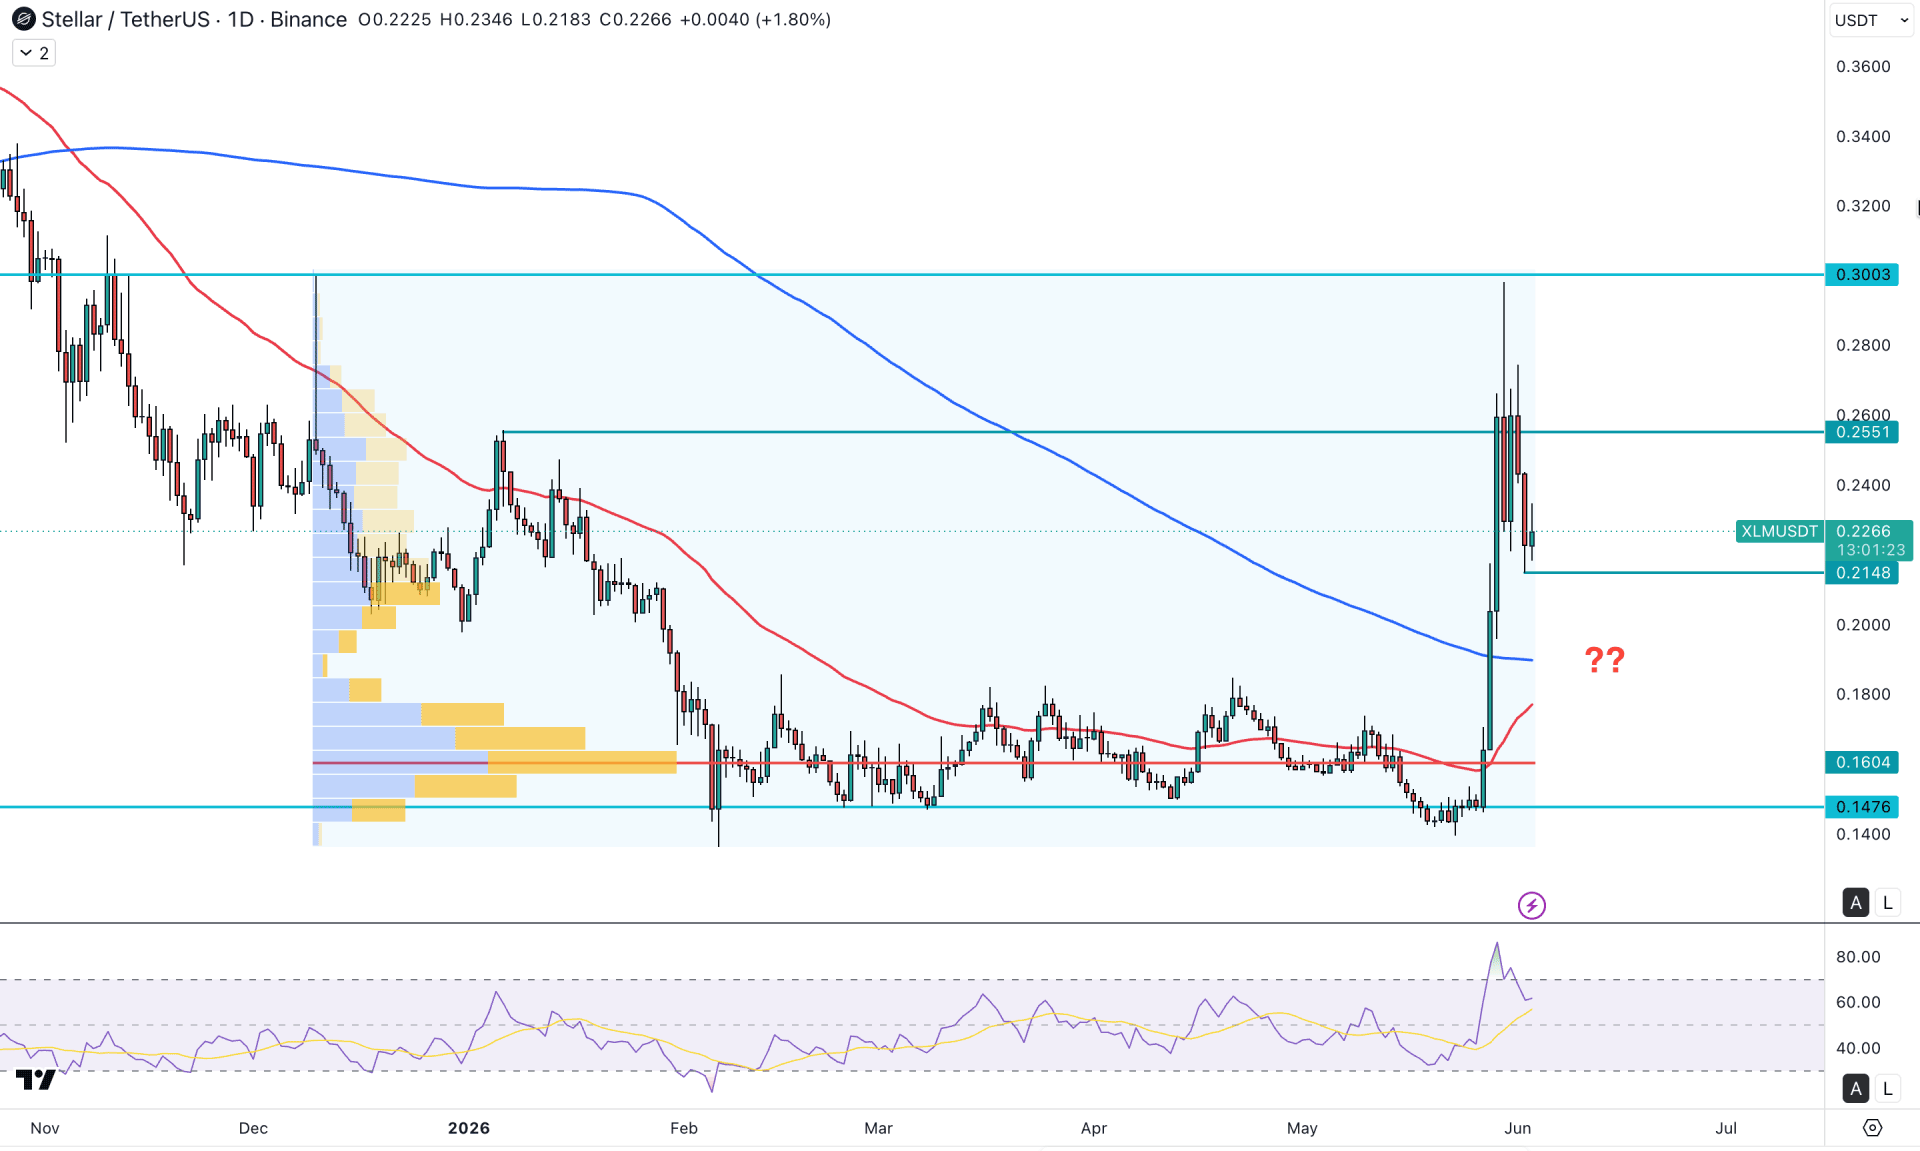
In the daily chart of XLM/USDT, the recent price shows a valid bullish breakout with impulsive momentum. As the price spiked higher and created a new yearly high, investors should closely monitor how it reacts in the premium zone to avoid any unexpected pump and dump.
Looking at the higher time frame, the recent buying pressure is solid as the price formed a valid monthly close above the four-month high. Moreover, the buying pressure came with a valid breakout after consecutive doji formation. The weekly timeframe shows a similar structure, where a strong range breakout is clear. However, after forming such a massive breakout, a minor correction could appear, creating a limit to further buying pressure.
In the volume structure, the most active level since December 2025 is at the 0.1604 level, which is in line with the breakout point. As the recent price formed a massive breakout from this area with no significant high volume area formation at the top, the main anticipation would be on the buyers' side only. However, a considerable correction is pending as the price needs some position loading before continuing the existing momentum.
In the main price area, the breakout appeared with impulsive pressure and formed multiple daily candles above the 200-day SMA line. However, unstable price action is seen at the 0.2551 area with an indecisive candlestick formation in the daily chart. As the price aimed higher from the 200 SMA line, there is a higher possibility of a correction testing any available near-term support area before continuing the existing trend.
The Relative Strength Index has rebounded from the 80.00 level and is currently hovering in the 60.00 area, signaling corrective buying pressure.
Based on the overall market structure and the top increase, the possibility of an extended down correction exists. The immediate support to look at is the 200-day SMA. Primarily, a failure to hold the buying pressure above the 0.2148 swing low, could increase the possibility of targeting the 0.1800 area.
On the other hand, a bullish rebound from the 200 SMA with valid price action could resume the existing trend and make a new swing high beyond the 0.3000 area.
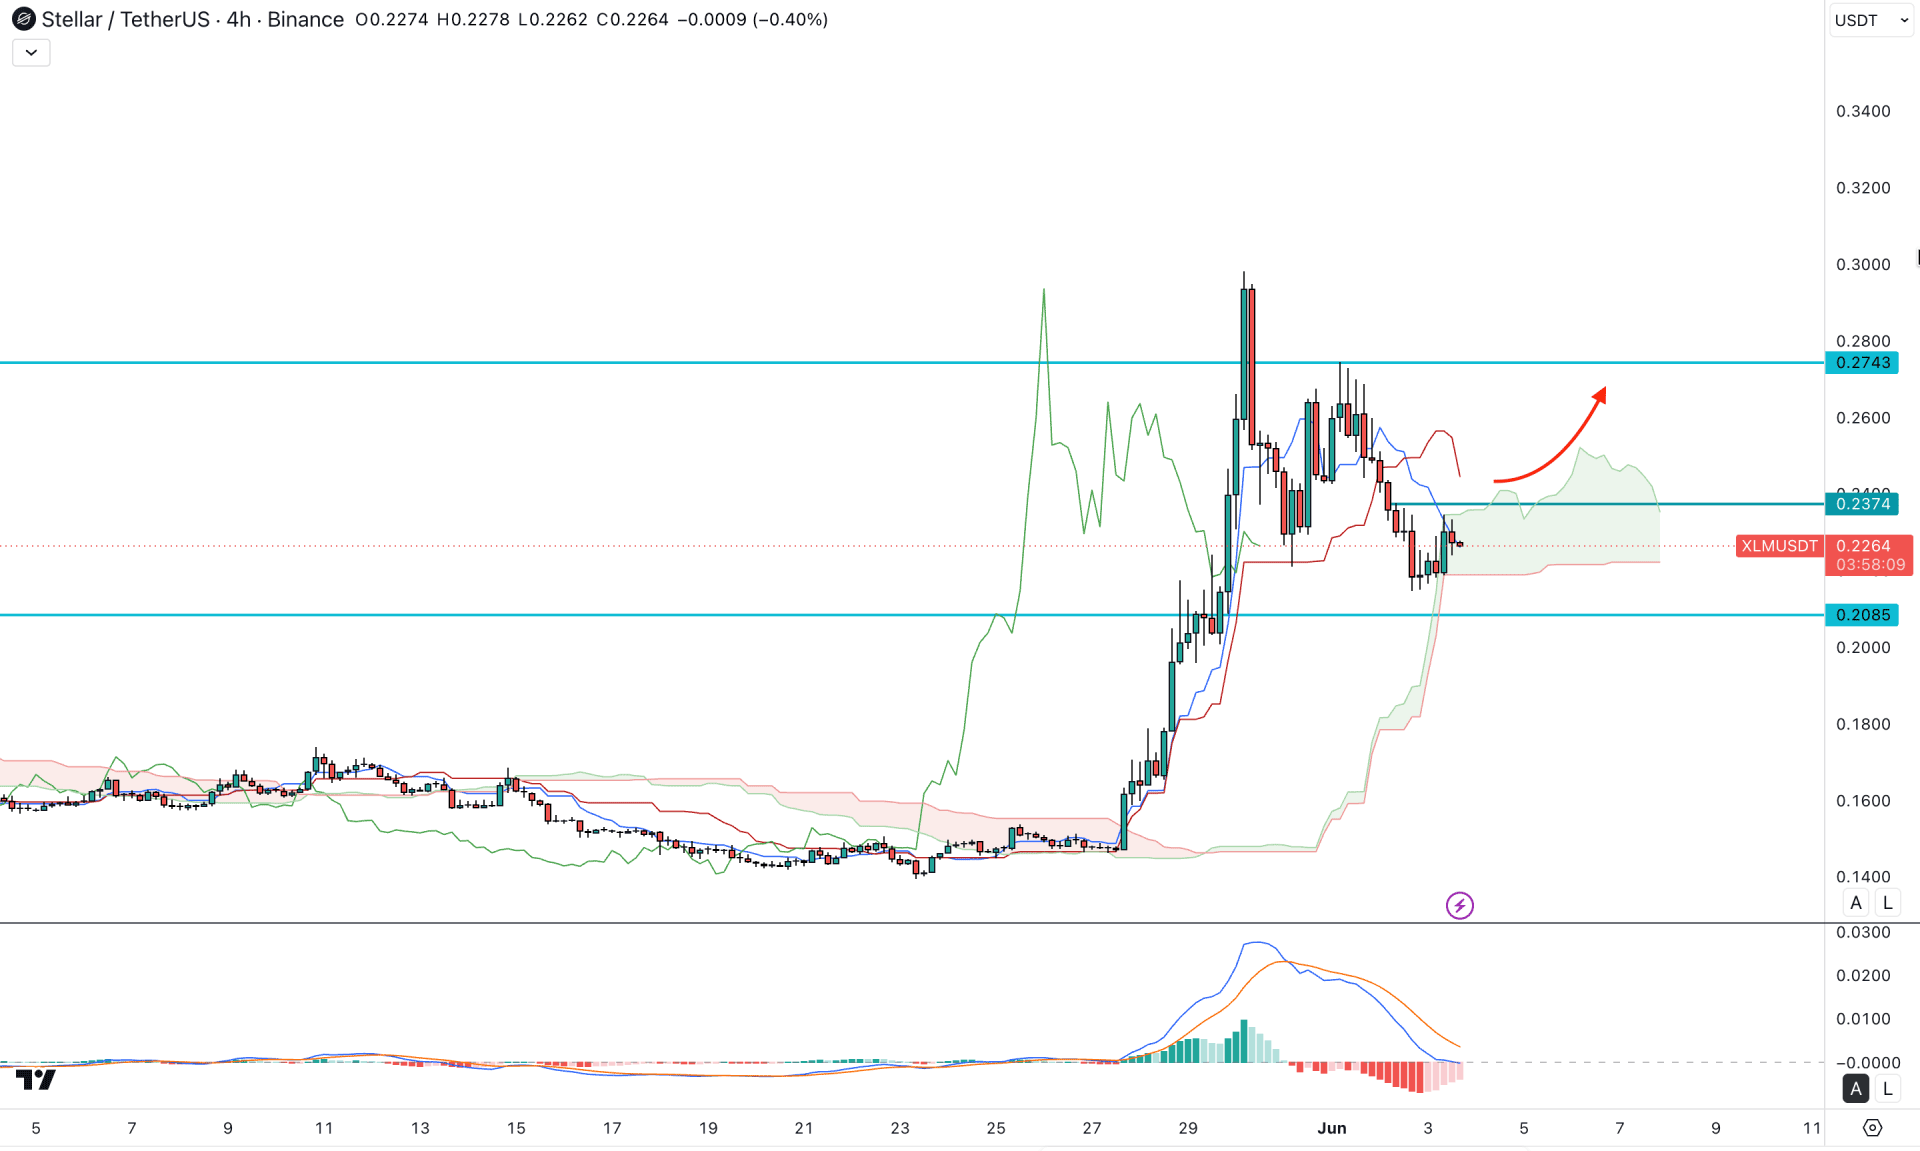
In the H4 chart of XLM/USDT, the price is trading within bullish pressure. The cloud area is closer to the current price and acting as active support. However, the future cloud is showing a different story where Senkou Span A is aiming lower and Span B remains flat. It is a sign of weaker short-term bullish momentum followed by a medium-term bullish trend.
Moreover, the price rebounded below dynamic lines, signaling pressure to buyers. The indicator window shows a similar story where the signal line has rebounded to the neutral area while the histogram is still below the zero point.
Based on the current market structure, profit-taking is possible in the premium zone from higher timeframes; more confirmation is needed before anticipating a bullish continuation. Primarily, a bullish break above the 0.2374 resistance level could increase the possibility of testing the 0.2743 level. Moreover, beyond this line, the price is likely to overcome the 0.3400 resistance level.
On the other hand, if the price looks sideways within the cloud area from higher timeframes, a failure to hold the buying pressure above the 0.2085 support level could be a challenging factor for buyers, as it could increase the possibility of getting a new swing low below the 0.1950 level.
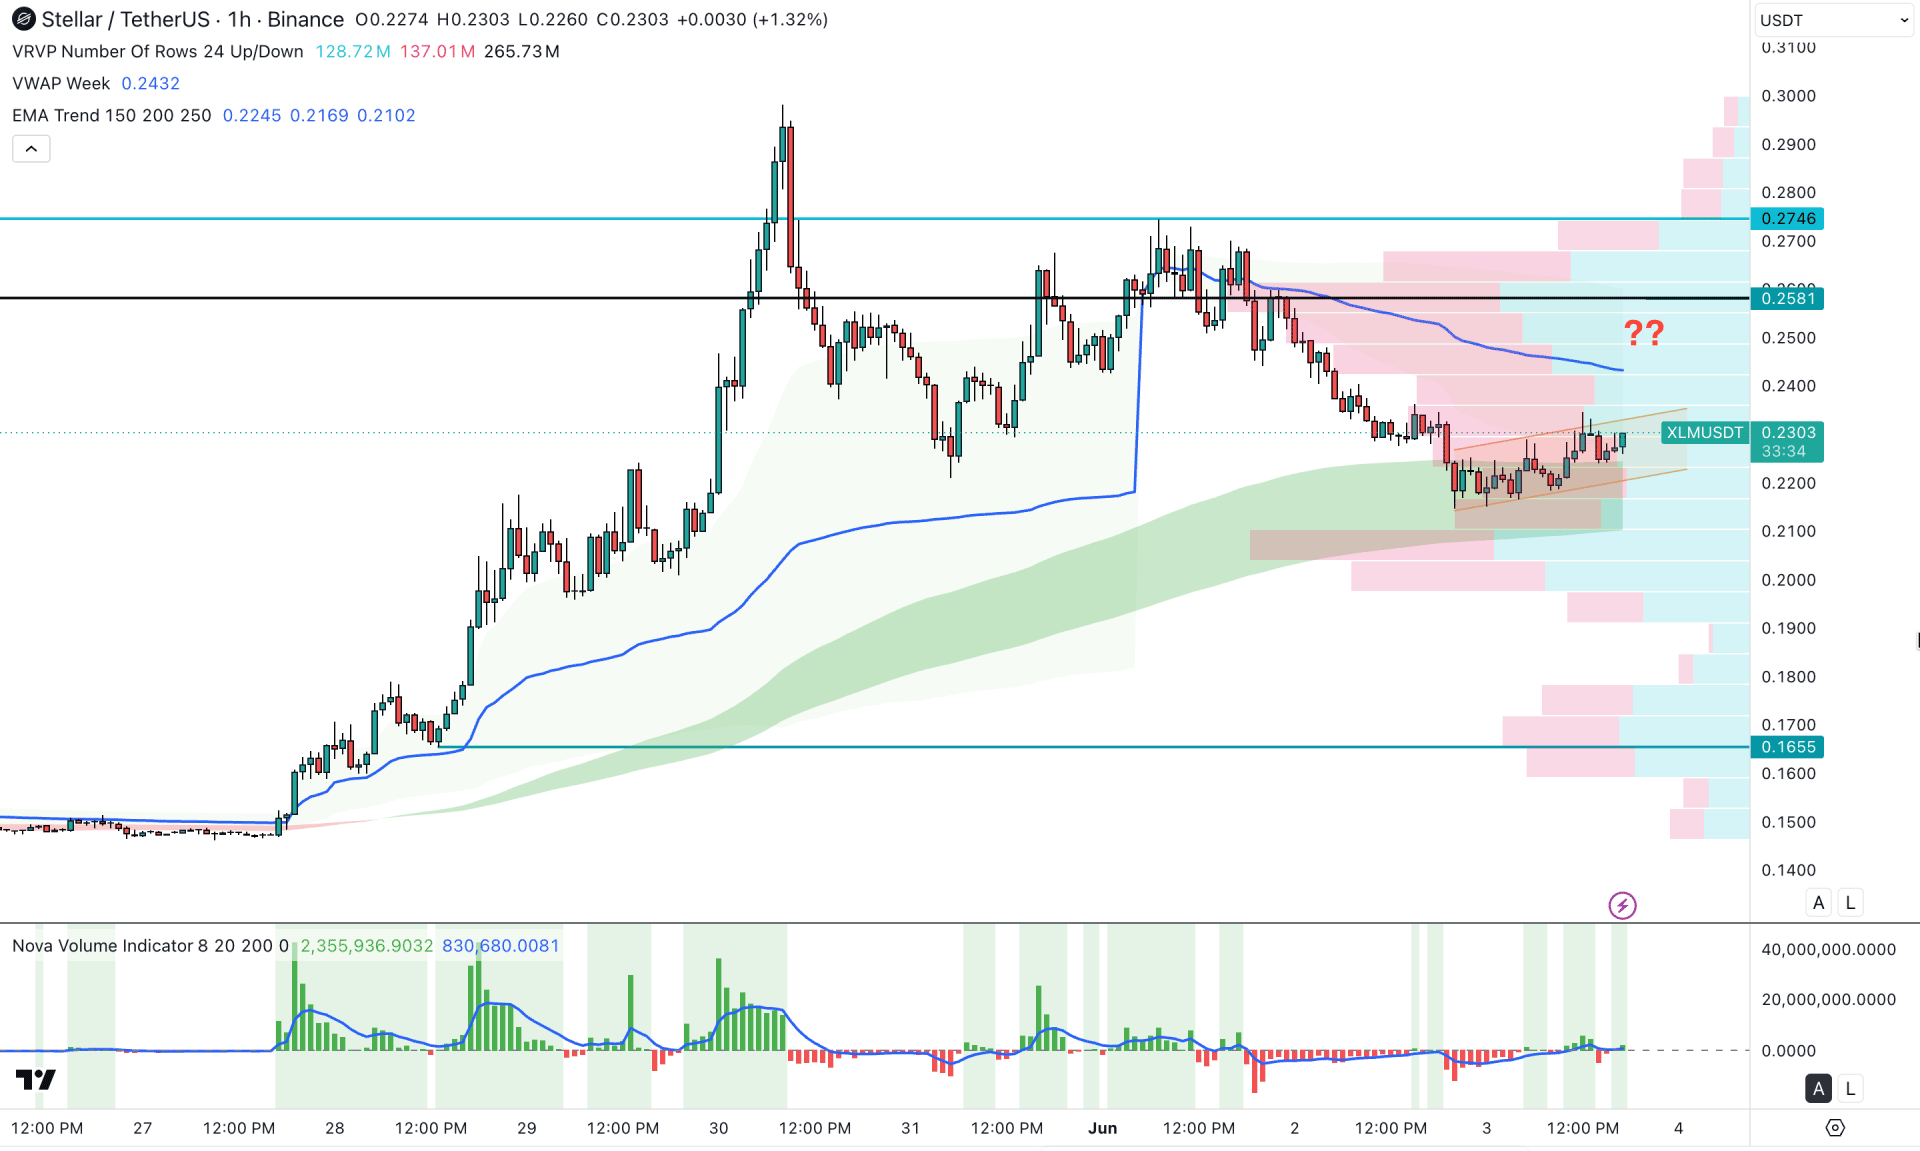
In the hourly timeframe, the price is trading within bearish pressure as a modest recovery is visible below the weekly VWAP level. Moreover, the high volume node is above the current price, signaling active selling pressure.
In the volume indicator, the recent histogram showed a bullish rebound with a positive-negative-positive formation, signaling minor buying pressure.
Based on this outlook, the price is trading in a premium zone where a bearish break with an hourly close below the EMA wave could validate a short opportunity targeting the 0.1655 level.
On the other hand, an ongoing recovery, which breaks above the 0.2581 high volume node, could resume the existing trend at any time.
Based on the overall market structure, XLM/USDT is trading at a crucial premium zone from higher timeframes. Bullish momentum needs additional attention. Investors should closely monitor how the price holds the buying pressure from the daily swing low, as a potential recovery could create a new swing high soon.


