
Published: September 5th, 2023
Developers of the Stellar network have proposed a modification to the transaction submittal procedure. In order to accomplish this, an upcoming Stellar-core update will introduce a significant change: confining transactions to one per source account per ledger. According to the development team, the primary objective of this change is to improve the scalability and security of the Stellar network. Moreover, this modification is regarded as necessary to pave the way for Soroban.
This proposed modification is anticipated to have a significant effect, especially on Soroban transactions. Also, these forthcoming modifications are anticipated to be a substantial boon for the Stellar network and potentially increase the value of its native token, XML. The digital asset is trading with a stronger weekly gain, while the current price is still corrective, followed by a strong bullish trend.
While it's true that the asset's value has decreased by 90 percent over the past five years, the project continues to advance in preparation for widespread adoption, and positive momentum is developing for XLM.
Let’s see the upcoming price direction of Steller from the XLM/USDT technical analysis:
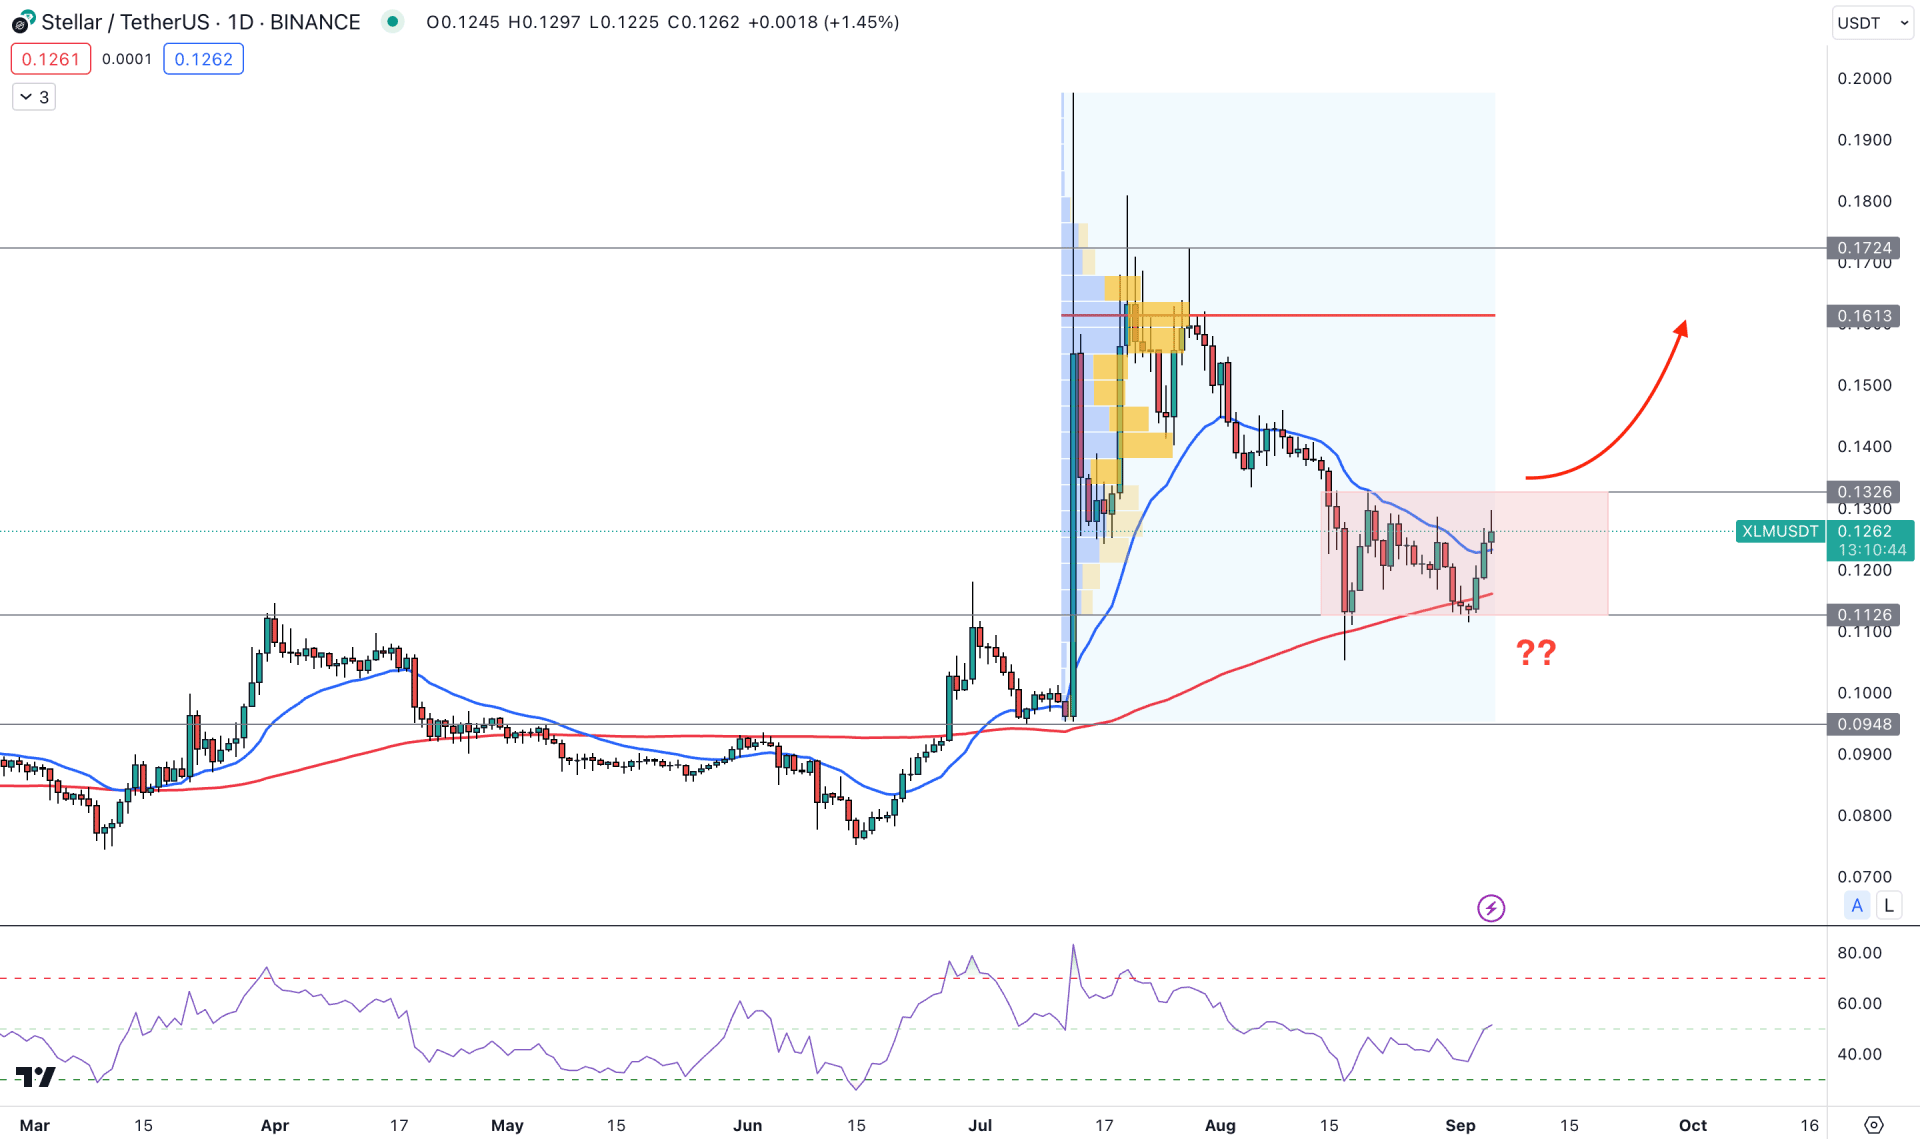
In the daily price of XLM/USDT, the broader outlook is bullish as the current price is trading within a strong bullish daily candle formed on 13 July 2023. As the current price is still trading at the discounted area for the swing formed on that day, any bullish opportunity in the lower timeframe could offer a decent trading opportunity.
In the higher timeframe’s price action, the current threat is the latest monthly candle, which closed bearish by eliminating all gains in the previous month. However, the weekly candle is still promising for bulls as recent bearish candles are corrective from where a bullish continuation is possible.
However, the daily price failed to show a sufficient buying volume at the bottom area, which is crucial to form a stable bullish trend. Since 13 July 2023, the highest trading volume has been at the 1.1613 level, which is way above the current price. In that case, a bullish recovery is pending in this pair before extending the bearish trend.
The weekly price trades at the 20 EMA level, while the daily price shows strong support at the 100-day SMA level. In the latest price, a bullish daily candle is present above the 20-day EMA, while the current RSI is above the 50.00 level.
Based on the daily outlook of XLM/USDT, the bullish possibility is potent as the current price is trading above the 0.1055 critical low. However, a rectangle pattern is seen where a bullish daily candle above the 0.1326 could indicate a trend continuation towards the 0.1613 high volume level.
On the other hand, the downside possibility is potent as the high volume level is above the current price. In that case, a bearish daily candle below the 100-day SMA could offer a stronger possibility of testing the 0.0800 level in the coming days.
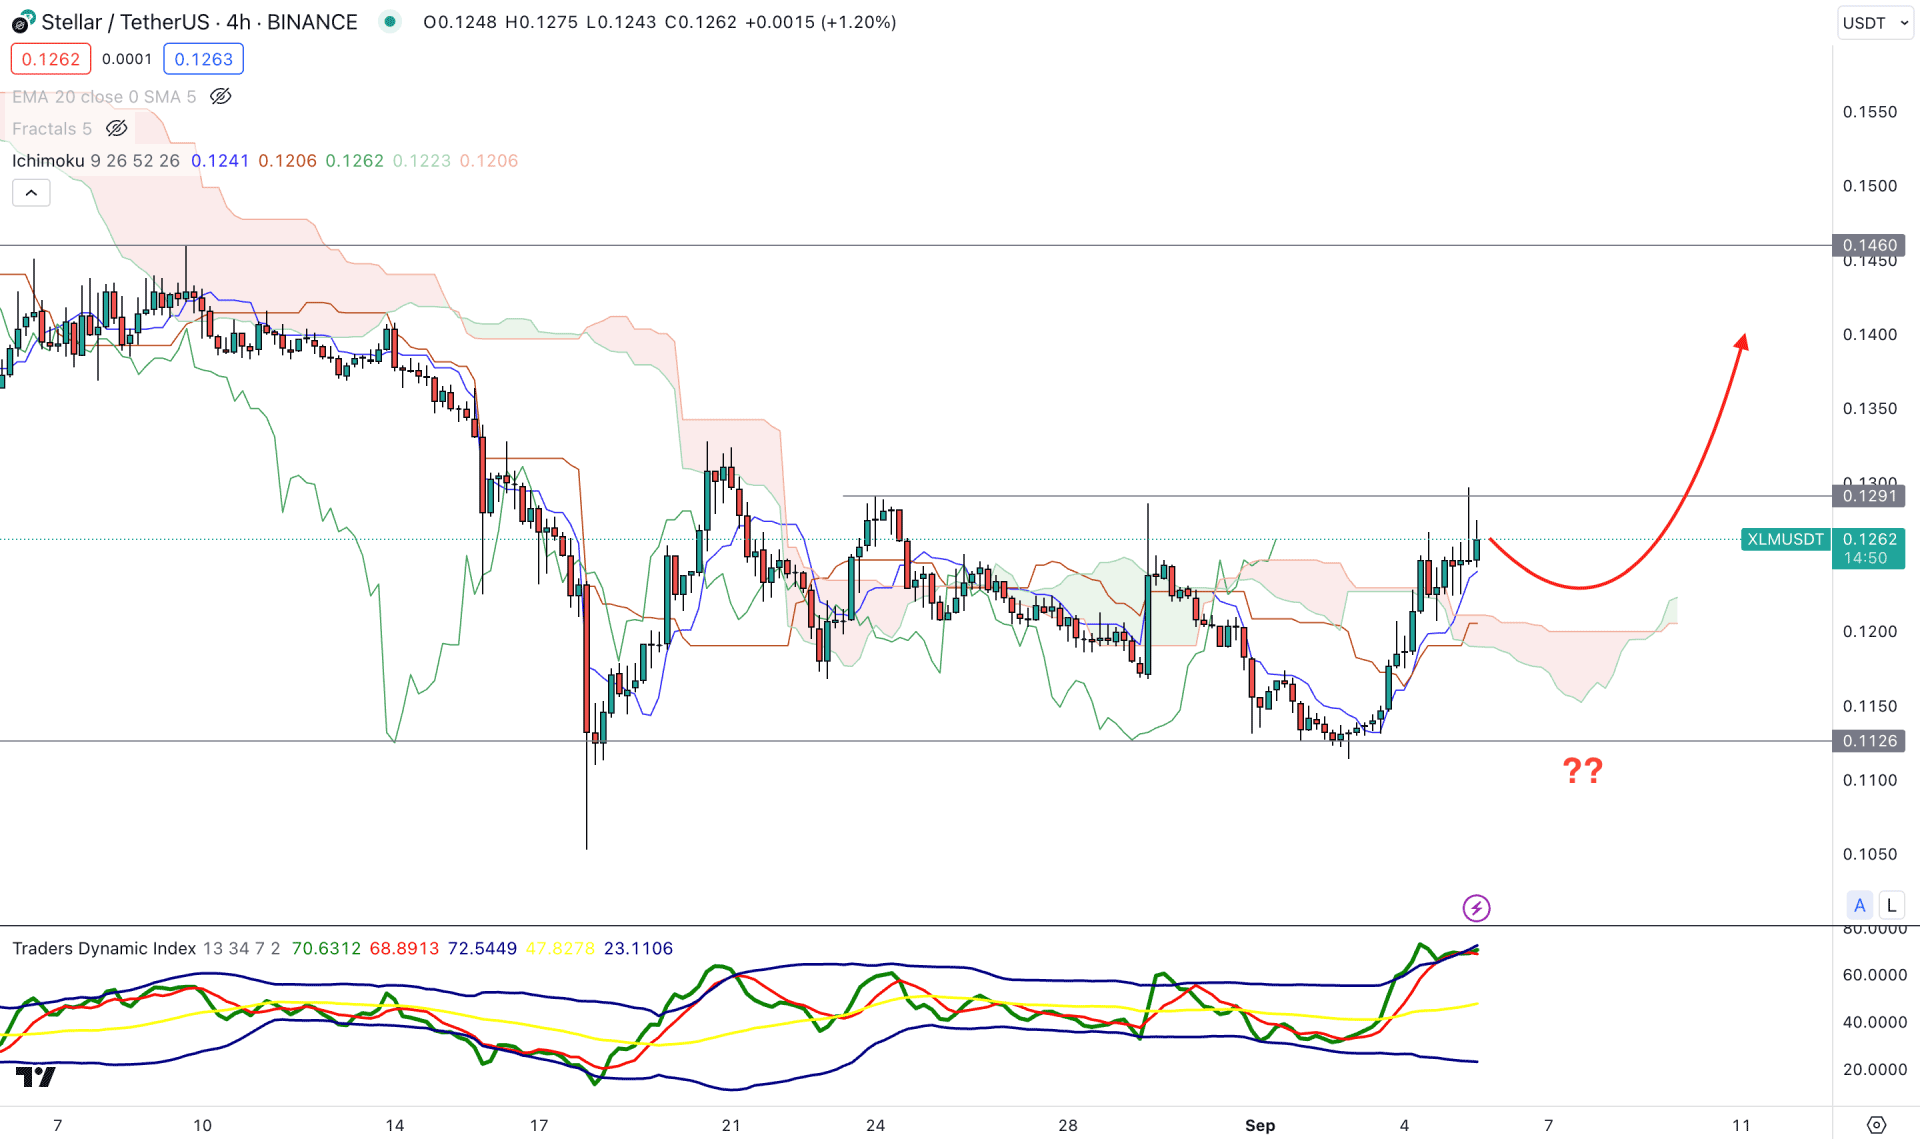
In the H4 chart, the current market outlook is corrective for the XLM/USDT, but the recent buying pressure above the Ichimoku Kumo Cloud is potential for bulls.
In the future cloud, a bullish flip is seen where the Senkou Span A is above the Senkou Span B. Moreover, the dynamic Tenkan Sen and Kijun Sen are below the current price, working as a major support.
However, the buying possibility is limited by the TDI indicator as the current TDI level reached the overbought level. In that case, a downside correction is possible after extending the bullish pressure.
Based on the H4 price outlook, the overall market structure is bullish, and a bullish rejection from the dynamic Kijun Sen or Cloud area could offer a bullish opportunity in this pair. On the other hand, a bearish H4 candle below the 0.1126 support level could limit the upside possibility for the coming session.
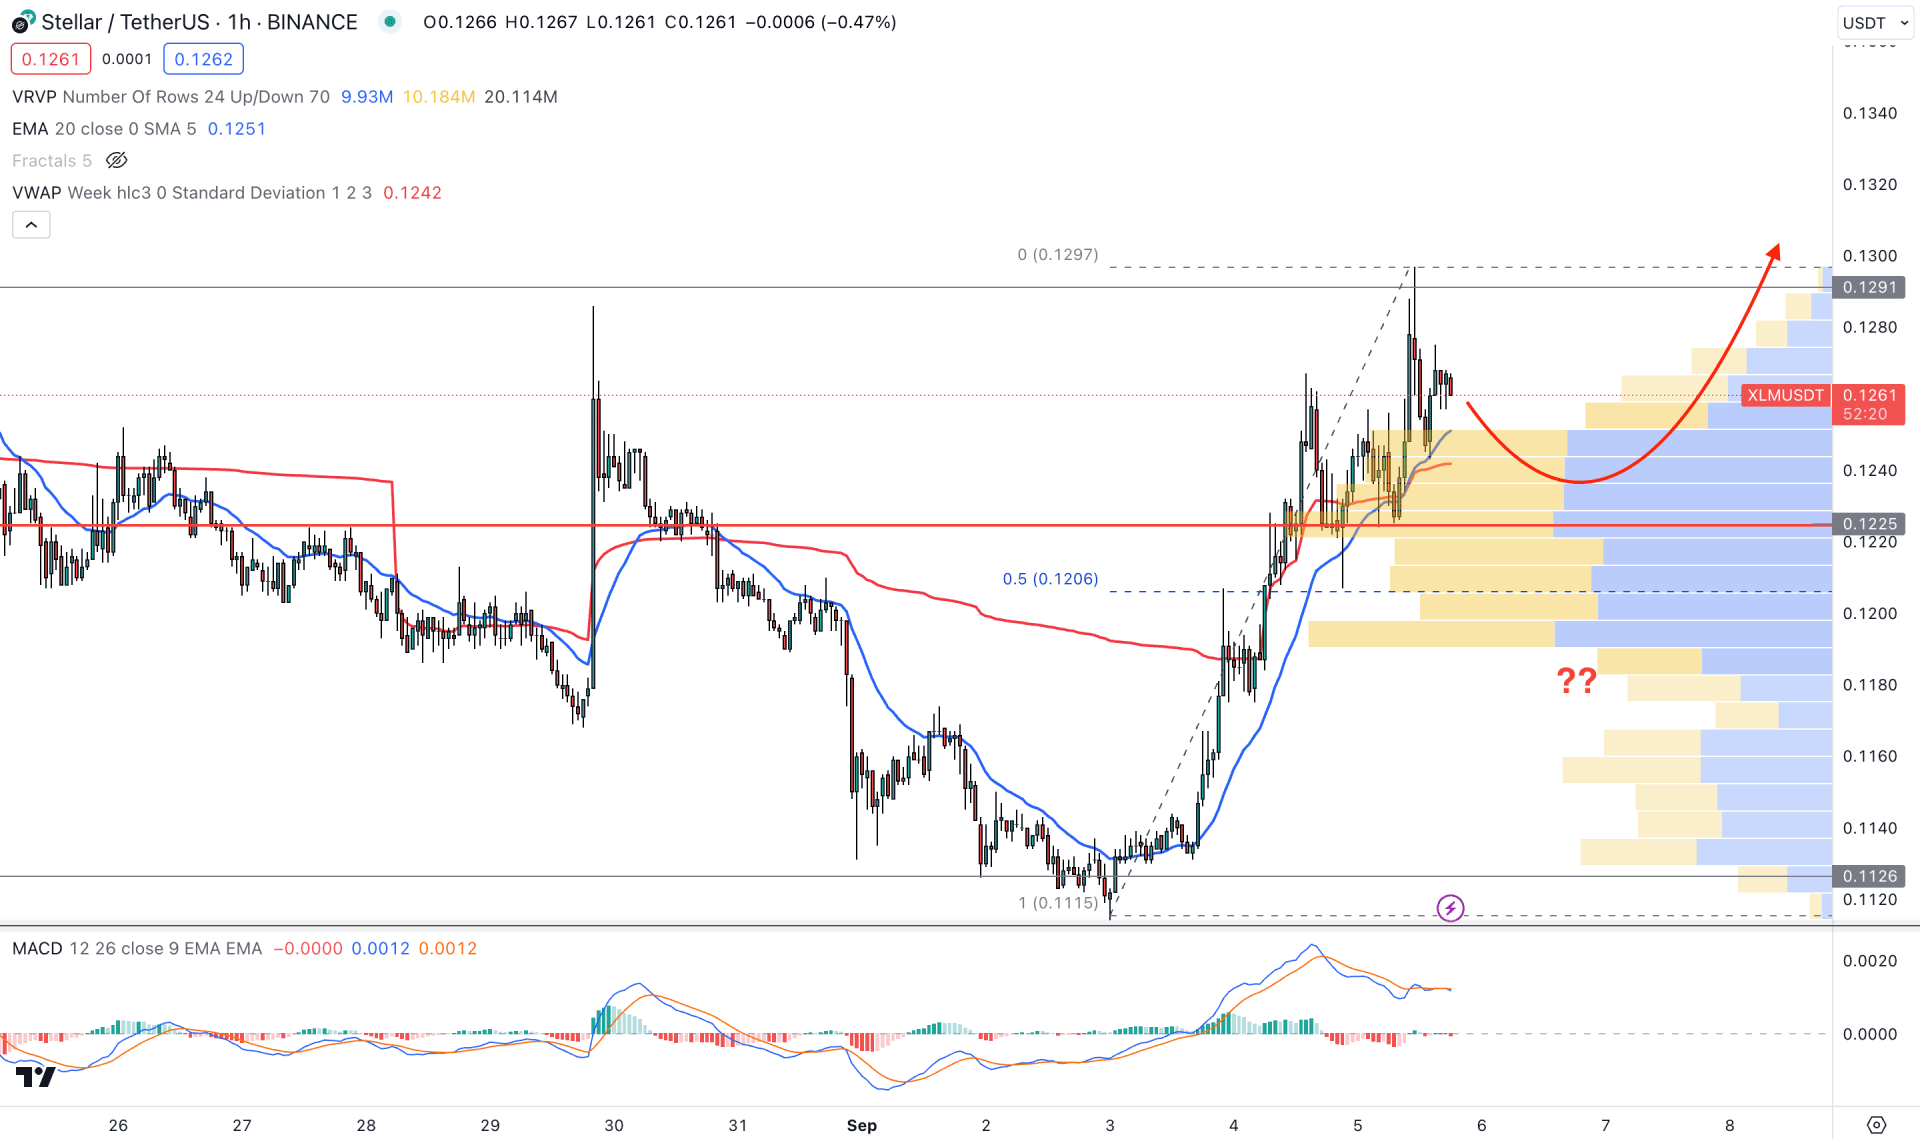
In the hourly time frame, the overall market direction for the XLM/USDT is bullish as the current price is backed by a bullish visible range high volume level.
In the main chart, the dynamic 20 EMA and weekly VWAP work as near-term dynamic support, while the current MACD Histogram is corrective at the neutral level. Moreover, a divergence is visible between the price swing and the MACD Histogram, which suggests a minor downside possibility in the market.
Based on the h1 structure, we may consider the bearish possibility as potent for this pair, but a bullish rebound from 0.1200 to 0.1160 area would be a potential long opportunity. However, a sharp downside momentum with a bearish H4 candle below the 0.1170 level could lower the price toward the 0.1100 level.
Based on the current multi-timeframe analysis, Steller (XLM) price trades within a buying pressure, which might increase the upward correction in the coming days. However, a valid bullish break from the daily rectangle pattern is crucial to consider it a conservative buy.


